

A comparison of five methods of measuring mammographic density: a case-control study
- PMID: 29402289
- PMCID: PMC5799922
- DOI: 10.1186/s13058-018-0932-z
A comparison of five methods of measuring mammographic density: a case-control study
Abstract
Background: High mammographic density is associated with both risk of cancers being missed at mammography, and increased risk of developing breast cancer. Stratification of breast cancer prevention and screening requires mammographic density measures predictive of cancer. This study compares five mammographic density measures to determine the association with subsequent diagnosis of breast cancer and the presence of breast cancer at screening.
Methods: Women participating in the "Predicting Risk Of Cancer At Screening" (PROCAS) study, a study of cancer risk, completed questionnaires to provide personal information to enable computation of the Tyrer-Cuzick risk score. Mammographic density was assessed by visual analogue scale (VAS), thresholding (Cumulus) and fully-automated methods (Densitas, Quantra, Volpara) in contralateral breasts of 366 women with unilateral breast cancer (cases) detected at screening on entry to the study (Cumulus 311/366) and in 338 women with cancer detected subsequently. Three controls per case were matched using age, body mass index category, hormone replacement therapy use and menopausal status. Odds ratios (OR) between the highest and lowest quintile, based on the density distribution in controls, for each density measure were estimated by conditional logistic regression, adjusting for classic risk factors.
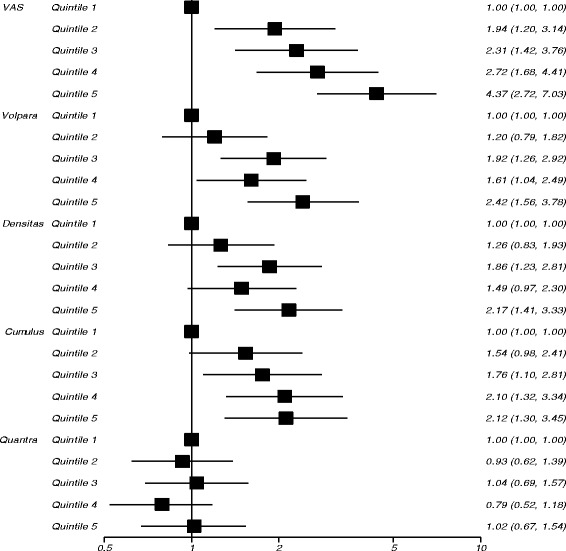
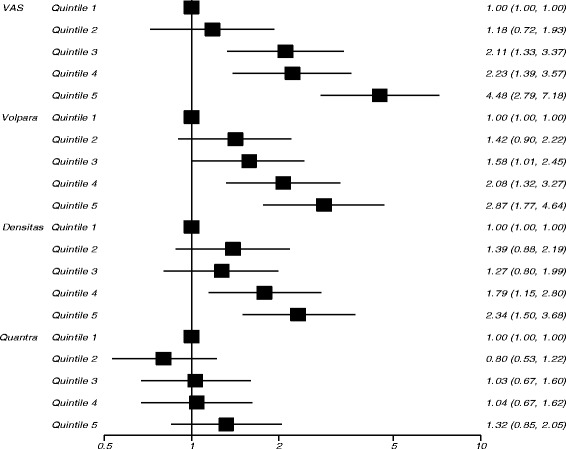
Results: The strongest predictor of screen-detected cancer at study entry was VAS, OR 4.37 (95% CI 2.72-7.03) in the highest vs lowest quintile of percent density after adjustment for classical risk factors. Volpara, Densitas and Cumulus gave ORs for the highest vs lowest quintile of 2.42 (95% CI 1.56-3.78), 2.17 (95% CI 1.41-3.33) and 2.12 (95% CI 1.30-3.45), respectively. Quantra was not significantly associated with breast cancer (OR 1.02, 95% CI 0.67-1.54). Similar results were found for subsequent cancers, with ORs of 4.48 (95% CI 2.79-7.18), 2.87 (95% CI 1.77-4.64) and 2.34 (95% CI 1.50-3.68) in highest vs lowest quintiles of VAS, Volpara and Densitas, respectively. Quantra gave an OR in the highest vs lowest quintile of 1.32 (95% CI 0.85-2.05).
Conclusions: Visual density assessment demonstrated a strong relationship with cancer, despite known inter-observer variability; however, it is impractical for population-based screening. Percentage density measured by Volpara and Densitas also had a strong association with breast cancer risk, amongst the automated measures evaluated, providing practical automated methods for risk stratification.
Keywords: Breast density; Cancer; Case-control; PROCAS; Risk.
Conflict of interest statement
Ethics approval and consent to participate
Ethics approval for the study was through the North Manchester Research Ethics Committee (09/H1008/81). Informed consent was obtained from all participants on entry to the PROCAS study.
Consent for publication
Not applicable.
Competing interests
Software licences for Volpara, Quantra and Densitas were provided free of charge under a research agreement by Volpara Health Technologies (Wellington, New Zealand), Hologic Inc (Marlborough, MA, USA) and Densitas Inc (Halifax, NS, Canada) respectively. The authors declare that they have no competing interests.
Publisher’s Note
Springer Nature remains neutral with regard to jurisdictional claims in published maps and institutional affiliations.
Figures
References
-
- Andreas P, Graff RE, Ursin G, dos Santos Silva I, McCormack V, Baglietto L, et al. Mammographic Density Phenotypes and Risk of Breast Cancer: A Meta-analysis, JNCI: Journal of the National Cancer Institute. 2014;106(5). https://doi.org/10.1093/jnci/dju078. - DOI - PMC - PubMed
Publication types
MeSH terms
Grants and funding
LinkOut - more resources
Full Text Sources
Other Literature Sources
Medical
