Multicenter Study
. 2018 May;31(5):614-623.
doi: 10.1016/j.echo.2017.12.009. Epub 2018 Feb 21.

Morphologic Analysis of the Normal Right Ventricle Using Three-Dimensional Echocardiography-Derived Curvature Indices

Affiliations
Multicenter Study

Morphologic Analysis of the Normal Right Ventricle Using Three-Dimensional Echocardiography-Derived Curvature Indices

Karima Addetia et al. J Am Soc Echocardiogr. 2018 May.

Abstract

Background: Right ventricular (RV) remodeling involves changes in size, wall thickness, function, and shape. Previous studies have suggested that regional curvature indices (rCI) may be useful for RV shape analysis. The aim of this study was to establish normal three-dimensional echocardiographic values of rCI in a large group of healthy subjects to facilitate future three-dimensional echocardiographic study of adverse RV remodeling.

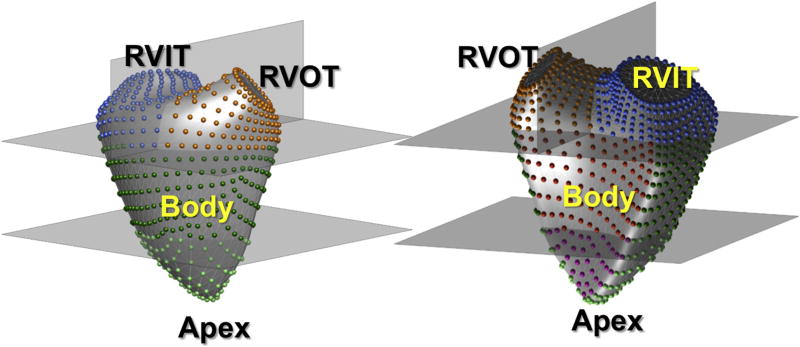
Methods: RV endocardial surfaces were reconstructed at end-diastole and end-systole in 245 healthy subjects (mean age, 42 ± 12 years) and analyzed using custom software to calculate mean curvature in six regions: RV inflow tract (RVIT) and RV outflow tract, apex, and body (both divided into free wall and septal regions). Associations with age and gender were studied.

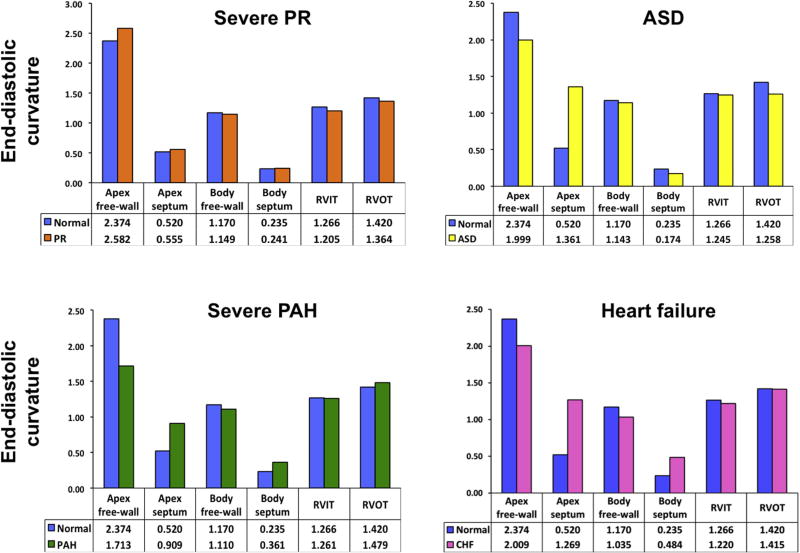
Results: The apical free wall was convex, while the septum (apex and body) was more concave than the body free wall. Septal curvature did not change significantly from end-diastole to end-systole. The RV outflow tract and RVIT became flatter from end-diastole to end-systole. In keeping with the "bellows-like" action of RV contraction, the body free wall became flatter, while the apex free wall changed to a more convex surface. There were no intergender differences in rCI. In older subjects (≥55 years of age), the RV free wall and RV outflow tract were flatter, and from end-diastole to end-systole, the RVIT became less flattened and the apex less pointed. These changes suggest that the right ventricle is stiffer in older subjects, with less dynamic contraction of the RVIT and less bellows-like movement.

Conclusions: This study established normal three-dimensional echocardiographic values for RV rCI, which are needed to further study RV diastolic dysfunction and remodeling with disease.

Keywords: Curvature; Normal heart; Right ventricle; Three-dimensional echocardiography.


Conflict of interest statement

Conflicts of Interest: None.

Figures

Figure 1
Figure 1
RV surface wall curvature is described from a point of view outside the right ventricle looking onto the wall in question. For instance, when describing septal curvature, the eye is looking at the septum from a point in the left ventricle. When describing free wall curvature, the eye is looking at the free wall from a vantage point outside the ventricle.
Figure 2
Figure 2
The 3D endocardial surface of the right ventricle was automatically divided into four parts: one-fourth apex, two-fourths body, and one-fourth RVOT and RVIT. The RV apex and body were further subdivided into free wall and septal components. Accordingly, the RV surface was divided into six regions: (1) RVIT, (2) RVOT, (3) septal free wall, (4) body free wall, (5) septal apex, and (6) apex free wall.
Figure 3
Figure 3
Graph representing the mean total RV volume throughout the cardiac cycle for the entire cohort of 245 healthy subjects with SD (left). The right panel depicts the regional RV volumes throughout the cardiac cycle. Body volumes are the largest, followed by RVOT, RVIT, and apex.
Figure 4
Figure 4
Example of a color-coded curvature map for a normal subject is shown from the free wall perspective (left) and from the septal perspective (right). The color scale bar on the far right matches the colors on the map, with curvature values ranging from −1.5 to 2.5. The deepest red signifies the most convex surface (and most positive curvature values); the deepest blue corresponds to the most concave surface (and most negative curvature values). The green midpoint signifies a horizontal (flat) surface with curvature value 0.
Figure 5
Figure 5
Diagrammatic representation of the transition in curvature values from end-diastole to end-systole. The gray mesh represents the right ventricle in end-diastole and the blue solid frame the right ventricle in end-systole in a representative normal subject. The apical free wall becomes more pointed (black arrows at apex), and the body free wall flattens, as do the RVOT and RVIT (see arrows at respective positions). There was no change in septal curvature during the transition from end-diastole to end-systole.
Figure 6
Figure 6
Age-related changes in curvature for each of the regions (apical free wall, top left; apical septum, top middle; RVIT, top right; body free wall, bottom left; body septum, bottom middle; and RVOT, bottom right). Solid bars represent mean curvature values in end-diastole, while hatched bars represent mean curvature values in end-systole. Stars represent statistically significant differences between groups denoted by the horizontal color-coded brackets. See text for details.
Figure 7
Figure 7
Bar graphs comparing end-diastolic regional curvature values for the normal cohort analyzed in this study (blue bars) and patients with select RV pathologies (colored bars): top left, chronic severe pulmonary regurgitation (PR); top right, secundum-type ASD with moderate pulmonary hypertension; bottom left, severe pulmonary arterial hypertension (PAH); bottom right, acute, decompensated heart failure (CHF). See text for details.
Figure 8
Figure 8
Regional color-coded parametric end-diastolic regional curvature maps for each right ventricle plotted in Figure 6. The colored bar on the far right represents the color-curvature legend. Red and orange hues represent varying degrees of convexity, with the reddest hues representing the most convex surface. Green represents a flat surface (curvature = 0). Blue hues represent varying degrees of concavity, with the darkest blue representing the most concave surface. Each right ventricle (except for the one on the bottom right) is displayed from the free wall perspective and the septal perspective. The pathologies are labeled: top left (A), chronic severe pulmonary regurgitation (PR); top right (B), secundum-type ASD with moderate pulmonary hypertension; bottom left (C), severe pulmonary arterial hypertension (PAH); bottom right (D), patient with acute, decompensated heart failure. The yellow arrows point to the apex and the white arrows to the septum. See text for details.

References

    1. Ryan T, Petrovic O, Dillon JC, Feigenbaum H, Conley MJ, Armstrong WF. An echocardiographic index for separation of right ventricular volume and pressure overload. J Am Coll Cardiol. 1985;5:918–27. - PubMed
    1. Sheehan FH, Ge S, Vick GW, III, Urnes K, Kerwin WS, Bolson EL, et al. Three-dimensional shape analysis of right ventricular remodeling in repaired tetralogy of Fallot. Am J Cardiol. 2008;101:107–13. - PubMed
    1. Kang DK, Thilo C, Schoepf UJ, Barraza JM, Jr, Nance JW, Jr, Bastarrika G, et al. CT signs of right ventricular dysfunction: prognostic role in acute pulmonary embolism. JACC Cardiovasc Imaging. 2011;4:841–9. - PubMed
    1. Topilsky Y, Khanna A, Le Tourneau T, Park S, Michelena H, Suri R, et al. Clinical context and mechanism of functional tricuspid regurgitation in patients with and without pulmonary hypertension. Circ Cardiovasc Imaging. 2012;5:314–23. - PubMed
    1. Maffessanti F, Lang RM, Corsi C, Mor-Avi V, Caiani EG. Feasibility of left ventricular shape analysis from transthoracic real-time 3-D echocardiographic images. Ultrasound Med Biol. 2009;35:1953–62. - PubMed

Publication types