. 2018;45(2):639-655.
doi: 10.1159/000487120. Epub 2018 Jan 29.

The CFTR-Associated Ligand Arrests the Trafficking of the Mutant ΔF508 CFTR Channel in the ER Contributing to Cystic Fibrosis

Affiliations

The CFTR-Associated Ligand Arrests the Trafficking of the Mutant ΔF508 CFTR Channel in the ER Contributing to Cystic Fibrosis

Emily Bergbower et al. Cell Physiol Biochem. 2018.

Abstract

Background/aims: The CFTR-Associated Ligand (CAL), a PDZ domain containing protein with two coiled-coil domains, reduces cell surface WT CFTR through degradation in the lysosome by a well-characterized mechanism. However, CAL's regulatory effect on ΔF508 CFTR has remained almost entirely uninvestigated.

Methods: In this study, we describe a previously unknown pathway for CAL by which it regulates the membrane expression of ΔF508 CFTR through arrest of ΔF508 CFTR trafficking in the endoplasmic reticulum (ER) using a combination of cell biology, biochemistry and electrophysiology.

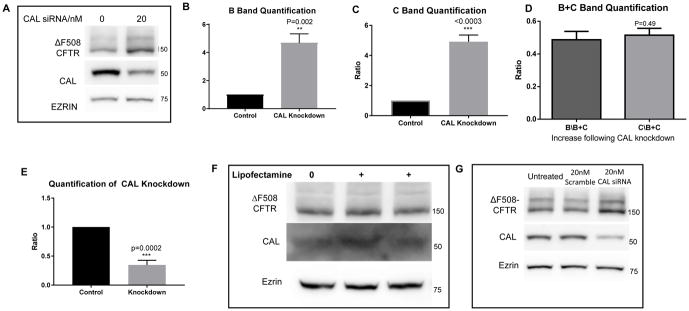
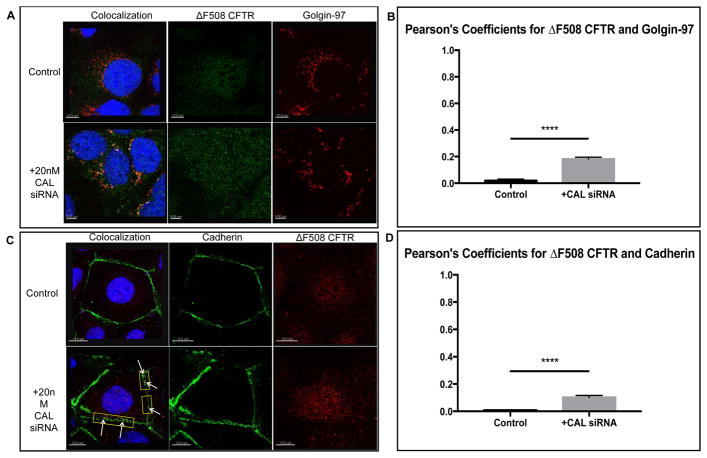
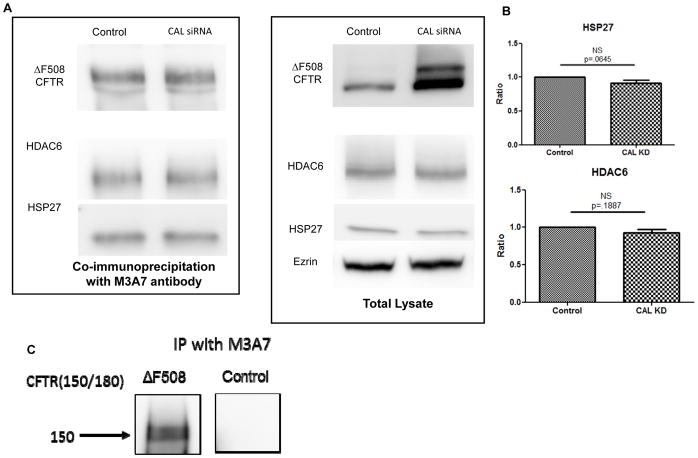
Results: We demonstrate that CAL is an ER localized protein that binds to ΔF508 CFTR and is degraded in the 26S proteasome. When CAL is inhibited, ΔF508 CFTR retention in the ER decreases and cell surface expression of mature functional ΔF508 CFTR is observed alongside of enhanced expression of plasma membrane scaffolding protein NHERF1. Chaperone proteins regulate this novel process, and ΔF508 CFTR binding to HSP40, HSP90, HSP70, VCP, and Aha1 changes to improve ΔF508 CFTR cell surface trafficking.

Conclusion: Our results reveal a pathway in which CAL regulates the cell surface availability and intracellular retention of ΔF508 CFTR.

Keywords: Endoplasmic reticulum; F508-del CFTR; Maturation; PDZ-domain; Trafficking.


Conflict of interest statement

CONFLICT OF INTEREST: The authors declare that WBG has a consultant agreement with the Vertex Corporation. LC has a license agreement with the Vertex Corporation for mutant cell lines. LC has a contract with Acetylon Pharmaceuticals. None of the authors have any financial interests that pertain directly to this work.

Figures

Fig. 1
Fig. 1
CAL knockdown increases intracellular levels of the immature and mature forms of ΔF508 CFTR. (1A) ΔF508-CFBE cells were transfected with 20nM of CAL specific siRNA for 48 hours. Lysates were collected and run on western blots to assess the efficacy of the siRNA. CAL knockdown is clearly visible and ezrin is used as a loading control. (1B) Changes in immature ΔF508 CFTR (B band) were quantified in bar graph form from western blots 6 individual experiments. The increase in B band was determined to be statistically significant by two-sided one sample t-test compared to 1. Error bars, SE. (1C) Changes in mature ΔF508 CFTR (C band) were quantified in bar graph form from western blots of 6 individual experiments. The increase in C band was determined to be statistically significant by student’s t-test Error bars, SE. Ratios for (B) and (C) were normalized to control by dividing each of the control band densities measured in the presence of normal levels of CAL and the CAL knockdown densities by the control band intensities (1D) Changes in the ratio of the B/B+C and the C/B+C ratios following CAL knockdown. The data were calculated from (B&C). One can see that knocking down CAL increased both mature and immature bands of CFTR but their respective ratio to the total quantity of CFTR remained unchanged. (1E) CAL was quantified by western blot, to assess median percent knockdown. Results are presented as a bar graph and median knockdown is 76% which was deemed statistically significant by two-sided one sample t-test compared to 1. Error bars, SE. (n=6). **p<0.01; ***p<0.001. (1F–G) Lipofectamine treatment or transfection with a negative scramble siRNA have no effect on CAL or levels of ΔF508 CFTR in total lysate. (1F) ΔF508-CFBE cells were treated with transfection agent lipofectamine alone for 48 hours. Lysates were collected and run on western blots to assess the effect of lipofectamine on ΔF508 CFTR in total lysate. No effect can be seen. Ezrin is used as a loading control. (1G) ΔF508-CFBE cells were transfected with either 20nM of CAL specific siRNA or 20nM of All Stars Universal Negative Scramble siRNA from Qiagen for 48 hours. Lysates were collected and run on western blots to assess the efficacy of the negative scramble versus the CAL siRNA. The negative scramble has no effect of intracellular levels of ΔF508 CFTR. CAL knockdown is clearly visible in CAL siRNA transfected samples and ezrin is used as a loading control
Fig. 2
Fig. 2
CAL binds to ΔF508 CFTR, localizes to the ER, and is degraded by the 26S proteasome. (2A) COS-7 cells were either transfected with GFP-ΔF508CFTR, GFP-WTCFTR, and/or HA-CAL plasmids for 48 hours. Cell lysates were collected and used in co-immunoprecipitation experiments with A/G beads and GFP antibody (n=3). Samples were assessed via western blot and probed for GFP and HA to detect binding of tagged proteins. Binding of WT CFTR to HA-CAL (Lane 3) and binding of ΔF508 CFTR to HA-CAL (Lane 5) are detectable in the Co-IP fractions. Untransfected COS-7 cells were used as a negative control (Lane 1). Please note that although HA-CAL was transfected, CAL was detected using an anti-CAL antibody produced in the laboratory [11]. The small difference in molecular wt. between endogenous CAL and transfected CAL represents the addition of the HA tag. (2B) ΔF508-CFBE cells were plated on coverslips and transfected with KDEL td-tomato plasmid for 48 hours. Cells were fixed, and stained with 4′,6-diamidino-2-phenylindole (DAPI; blue, nucleus) and antibodies against PIST (green, CAL). KDEL is detected by its tomato tag (red). Representative extended focus images are shown. (2C) ΔF508-CFBE cells were either transfected with HA-CAL plasmid or left untransfected for 48 hours. (2D–E) Quantification of C band and B band respectively. Data normalized to the control. (2F) Quantification of CAL, data normalized to control. Cells were treated with MG-132 for 12 hours. Lysates were collected and run on western blots (4 individual experiments). Westerns were probed for CFTR, CAL, and Ezrin (loading control). All images come from the same gel but some lanes have been cropped (denoted by a line marking the site of the crop) since it was a dose dependent experiment. CAL protein levels were quantified and the increase in CAL protein with MG-132 treatment was established to be statistically significant by two-sided one sample t-test compared to 1. Error Bars, SE. (n=3 independent experiments and quantification was performed on four cells from each slide. *p<0.05; **p<0.01; ****p<0.0001
Fig. 3
Fig. 3
Treatment with bafilomycin and tubacin does not have a significant effect on ΔF508 CFTR levels in total lysate. ΔF508-CFBE cells were either transfected with HA-CAL plasmid or left untransfected for 48 hours. Cells were treated with Tubacin or Bafilomycin for 12 hours. Lysates were collected and run on western blots (4 individual experiments). Westerns were probed for CFTR, CAL, and Ezrin (loading control). All images come from the same gel but some lanes have been cropped. Comparisons to control lane 1 were made with ordinary one-ANOVA using Dunnett’s multiple comparison test (n=3).
Fig. 4
Fig. 4
CAL knockdown creates mature cell surface ΔF508 CFTR. (4A) ΔF508-CFBE cells were transfected with 20nM CAL specific siRNA for 48 hours. Lysates were collected from control and siRNA treated cells, and used in biotinylation assays to assess cell surface expression of the ΔF508 CFTR. Samples from the biotinylated fractions and the total lysate fractions were run on western blots (4 individual experiments). Western blots were probed for CFTR, CAL, and Ezrin. Ezrin is both a loading control for total lysate (bottom) and a control for the biotinylation (top) since ezrin is not expressed at the plasma membrane and as such is completely absent from all biotinylated samples. (4B) C band from the siRNA transfected ΔF508-CFBE biotinylated samples. A small amount of CAL in the biotinylated fractions most likely represents binding to CFTR during the streptavidin pull-down. (Top: lane 3) were quantified from 4 individual experiments and compared against the null for statistical significance by two-sided one sample t-test compared to 0. The result is significant with **p>0.01. Error bars, SE.
Fig. 5
Fig. 5
CAL changes ΔF508 CFTR intracellular distribution and arrests its trafficking in the ER. (5A) ΔF508-CFBE cells were plated on coverslips and transfected with 20nM of CAL specific siRNA for 48 hours. Cells were then fixed and stained with DAPI (blue, nucleus) and antibodies against PIST (green, CAL) and CFTR 769 (red, ΔF508-CFTR). CFTR antibody 769 targets NBD2 (aa 1204–1211). Representative extended focus images are shown. (5B) The graph shows Pearson’s correlation coefficients of ΔF508-CFTR and CAL when CAL is inhibited compared to control samples. The coefficients were calculated using Imaris Imaging Software. Pearson’s correlation coefficients were reduced by CAL knockdown. Results are means ±SE. (n = 5) ****p<0.0001. (5C) ΔF508-CFBE cells were plated on coverslips and transfected with 20nM of CAL specific siRNA for 48 hours. Cells were also transfected with KDEL td-tomato plasmid (red, ER). Cells were fixed and stained with DAPI (blue, nucleus) and antibodies against CFTR 769 (green, ΔF508 CFTR). Representative extended focus images are shown. (5D) The graph shows Pearson’s correlation coefficients of ΔF508-CFTR and KDEL when CAL is inhibited compared to control samples. The coefficients were calculated using Imaris Imaging Software. Pearson’s correlation coefficients were reduced by CAL knockdown. Results are means ±SE. (n = 5) ****p<0.0001 using a two-sided two sample “t” test. N=number of independent experiments.
Fig. 6
Fig. 6
CAL inhibition causes ΔF508 CFTR trafficking to the plasma membrane through the Golgi apparatus. (6A) ΔF508-CFBE cells were plated on coverslips and transfected with 20nM of CAL specific siRNA for 48 hours. Cells were fixed and stained with DAPI (blue, nucleus) and antibodies against Golgin-97 (red, Golgi) and CFTR 769 (green, ΔF508 CFTR). CFTR antibody 769 targets NBD2 (aa 1204–1211). Representative extended focus images are shown. (6B) The graph shows Pearson’s correlation coefficients of ΔF508-CFTR and Golgin-97 when CAL is inhibited compared to control samples. The coefficients were calculated using Imaris Imaging Software. Pearson’s correlation coefficients were increased with CAL knockdown. Results are means ±SE. (n = 5) ****p<0.0001. (6C) ΔF508-CFBE cells were plated on coverslips and transfected with 20nM of CAL specific siRNA for 48 hours. Cells were fixed and stained with DAPI (blue, nucleus) and antibodies against pan-cadherin (green, plasma membrane) and CFTR 769 (red, ΔF508 CFTR). Areas of colocalization give off a yellow signal (yellow boxes, white arrows). Representative extended focus images are shown. (6D) The graph shows Pearson’s correlation coefficients of ΔF508-CFTR and cadherin when CAL is inhibited compared to control samples. The coefficients were calculated using Imaris Imaging Software. Pearson’s correlation coefficients were increased with CAL knockdown. Results are means ±SE. (n = 5) ****p<0.0001 using a two-sided two sample “t” test. N=number of independent experiments.
Fig. 7
Fig. 7. HDAC6 and HSP27 binding to ΔF508 CFTR is unaffected by CAL knockdown
(7A) ΔF508-CFBE cells were transfected with CAL specific siRNA for 48 hours. Lysates were collected and used in co-immunoprecipitation experiments with A/G beads and CFTR specific antibody M3A7 (to pulldown ΔF508 CFTR). Samples from the co-immunoprecipitation fraction (left panel) and from the total lysate fraction (right panel) were assessed by western blot. (7B) (5 individual experiments, p value was not significant). Membranes were probed with antibodies against CFTR, HDAC6, HSP27, and Ezrin (loading control). CAL knockdown for this experiment is shown in total lysate of Fig. 8B of this paper. (7C) Control experiment was performed where an immunoprecipitation was performed with (left panel) CFTR or without (right panel) CFTR antibodies. Please note that there are no bands in the control lane indicating that protein does not bind non-specifically to the beads. Methods: 2000 mg protein was used for IP. Samples and lysis buffer (with Halt protease inhibitor) totaled 1 mL with 7uL M3A7 and 120uL beads: for control, sample with lysis buffer 1 mL with 120uL beads but no antibody. The two experiments were taken from the same blot.
Fig. 8
Fig. 8
CAL inhibition changes ΔF508 CFTR binding to chaperone proteins in order to improve ΔF508 CFTR cell surface trafficking. (8A) ΔF508-CFBE cells were transfected with CAL specific siRNA for 48 hours. Lysates were collected and used in co-immunoprecipitation experiments with A/G beads and CFTR specific antibody M3A7 (to pulldown ΔF508 CFTR). Samples from the co-immunoprecipitation fraction (left panel) and from the total lysate fraction (right panel) were assessed by western blot (5 individual experiments). Membranes were probed with antibodies against CFTR, HSP90, VCP, HSP40, HSP90, Aha1, CAL, and Ezrin (loading control). CAL knockdown is visible in total lysate. (8B) Changes in ΔF508 CFTR binding to HSP40, HSP90, HSP70, VCP, and Aha1 were quantified in bar graph form from western blots of replicate experiments. Error bars, SE. Data were analyzed by a two-sided one sample t-test compared to 1. *p<0.05
Fig. 9
Fig. 9
NHERF1 acts as a scaffold for ΔF508 CFTR at the plasma membrane when CAL is inhibited. ΔF508-CFBE cells were transfected with 20nM of CAL specific siRNA for 48 hours. Lysates were collected and assessed by western blot. Membranes were probed for CFTR, NHERF1, CAL, TC10, and ezrin (loading control). Changes in NHERF1 protein levels were quantified in bar graph form from western blots of 3 individual experiments. The increase in NHERF1 protein when CAL is inhibited is statistically significant. Error Bars, SE. Changes in NHERF1 protein levels were quantified in bar graph form from western blots of replicate experiments. The decrease in NHERF1 protein when CAL is overexpressed is statistically significant by two-sided one sample t-test compared to 1; p<0.05. Error bars, SE.
Fig. 10
Fig. 10
CAL inhibition enhances ΔF508 CFTR chloride current by short circuit current. (10A) Cells were plated in snapwell filters and transfected with 20nM of CAL siRNA or for 48 hours. Measurements were performed in a six-channel Easy-Mount chamber system that accepts Snapwell filters. ISC was measured with a VCCMC6 multichannel voltage-current clamp amplifier. Normalized Δ Isc and absolute magnitude of the transepithelial resistance (TER) is presented in bar graph form. Error bars, SE. (10B) This current amplitude graph (10C) displays the same data shown in (A). Note that cells were treated with forskolin, genistein and CFTR inh-172 and chloride current levels were recorded throughout. To accomplish these experiments we split a T75 flask among 6 wells to ensure that the Snapwell filters reach confluence within 4 days. Data analyzed using ANOVA with Tukey multiple comparisons test; ***p<0.001

Similar articles

Cited by

References

    1. Kerem BS, Rommens JM, Buchanan JA, Markiewicz D, Cox TK, Chakravarti A, Buckwald M, Tsui LC. Identification of the cystic fibrosis gene: Genetic analysis. Sci. 1989;245:1073–1080. - PubMed
    1. Pilewski JM, Frizzell RA. Role of CFTR in airway disease. Physiol Rev. 1999;79:S215–S255. - PubMed
    1. Rosenstein BJ. Cystic fibrosis diagnosis: New dilemmas for an old disorder. Ped Pulm. 2002;33:83–84. - PubMed
    1. Sheppard DN, Welsh MJ. Structure and function of the CFTR chloride channel. Physiol Rev. 1999;79:S23–S45. - PubMed
    1. Sosnay PR, Siklosi KR, Van GF, Kaniecki K, Yu H, Sharma N, Ramalho AS, Amaral MD, Dorfman R, Zielenski J, Masica DL, Karchin R, Millen L, Thomas PJ, Patrinos GP, Corey M, Lewis MH, Rommens JM, Castellani C, Penland CM, Cutting GR. Defining the disease liability of variants in the cystic fibrosis transmembrane conductance regulator gene. Nat Genet. 2013;45:1160–1167. - PMC - PubMed

MeSH terms

Substances