. 2018 Feb 5;8(1):2362.
doi: 10.1038/s41598-018-19658-7.

Canagliflozin, an SGLT2 inhibitor, attenuates the development of hepatocellular carcinoma in a mouse model of human NASH

Affiliations

Canagliflozin, an SGLT2 inhibitor, attenuates the development of hepatocellular carcinoma in a mouse model of human NASH

Kumiko Shiba et al. Sci Rep. .

Abstract

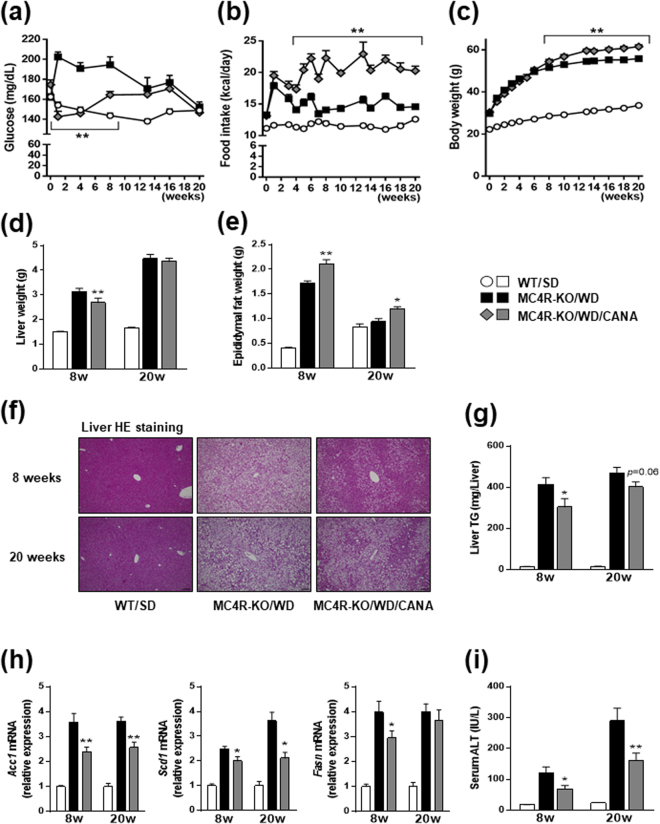
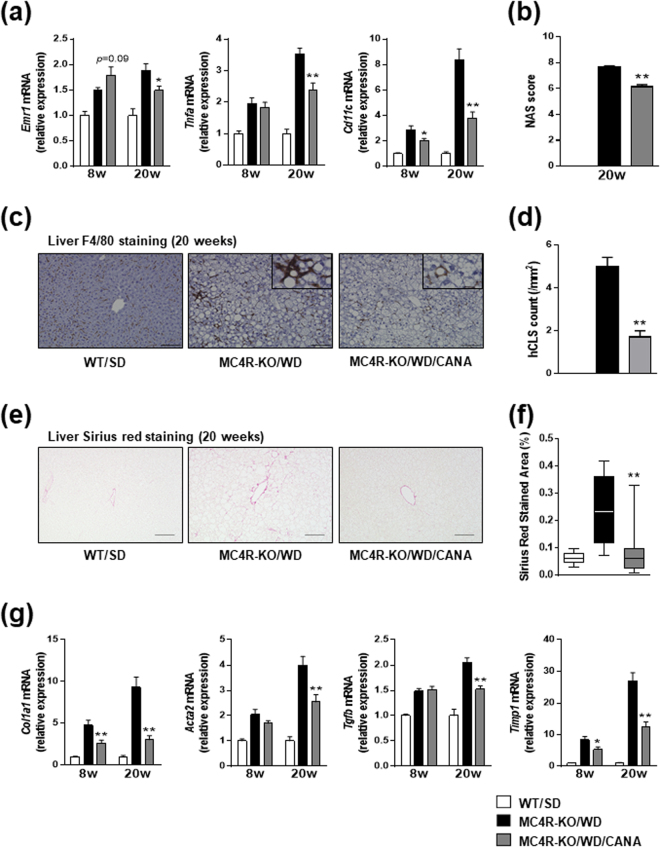
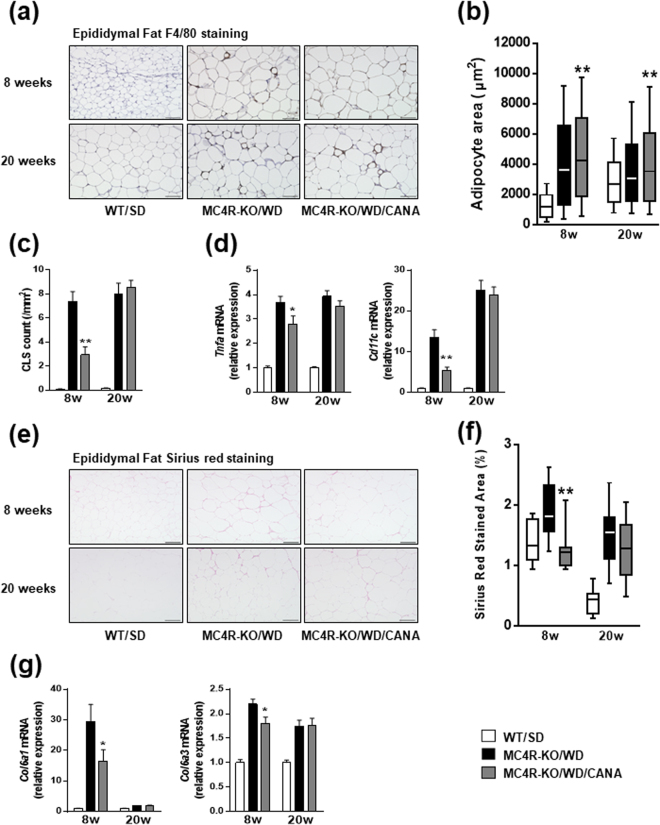
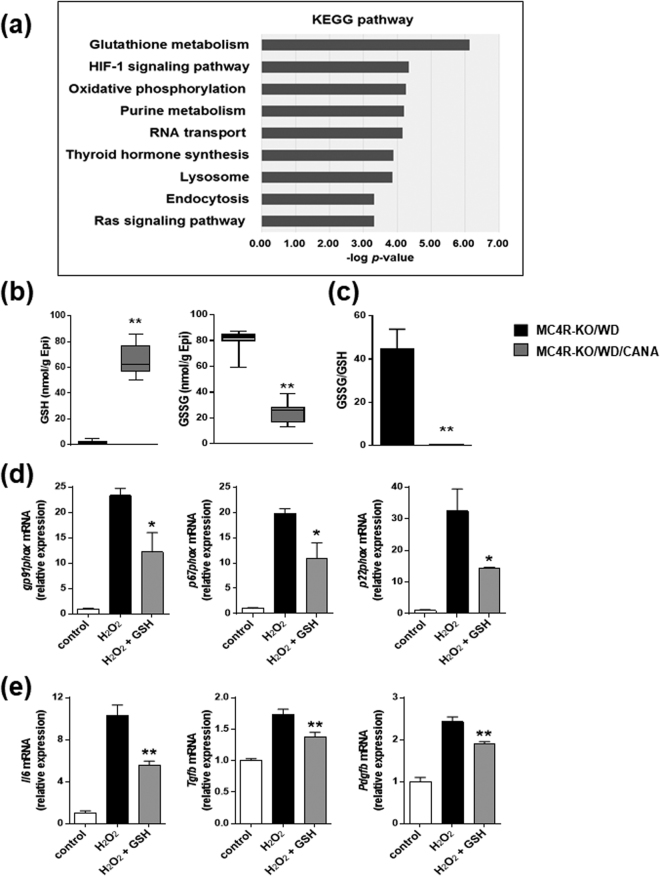
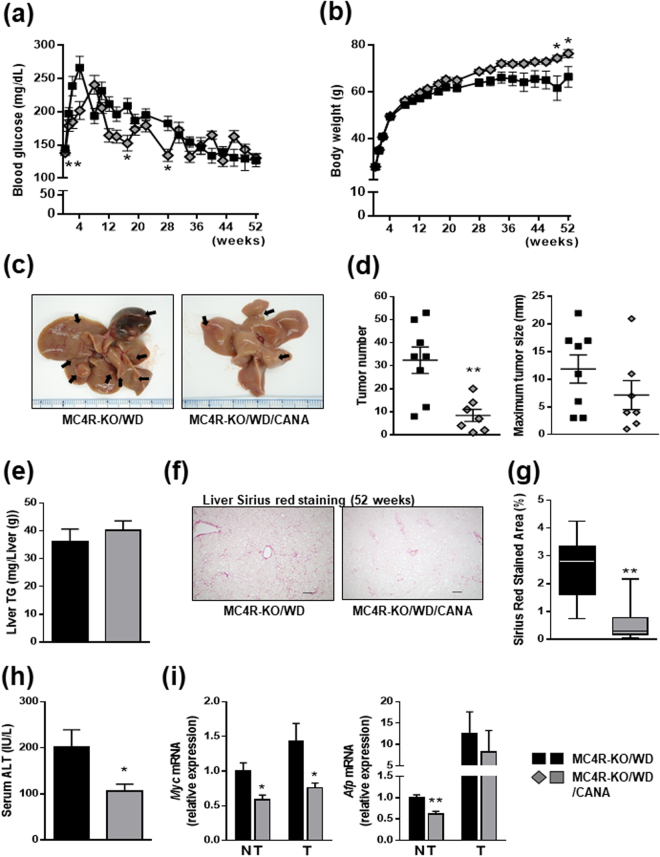
Sodium glucose cotransporter 2 (SGLT2) inhibitors, an antidiabetic drug, promotes urinary excretion of glucose by blocking its reabsorption in the renal proximal tubules. It is unclear whether SGLT2 inhibition could attenuate nonalcoholic steatohepatitis (NASH) and NASH-associated hepatocellular carcinoma. We examined the preventive effects of an SGLT2 inhibitor canagliflozin (CANA) in Western diet (WD)-fed melanocortin 4 receptor-deficient (MC4R-KO) mice, a mouse model of human NASH. An eight-week CANA treatment attenuated hepatic steatosis in WD-fed MC4R-KO mice, with increased epididymal fat mass without inflammatory changes. CANA treatment for 20 weeks inhibited the development of hepatic fibrosis in WD-fed MC4R-KO mice. After one year of CANA treatment, the number of liver tumors was significantly reduced in WD-fed MC4R-KO mice. In adipose tissue, CANA suppressed the ratio of oxidative to reduced forms of glutathiones (GSSG/GSH) in WD-fed MC4R-KO mice. Treatment with GSH significantly attenuated the H2O2-induced upregulation of genes related to NADPH oxidase in 3T3-L1 adipocytes, and that of Il6, Tgfb, and Pdgfb in RAW264.7 cells. This study provides evidence that SGLT2 inhibitors represent the unique class of drugs that can attenuate or delay the onset of NASH and eventually hepatocellular carcinoma, at least partly, through "healthy adipose expansion".


Conflict of interest statement

M.I. is the recipient of research funding from Shionogi & Co., Ltd.

Figures

Figure 1
Figure 1
CANA attenuates hepatic steatosis in WD-fed MC4R-KO mice. The changes in (a) blood glucose level, (b) food intake, and (c) body weight during CANA treatment for 20 weeks. Weights of the (d) liver and (e) epididymal fat after 8 and 20 weeks of CANA treatment. (f) Hematoxylin and eosin (HE) staining and (g) triglyceride (TG) content of the liver. (h) Expression levels of lipogenesis-related genes in the liver. (i) Serum ALT levels. WT, wild type; SD, standard diet; WD, Western diet; CANA, canagliflozin. Original magnification, x200. Scale bars, 100 μm. *p < 0.05, **p < 0.01 vs MC4R-KO/WD. Statistical analyses were performed using two-way (a,b and c) or one-way ANOVA (d,e,g,h and i) followed by Bonferroni post hoc test; MC4R-KO/WD and MC4R-KO/WD/CANA was pre-selected as a subset of means to compare. n = 15.
Figure 2
Figure 2
CANA inhibits hepatic inflammation and fibrosis in WD-fed MC4R-KO mice. (a) Expression levels of inflammation-related genes in the liver. (b) NAFLD activity score (NAS). (c) F4/80 immunohistochemical analysis of the liver. (d) Quantification of the number of hepatic crown-like structure (hCLS) in the liver. (e) Sirius red staining of the liver sections and (f) quantification. (g) Expression levels of fibrosis-related genes in the liver. Original magnification, ×200. Scale bars, 100 μm. *p < 0.05, **p < 0.01 vs MC4R-KO/WD. Statistical analyses were performed using one-way ANOVA (a,b,d and g) or Kruskal‐Wallis test (e) followed by Bonferroni or Dunn post hoc test, respectively; MC4R-KO/WD and MC4R-KO/WD/CANA was pre-selected as a subset of means or medians to compare. n = 15.
Figure 3
Figure 3
CANA reduces inflammation and fibrosis in adipose tissue of WD-fed MC4R-KO mice. (a) F4/80 immunohistochemical analysis of epididymal fat. (b) Adipocyte area in epididymal fat. (c) Quantification of the number of crown-like structure (CLS) in epididymal fat. (d) Expression levels of inflammation-related genes in epididymal fat. (e) Sirius red staining of epididymal fat and (f) quantification. (g) Expression levels of collagen genes in epididymal fat. Original magnification, ×200. Scale bars, 100 μm. *p < 0.05, **p < 0.01 vs MC4R-KO/WD. Statistical analyses were performed using Kruskal‐Wallis test (b and f) or one-way ANOVA (c,d and g) followed by Dunn or Bonferroni post hoc test, respectively; MC4R-KO/WD and MC4R-KO/WD/CANA was pre-selected as a subset of means or medians to compare. n = 15.
Figure 4
Figure 4
CANA increases GSH content in epididymal fat of WD-fed MC4R-KO mice. (a) The pathways enriched among the upregulated (>2.0-fold) metabolites in the epididymal fat of MC4R-KO mice treated with CANA for 8 weeks compared to those without treatment. The results are expressed as −log (p value). Metabolite concentrations of (b) GSH and GSSG, and (c) GSSG/GSH ratio of the epididymal fat. Data are mean ± SEM, *p < 0.05, **p < 0.01 vs MC4R-KO/WD; Student’s t test. n = 7. (d) Expression levels of NADPH oxidase complex genes in differentiated 3T3-L1 adipocytes treated with 200 µM H2O2 for 18 h after pretreatment with or without 1 mM GSH for 1 h. (e) Expression levels of inflammation-related genes in RAW 264.7 cells treated with 200 µM H2O2 for 18 h after pretreatment with or without 1 mM GSH for 1 h. *p < 0.05, **p < 0.01 vs H2O2. Statistical analyses were performed using Mann-Whitney (b), non-paired Student’s t (c), or one-way ANOVA (d and e) followed by Bonferroni post hoc test; H2O2 and H2O2 + GSH was pre-selected as a subset of means to compare. n = 4.
Figure 5
Figure 5
CANA attenuates the development to hepatocellular carcinoma in WD-fed MC4R-KO mice. The changes in (a) blood glucose levels and (b) body weight during CANA treatment for 52 weeks. n = 8–9. (c) Representative images of livers. Arrows indicate tumors. (d) Tumor numbers and maximum size. (e) Triglyceride content of the liver tissues from non-tumor sites. (f) Sirius red staining of the liver sections and (g) quantification. (h) Serum ALT levels. (i) Expression levels of Myc and Afp genes in the liver tissues from non-tumor (NT) or tumor (T) sites. Original magnification, ×100. Scale bars, 100 μm. *p < 0.05, **p < 0.01 vs MC4R-KO/WD. Statistical analyses were performed using non-paired Student’s t (a,d,e,h and i) or Mann-Whitney (g) test. n = 7–8.

References

    1. Rinella ME. Nonalcoholic fatty liver disease: a systematic review. JAMA. 2015;313:2263–2273. doi: 10.1001/jama.2015.5370. - DOI - PubMed
    1. Brunt EM, et al. Nonalcoholic fatty liver disease. Nat Rev Dis Primers. 2015;1:15080. doi: 10.1038/nrdp.2015.80. - DOI - PubMed
    1. Neuschwander-Tetri BA, Caldwell SH. Nonalcoholic steatohepatitis: summary of an AASLD Single Topic Conference. Hepatology. 2003;37:1202–1219. doi: 10.1053/jhep.2003.50193. - DOI - PubMed
    1. Dunn W, Schwimmer JB. The obesity epidemic and nonalcoholic fatty liver disease in children. Curr Gastroenterol Rep. 2008;10:67–72. doi: 10.1007/s11894-008-0011-1. - DOI - PubMed
    1. Matteoni CA, et al. Nonalcoholic fatty liver disease: a spectrum of clinical and pathological severity. Gastroenterology. 1999;116:1413–1419. doi: 10.1016/S0016-5085(99)70506-8. - DOI - PubMed

Publication types

MeSH terms

Substances