. 2018 Feb 5;8(1):2391.
doi: 10.1038/s41598-018-19736-w.

Statistical Approach for Gene Set Analysis with Trait Specific Quantitative Trait Loci

Affiliations

Statistical Approach for Gene Set Analysis with Trait Specific Quantitative Trait Loci

Samarendra Das et al. Sci Rep. .

Abstract

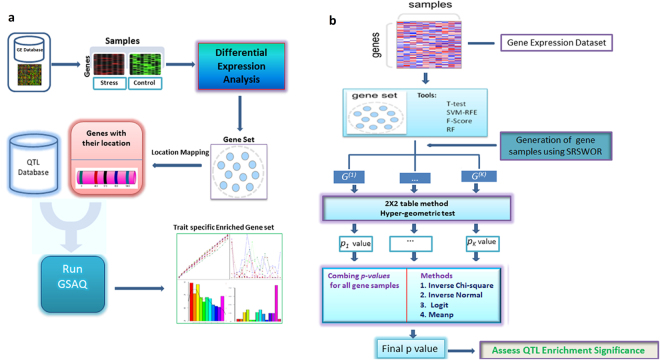
The analysis of gene sets is usually carried out based on gene ontology terms and known biological pathways. These approaches may not establish any formal relation between genotype and trait specific phenotype. In plant biology and breeding, analysis of gene sets with trait specific Quantitative Trait Loci (QTL) data are considered as great source for biological knowledge discovery. Therefore, we proposed an innovative statistical approach called Gene Set Analysis with QTLs (GSAQ) for interpreting gene expression data in context of gene sets with traits. The utility of GSAQ was studied on five different complex abiotic and biotic stress scenarios in rice, which yields specific trait/stress enriched gene sets. Further, the GSAQ approach was more innovative and effective in performing gene set analysis with underlying QTLs and identifying QTL candidate genes than the existing approach. The GSAQ approach also provided two potential biological relevant criteria for performance analysis of gene selection methods. Based on this proposed approach, an R package, i.e., GSAQ ( https://cran.r-project.org/web/packages/GSAQ ) has been developed. The GSAQ approach provides a valuable platform for integrating the gene expression data with genetically rich QTL data.


Conflict of interest statement

The authors declare that they have no competing interests.

Figures

Figure 1
Figure 1
Operational procedure and algorithm of GSAQ approach. (a) Operational procedures involved in GSAQ are shown in pictorial form. GE reperesents Gene Expression (b) Flowchart of the computational algorithm implemented in GSAQ approach. G(k)’s represents random gene samples and pk-values represent corresponding statistical significance for each G(k). SRSWOR represents simple random sampling without replacement.
Figure 2
Figure 2
Distribution of NQhits statistic over the selected gene sets. The horizontal axis represents the gene sets obtained by each of the ten gene selection methods. The vertical axis represents NQhits statistic obtained through GSAQ approach. Distribution of NQhits are shown for (a) salinity, (b) cold, (c) drought, (d) fungal and, (e) insect stresses in rice.
Figure 3
Figure 3
Performance analysis of GSAQ approach with GSVQ for abiotic stresses. The horizontal axis represents the gene sets obtained by each of the ten gene selection methods. The vertical axis shows the negative logarithm of statistical significance values computed from existing GSVQ approach for (a) salinity, (b) drought, (c) cold stresses and proposed GSAQ approach (with Inverse normal method) for (a1) salinity, (b1) drought, (c1) cold stresses.
Figure 4
Figure 4
Performance analysis of GSAQ approach with GSVQ for biotic stresses. The horizontal axis represents the gene sets obtained by each of the ten gene selection methods. The vertical axis shows the negative logarithm of statistical significance values computed from existing GSVQ approach for (a) fungal, (b) insect stresses and proposed GSAQ approach (with Inverse normal method) for (a1) fungal, (b1) insect stresses in rice.

Similar articles

Cited by

References

    1. Marx V. Biology: The big challenges of big data. Nature. 2013;498:255–260. doi: 10.1038/498255a. - DOI - PubMed
    1. Das S, Meher PK, Rai A, Bhar LM, Mandal BN. Statistical approaches for gene selection, hub gene identification and module interaction in gene co-expression network analysis: An application to Aluminum stress in Soybean (Glycine max L.) PLoS One. 2017;12(1):e0169605. doi: 10.1371/journal.pone.0169605. - DOI - PMC - PubMed
    1. Liang Y, et al. Prediction of drought-resistant genes in Arabidopsis thaliana using SVM-RFE. PLoS One. 2011;6(7):e21750. doi: 10.1371/journal.pone.0021750. - DOI - PMC - PubMed
    1. Saeys Y, Inza I, Larrañaga P. A review of feature selection techniques in bioinformatics. Bioinformatics. 2007;23(19):2507–2517. doi: 10.1093/bioinformatics/btm344. - DOI - PubMed
    1. Wang J, et al. A Computational systems biology study for understanding salt tolerance mechanism in Rice. PLoS One. 2013;8(6):e64929. doi: 10.1371/journal.pone.0064929. - DOI - PMC - PubMed

Publication types

LinkOut - more resources