. 2018 Feb 5;9(1):501.
doi: 10.1038/s41467-018-02864-2.

Steric exclusion and protein conformation determine the localization of plasma membrane transporters

Affiliations

Steric exclusion and protein conformation determine the localization of plasma membrane transporters

Frans Bianchi et al. Nat Commun. .

Abstract

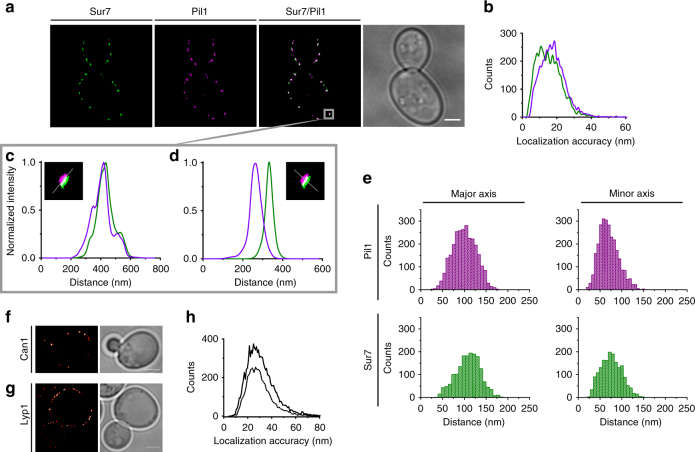
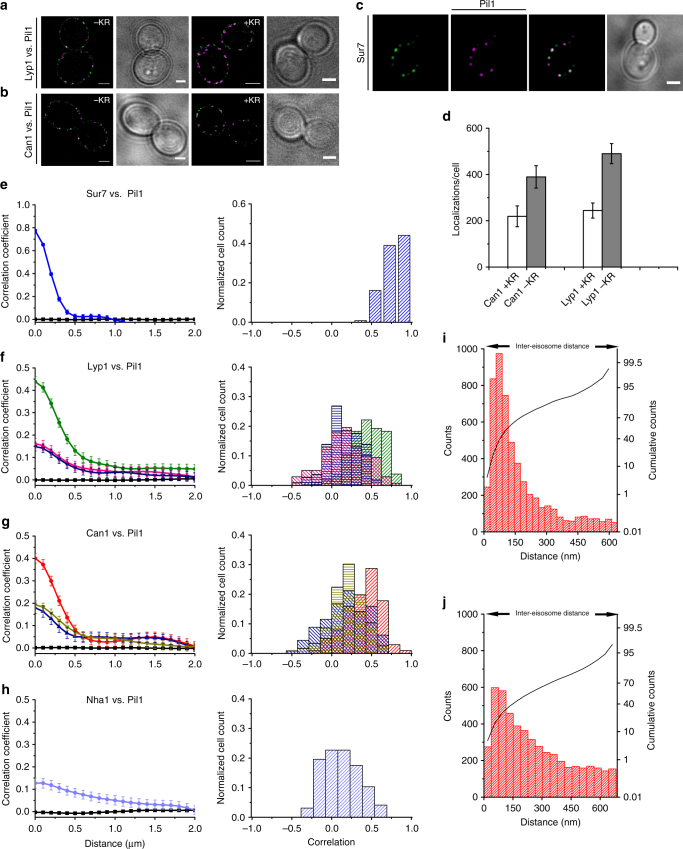
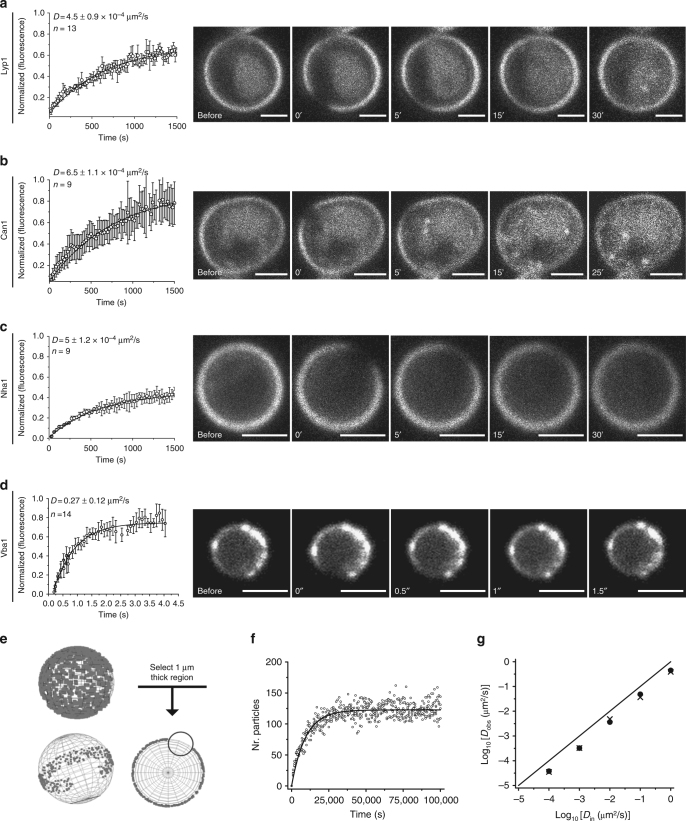
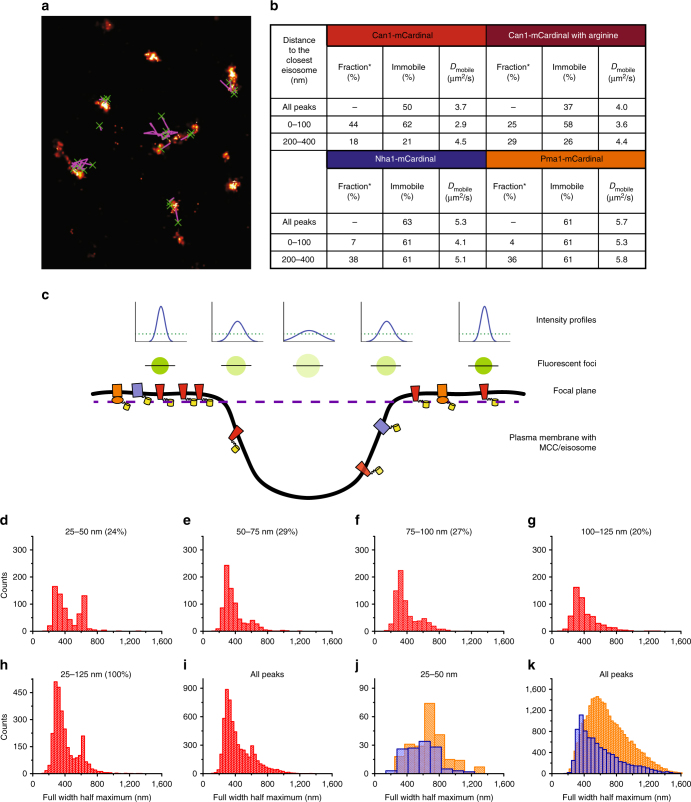
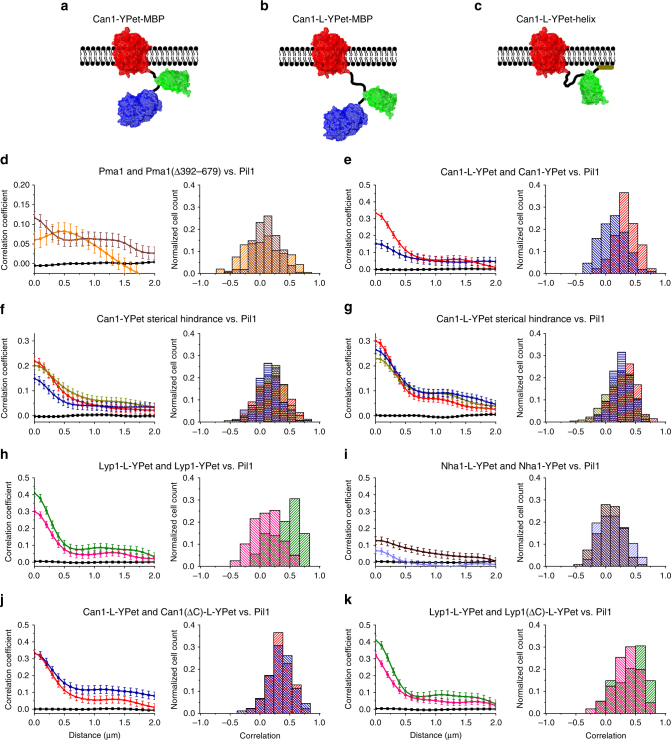
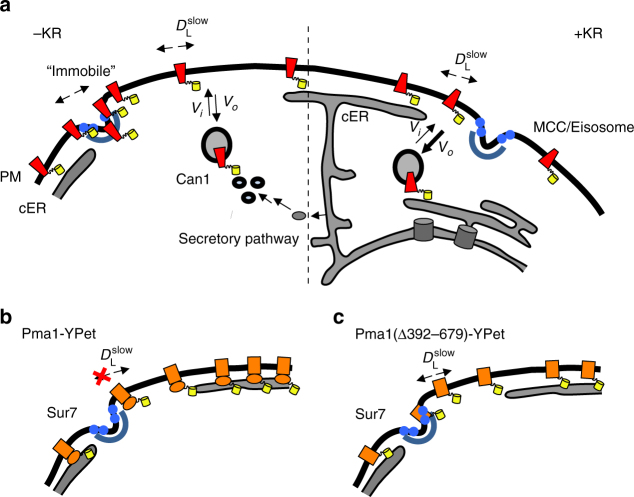
The plasma membrane (PM) of Saccharomyces cerevisiae contains membrane compartments, MCC/eisosomes and MCPs, named after the protein residents Can1 and Pma1, respectively. Using high-resolution fluorescence microscopy techniques we show that Can1 and the homologous transporter Lyp1 are able to diffuse into the MCC/eisosomes, where a limited number of proteins are conditionally trapped at the (outer) edge of the compartment. Upon addition of substrate, the immobilized proteins diffuse away from the MCC/eisosomes, presumably after taking a different conformation in the substrate-bound state. Our data indicate that the mobile fraction of all integral plasma membrane proteins tested shows extremely slow Brownian diffusion through most of the PM. We also show that proteins with large cytoplasmic domains, such as Pma1 and synthetic chimera of Can1 and Lyp1, are excluded from the MCC/eisosomes. We hypothesize that the distinct localization patterns found for these integral membrane proteins in S. cerevisiae arises from a combination of slow lateral diffusion, steric exclusion, and conditional trapping in membrane compartments.


Conflict of interest statement

The authors declare no competing financial interests.

Figures

Fig. 1
Fig. 1
High-resolution plasma membrane protein localization. a Dual-color super-resolution reconstructions of Sur7-YPet in green and Pil1-mKate2 in magenta. Co-localizations appear in white. b The localization accuracy of the fluorophores YPet (green) and mKate2 (magenta) were estimated from the fitting error. c, d Eisosome line scans measured along (c) and perpendicular (d) to the plasma membrane. e Histograms of the distribution of the size of eisosomes on the basis of localizations of Pil1 or Sur7 (n = 302). Single-color super-resolution reconstructions of f Can1-mEos3.1 and g Lyp1-mEos3.1 with h their respective fitting errors (drawn line, Lyp1; dotted line, Can1). All proteins were chromosomally tagged with the respective fluorophores. Scale bar represents 2 µm; n represents the number of cells analyzed
Fig. 2
Fig. 2
Substrate-dependent localization of proteins. Dual-color reconstructions of a Lyp1-L-YPet/Pil1-mKate2 and b Can1-L-YPet/Pil-mKate2 with and without lysine plus arginine in the growth medium, indicated as +KR and −KR, respectively. Wide-field images are depicted for clarity. All the scale bars represent 2 µm. c Cross-correlation of Pil1-mKate2 and Sur7-YPet. Panels: images were treated with a discoidal-averaging filter to better illustrate the localizations; the co-localization analysis was done with the raw diffraction-limited images. Wide-field images are depicted for clarity. d Number of localizations per cell of Lyp1 and Can1 with and without lysine plus arginine with error bars representing the standard deviation. eh show cross-correlation of Pil1-mKate2 vs. proteins tagged with L-YPet; the left graph of each panel shows the correlation coefficients over distance for the various proteins with error bars representing standard error of the mean; the right graph of each panel shows the histograms of the probability distributions of single-cell cross-correlations. e Sur7 (blue; n = 118); f Lyp1 before addition of lysine plus arginine (green; n = 104), 40 min after the addition of lysine plus arginine (magenta; n = 138), and 120 min after the addition (blue; n = 108); g Can1 before addition of lysine plus arginine (red; n = 101), 40 min after the addition of lysine plus arginine (blue; n = 113) and 120 min after the addition (tan; n = 116); h Nha1 (light blue; n = 69). i, j Histograms showing the distance of Can1 molecules to the closest eisosome. Black lines indicate probability of finding an eisosomes at a discrete distance. i Can1 without arginine (n = 35); j Can1 with arginine (n = 47); n represents number of cells analyzed
Fig. 3
Fig. 3
FRAP measurements to probe long-range diffusion. Normalized fluorescence recovery of YPet-tagged transporters expressed from a plasmid in the respective endogenous knockout strain: Lyp1-YPet (immobile fraction: 0.35) (a), Can1-YPet (immobile fraction: 0.15; n = 9) (b), Nha1-YPet (immobile fraction: 0.55; n = 9) (c), and Vba1-YPet (immobile fraction: 0.10; n = 14) (d). Confocal images of cells before and after photobleaching at different time points are shown in the right panels. Scale bars represent 2 µm; standard deviations and number of cells analyzed (n) are given in the graphs. e Spherical cell model used for simulation of Brownian diffusion as observed in a FRAP experiment. Photo-bleached region of 2 µm width and 1 µm thick. f Recovery of the particles in the bleached region (empty dots) and exponential fitting of the data (black line) are shown. g Comparison of input with observed diffusion coefficients for FRAP simulations. Every point indicates a separate simulation. The width and height of the bleached region are 2 and 2 µm, respectively. The black line represents the function x=y. All proteins were under overexpressed conditions; n represents the number of cells and error bars represent the standard deviation
Fig. 4
Fig. 4
Lateral diffusion and distance dependence of membrane proteins relative to MCC/eisosomes. a Reconstruction of the trajectories: bright areas correspond to eisosomes, green Xs mark starting point of Can1 trajectory and purple lines show the trajectories. b Table summarizing diffusive behavior of Can1 (with arginine (n = 47) and without arginine (n = 35) in the medium), Nha1 (n = 52), and Pma1 (n = 129). *refers to fraction of peaks localized in the inter-eisosomal distance. c Cartoon showing the location of Can1 (red), Nha1 (light blue), and Pma1 (orange) relative to a MCC/eisosome and the intensity profiles of the fluorescent foci. The further away from the focal plane, the wider and dimmer the signal, which is seen in the intensity profiles of the peaks (green dotted lines indicate detection limit). Measuring the full width at half maximum (FWHM) of the peaks gives information about focal depth and thus the position of proteins in the MCC/eisosome; the extra peak at FWHM of 650 nm in panel d indicates that Can1 enters the MCC/eisosome in the z-direction. The panels dj show the histograms of FWHM of Can1 of peaks detected at 25–50 nm (d), 50–75 nm (e), 75–100 nm (f), 100–125 nm (g), or 25–125 nm (h) from the centroid of the nearest MCC/eisosome; the percentages indicate the fraction of proteins at a given distance. The intensity profiles at 0–25 nm were too low to assign them confidently to Can1; the histogram of all Can1 peaks is shown in panel i. The panels j and k show the histograms of FWHM of Pma1 (orange) and Nha1 (light blue) at 25–50 nm from the centroid of the nearest MCC/eisosome (j) and of all the peaks (k); n represents number of cells analyzed
Fig. 5
Fig. 5
Steric occlusion from MCC/eisosomes. Schematic of transporter constructs (ac) to investigate the possible hindrance for MCC/eisosome entry by engineering cytoplasmic domains onto Can1. Maltose-binding protein (MalE) (blue) attached to c Can1-YPet and d Can-L-YPet, and e Can1-L-YPet tethered to the membrane via an amphipathic α-helix and lipid moiety; the helix corresponds to the C-terminal 51 amino acids of Gap1; L is linker as described in the methods section. Cross-correlation analysis of BY4742 cells expressing Pil1-mKate2 together with d Pma1-YPet (orange; n = 201) or Pma1(∆392–679)-YPet (brown; n = 169); the Pma1 constructs were expressed from a single copy plasmid under the control of the Pma1 promoter. Cross-correlation of chromosomally labeled Pil1-mKate2 vs. chromosomally YPet-tagged target protein: e Can1-L-YPet (red; n = 93) and Can1-YPet (blue; n = 92). f Can1-YPet (red; n = 165), Can1-YPet-MBP (blue; n = 147), Can1-YPet-Gap1C (tan; n = 172); g Can1-L-YPet (red; n = 202), Can1-L-YPet-MBP (blue; n = 152), Can1-L-YPet-Gap1C (tan; n = 226); h Lyp1-L-YPet (green; n = 108) and Lyp1-YPet (magenta; n = 119); i Nha1-L-YPet (light blue; n = 69) and Nha1-YPet (pink; n = 122); j Can1-L-YPet (red; n = 93) and Can1(∆C)-L-YPet (blue; n = 88); k Lyp1-L-YPet (green; n = 108) and Lyp1(∆C)-L-YPet (magenta; n = 146). The left graph of each panel shows the correlation coefficients over distance for the various proteins with error bars representing standard error of the mean; the right graph of each panel shows the histograms of the probability distributions of single-cell cross-correlations; n represents number of cells analyzed
Fig. 6
Fig. 6
Cartoon summarizing the main findings on diffusion and localization of plasma membrane proteins. a The plasma membrane (PM), cortical ER (cER) and two MCC/eisosomes (Sur7 in the membrane and Pil1 scaffold) are shown. The scaffolding of the MCCs is shown as blue half circle (Pil1); the blue small circles depict Sur7. DL, Vi and Vo refer to lateral diffusion and the rate of exo- and endocytosis, respectively. Left: in the absence of substrate (−KR): a fraction of Can1 (red) accumulates in (near) the MCC/eisosomes and has an apparent DL < 10−5 μm2/s, here indicated as “immobile”. The yellow cylinder depicts the fluorescent proteins fused to the transporters. The total concentration of Can1 is stable as delivery to (Vi) and removal from (Vo) the membrane are similar. Right: in the presence of substrate (+KR): Can1 takes a different conformation and dissociates from the MCC/eisosome and diffuses out. Next, Can1 is ubiquitinated and rapidly removed from the membrane (Vo > Vi; indicated by thickness of arrow). b Large cytosolic domains exclude proteins from entering MCC/eisosomes, as shown for Pma1-YPet; c removal of the cytoplasmic domain enables (Pma1(∆392-679)-YPet) to enter the MCC/eisosome

References

    1. Van Meer G, Voelker DR, Feigenson GW. Membrane lipids: where they are and how they behave. Nat. Rev. Mol. Cell Biol. 2008;9:112–124. doi: 10.1038/nrm2330. - DOI - PMC - PubMed
    1. Kusumi A, Ike H, Nakada C, Murase K, Fujiwara T. Single-molecule tracking of membrane molecules: plasma membrane compartmentalization and dynamic assembly of raft-philic signaling molecules. Semin. Immunol. 2005;17:3–21. doi: 10.1016/j.smim.2004.09.004. - DOI - PubMed
    1. Fujiwara TK, et al. Confined diffusion of transmembrane proteins and lipids induced by the same actin meshwork lining the plasma membrane. Mol. Biol. Cell. 2016;27:1101–1119. doi: 10.1091/mbc.E15-04-0186. - DOI - PMC - PubMed
    1. Malinska K, Malinsky J, Opekarová M, Tanner W. Visualization of protein compartmentation within the plasma membrane of living yeast cells. Mol. Biol. Cell. 2003;14:4427–4436. doi: 10.1091/mbc.E03-04-0221. - DOI - PMC - PubMed
    1. Walther TC, et al. Eisosomes mark static sites of endocytosis. Nat. Cell Biol. 2006;439:998–1003. doi: 10.1038/nature04472. - DOI - PubMed

Publication types

MeSH terms

Substances