. 2018 Feb 5;8(1):2352.
doi: 10.1038/s41598-018-20908-x.

Epidemic spreading in modular time-varying networks

Affiliations

Epidemic spreading in modular time-varying networks

Matthieu Nadini et al. Sci Rep. .

Abstract

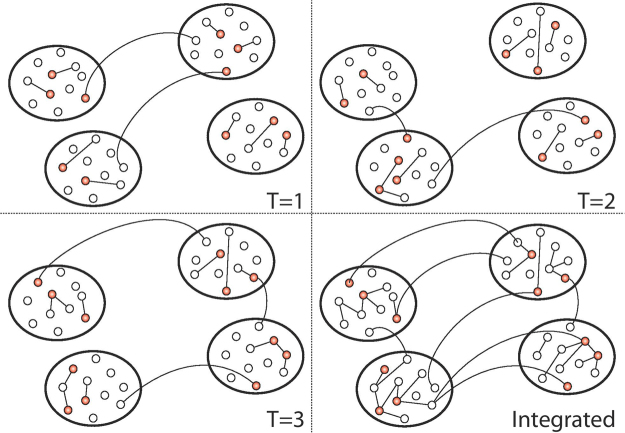
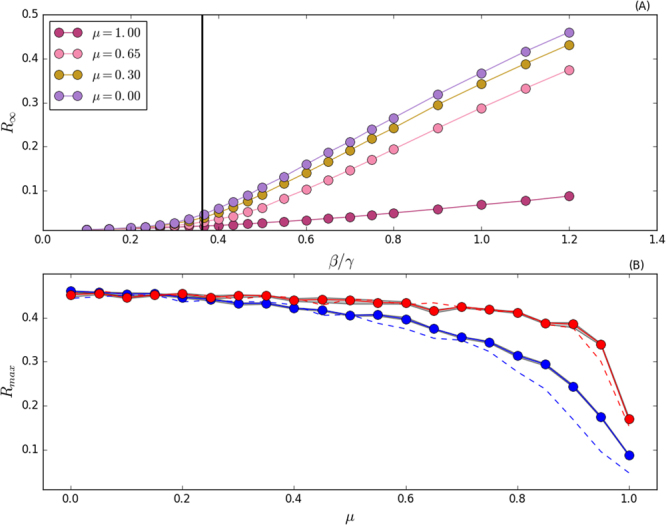
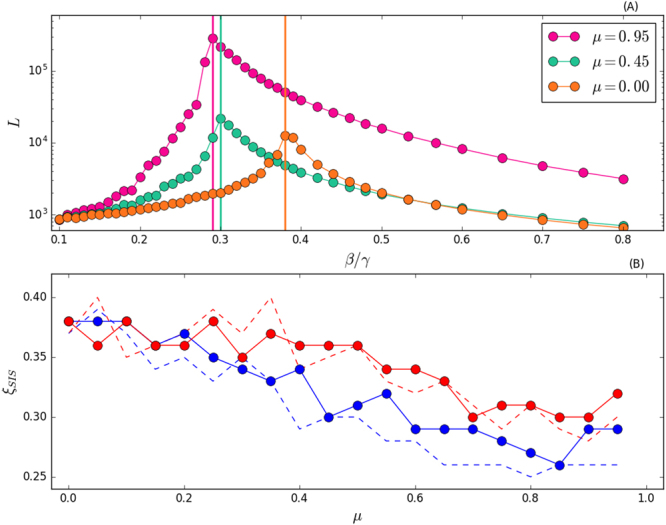
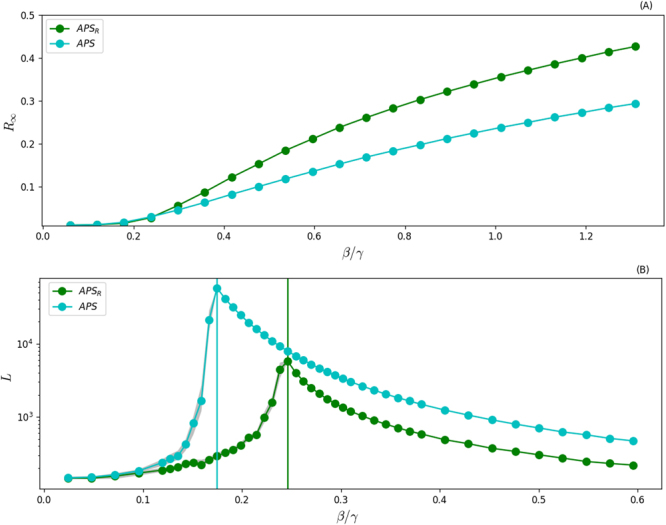
We investigate the effects of modular and temporal connectivity patterns on epidemic spreading. To this end, we introduce and analytically characterise a model of time-varying networks with tunable modularity. Within this framework, we study the epidemic size of Susceptible-Infected-Recovered, SIR, models and the epidemic threshold of Susceptible-Infected-Susceptible, SIS, models. Interestingly, we find that while the presence of tightly connected clusters inhibits SIR processes, it speeds up SIS phenomena. In this case, we observe that modular structures induce a reduction of the threshold with respect to time-varying networks without communities. We confirm the theoretical results by means of extensive numerical simulations both on synthetic graphs as well as on a real modular and temporal network.


Conflict of interest statement

The authors declare that they have no competing interests.

Figures

Figure 1
Figure 1
Schematic representation of the model. In red, we show active nodes. Straight lines and arcs describe links connecting nodes in the same or in different communities respectively. In the bottom right panel we show the integrated network obtained as the union of G1, G2, G3.
Figure 2
Figure 2
Time evolution of the average total degree, 〈k(a, s, t)〉, for different activity classes and compared with the theoretical function of Eq. 3a,b,c and, evaluated considering a community size equal to the average (i.e. s = 〈s〉). The rescaled time is ta˜t and k(a˜t) is plotted. Parameters used are: N = 105, ω = 2.1, ν = 2.1, smin = 10, μ = 0.9 and T = 105 evolution steps. Each point is an average of 102 simulations.
Figure 3
Figure 3
Plot of the three degree distributions and the theoretical prediction, given in Eq. 4. Parameters used are: N = 105, ω = 2.1, ν = 2.1, smin = 10, μ = 0.9 and T = 105 evolution steps.
Figure 4
Figure 4
Panel (A) R as a function of β/γ, for selected values of μ and smin = 10. Vertical black line represents the theoretical value of the epidemic threshold for μ = 0 as derived in refs,. Panel (B) Rmax, i.e. the max value of R, as a function of μ. In red curves we set smin = 100, in blue curves smin = 10. In solid curves, we draw community sizes directly from the community size distribution P(s). In dashed curves, we fix the community sizes as equal to the average value of P(s) for all communities. The 95% confidence interval is in grey. Each point is an average of 102 independent simulations.
Figure 5
Figure 5
Panel (A) Lifetime of the disease L as a function of β/γ, for selected values of μ and when smin = 10. Vertical lines are the epidemic threshold. Panel (B) Ratio ξSIS = β/γ in correspondence of Lmax, as a function of μ. In red curves we set smin = 100, blue curves smin = 10. Each point is an average of 102 independent simulations. Note that we avoid to simulate μ = 1 because the criterion we follow for the estimation of the threshold does not hold for a network with many connected components.
Figure 6
Figure 6
Panel (A) R as a function of β/γ for SIR processes diffusing on APS (cyan circles) and on the randomized APS dataset (green circles). Panel (B) L as a function of β/γ for a SIS models evolving on the same two networks. Each point is the average of 102 independent simulations started from 1% of random seeds. We fix γ = 0.05.

References

    1. Barabási, A.-L. The network takeover. Nat. Phys. 8 (2012).
    1. Butts C. Revisiting the foundations of network analysis. Science. 2009;325:414–416. doi: 10.1126/science.1171022. - DOI - PubMed
    1. Newman, M. Networks. An Introduction (Oxford University Press, 2010).
    1. Caldarelli, G. Scale-Free Networks (Oxford University Press, 2007).
    1. Barrat, A., Barthélemy, M. & Vespignani, A. Dynamical processes on complex networks (Cambridge, 2008).

Publication types

LinkOut - more resources