. 2018 Mar;21(3):341-352.
doi: 10.1038/s41593-018-0075-7. Epub 2018 Feb 5.

Striatal neurons directly converted from Huntington's disease patient fibroblasts recapitulate age-associated disease phenotypes

Affiliations

Striatal neurons directly converted from Huntington's disease patient fibroblasts recapitulate age-associated disease phenotypes

Matheus B Victor et al. Nat Neurosci. 2018 Mar.

Erratum in

Abstract

In Huntington's disease (HD), expansion of CAG codons in the huntingtin gene (HTT) leads to the aberrant formation of protein aggregates and the differential degeneration of striatal medium spiny neurons (MSNs). Modeling HD using patient-specific MSNs has been challenging, as neurons differentiated from induced pluripotent stem cells are free of aggregates and lack an overt cell death phenotype. Here we generated MSNs from HD patient fibroblasts through microRNA-based direct neuronal conversion, bypassing the induction of pluripotency and retaining age signatures of the original fibroblasts. We found that patient MSNs consistently exhibited mutant HTT (mHTT) aggregates, mHTT-dependent DNA damage, mitochondrial dysfunction and spontaneous degeneration in culture over time. We further provide evidence that erasure of age stored in starting fibroblasts or neuronal conversion of presymptomatic HD patient fibroblasts results in differential manifestation of cellular phenotypes associated with HD, highlighting the importance of age in modeling late-onset neurological disorders.


Conflict of interest statement

Competing financial interests

The authors declare no competing financial interests.

Figures

Figure 1
Figure 1
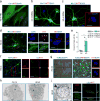
HD patient fibroblasts can be directly reprogrammed into MSNs. Fibroblasts from three HD patients (with mHTT expansions of 40, 43 and 44 CAGs) and their respective age- and sex-matched controls (CAG sizes of 19, 17 and 18) reprogrammed into MSNs with miR-9/9*-124+CDM. (a), Reprogrammed HD.40 at post-induction day (PID) 30 immunostained with TUBB3, and HD.44 with TUBB3, NeuN, MAP2, DARPP-32 and GABA. (b), Images of all three pairs of cell lines immunostained with GABA and DARPP-32. (c), Quantification of TUBB3, GABA and DARPP-32-positive cells at PID 30; n=averages of 1,000 cells from 3 independent HD and control lines. Unpaired t-test corrected for multiple comparisons using the Holm-Sidak method; (from left, P=0.98, 0.97, 0.98; df=4) n.s.=not significant. Scale bar: 50 μm. Mean ± s.e.m.
Figure 2
Figure 2
Electrophysiological analysis of HD and control MSNs. pSynapsin-tRFP labeled reprogrammed cells were plated onto primary rat glial cultures and cultured for 28 days. (HD: HD.47, Ctrl: Ctrl.16) (a), Representative traces from Ctrl-MSNs in gray (b) and traces from HD-MSNs in blue. (a-b) Voltage-clamp recordings of evoked action potentials (APs) and inset with progressive current-injection steps; Current-clamp recordings of inward and outward currents and inset of sodium currents; Spontaneous firing of APs; Ramp protocol to determine AP threshold. (c), All properties measured were quantified and found to not differ significantly. Two-tailed student’s t-test; (from left, top row: P =0.19 df=23, P =0.61 df=23, P =0.75 df=18, P=0.18 df=19; from left, bottom row: P=0.48 df=17, P=0.72 df=19, P=0.15 df=19, P=0.28 df=4) (d) Venn diagram of recorded cells showing increased firing complexity in HD-MSNs. All reprogrammed cells in both groups fired APs (n= 10 HD-MSNs and 12 Ctrl-MSNs). n.s.=not significant. Mean ± s.d.
Figure 3
Figure 3
HD-MSNs properly acquire striatal cell fate identity and display differentially expressed genes (DEGs). Analysis of fibroblast- and MSN-specific genes at PID 32 in HD.40 and HD.43 reprogrammed MSNs, Ctrl-MSNs and respective fibroblasts, as well as additional analysis of a set of 7 HD- and 5 Ctrl-MSN lines by RNA-seq. (a), Heat map representation of average expression values at PID 32 for 25 fibroblast-enriched genes and 48 MSN-enriched genes including CDM factors (n=2 biological replicates per sample of 2 HD- and Ctrl-MSNs and their corresponding fibroblasts). (b), Principal component analysis of gene expression data for 12 independent samples analyzed at PID 32 (n=2 technical replicates for each of 5 Ctrl- and 7 HD-MSN samples). (c), Pairwise comparison of HD-MSNs and Ctrl-MSNs shows many distinct genes differentially expressed in HD-MSNs (FDR <0.01, log fold-change (logFC) >0.5, EdgeR). Mapped reads are displayed in log2 counts per million (CPM) and fold-change in HD-MSN expression is displayed in gray-blue color gradient, with upregulated genes shown in gray and downregulated genes in blue (n=averages of 2 technical replicates for 5 Ctrl- and 7 HD-MSN samples). (d), Gene ontology (GO) analysis of DEGs with MetaCore reveals many critical cellular processes, including a significant enrichment of genes associated with HD. Further GO analysis of these HD-related genes points to dysfunction in neurophysiological processes (n= 1,127 DEGs from (c) based on the analysis of 5 Ctrl- and 7 HD-MSN samples).
Figure 4
Figure 4
Mutant HTT aggregates in HD-MSNs. (a-c), HTT aggregation is not present in HD-fibroblasts or Ctrl-MSNs but is detectable in HD-MSNs. Analysis at PID 30 by EM48 antibody. These experiments were repeated independently over 3 times with similar results. (d), HD-MSNs contain both cytoplasmic (arrowheads) and intranuclear inclusions (arrows), as detected by EM48 antibody at PID 30. (e), Quantification of percentage of Ctrl- and HD-MSNs displaying inclusion bodies (IBs) by MW8 antibody at PID 30; (mean ± s.e.m.; *P=0.019 by two-tailed student’s t-test; t=3.787, df=4; n= averages of 400 cells from 3 independent HD patients and controls). (f), Co-localization of EM48 (red) with Ubiquitin (green). Experiment has been repeated independently once (g-h), HD-MSNs on μ-dishes immunolabeled with HTT by MW8 conjugated to fluoronanogold reveal intranuclear inclusions by transmission electron microscopy (TEM). (i), Ultrastructural analysis also detected mutant HTT inside double-membrane vesicles (arrowheads) resembling autophagosomes. Immunostaining with the autophagosome marker LC3-II confirmed colocalization with HTT (MW8) at PID 30. Experiment was repeated with 3 additional pairs of HD- and Ctrl-MSNs, and was performed independently twice. Scale bars: 10 μm, except for TEM panel of (i) which is 100nm.
Figure 5
Figure 5
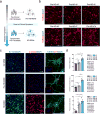
Proteostasis collapses in directly reprogrammed MSNs but is relatively unaffected in cells derived from iPSCs. (a), Schematic of deriving HD-MSNs from adult fibroblasts (HD-FB) versus embryonic fibroblasts (HD-HEFs). heMSNs: MSNs reprogrammed from HEFs. OSKM: Oct3/4, Sox2, Klf4, c-Myc. (b), Vimentin (VIM)- and fibronectin (FN)-positive HD.40-HEFs and HD.40-FB. (c), HD.50-MSNs and HD.50-heMSNs analyzed for neuronal and MSN markers, and mutant HTT aggregates (MW8). Experiment has been repeated with one additional line and independently 3 times. (d), Quantification of inclusion bodies (IBs) (n=average of 400 cells from 3 biological replicates; One-Way ANOVA [F(2,6)=18.67, P=0.0027] with post hoc Tukey’s test [from left, **P=0.0039 and 0.0051; n.s. P= 0.95]). Scale bar in (b), 100 μm; and in (c), 10 μm. (e), Live imaging in HD.40-FB and HD.40-HEFs expressing 23 or 74 polyglutamine (Q) repeats fused to GFP; scale bar: 50 μm. Arrowheads mark IBs. Experiment has been repeated independently 3 times. (f), Quantification of IBs post-transfection (n= average of 30 cells in each group for 3 independent experiments; One-Way ANOVA [F(5,12)=228.7, P=1.8E-11] with post hoc Tukey’s test [from left, ***P=2.3E-8, 2.7E-7, 3.2E-10 and 5.2E-10; n.s. P=0.129 and 0.99]). (g), Treatment of HEFs with 5μM of lactacystin induces IBs (n=average of 30 cells from 3 independent experiments; two-tailed student’s t-test; P=7.2E-5 df=4). (h-i), 20s proteasome activity measured by cleavage of fluorogenic peptide LLVY-AMC for 1 hour (n=3 samples from each group; One-Way ANOVA [F(4,10)=282.3, P=3.1E-10] with post hoc Tukey’s test [from left, ***P=5.2E-7, 5.4E-7, 9.8E-8 and 6.3E-6; n.s. P=0.99]). (j), Microarray analysis of MSNs from neonatal or older healthy individuals shows reduction in ubiquitin-proteasome system gene expression with age. n.s.=not significant. Mean ± s.e.m.
Figure 6
Figure 6
DNA damage and neurodegeneration in HD-MSNs. (a-b), HD-MSNs show increased oxidative DNA damage by 8-OHdG immunostaining (One-Way ANOVA [F(3,8)=13.5, P=0.0016] with Tukey’s test [*P=0.016, n.s.=0.96]; n=averages from 70 cells from 3 independent samples per group) and (c-d), increased doubled-stranded breaks detected by 53BP1 immunostaining (One-Way ANOVA [F(3,8) =20.68, P=0.0004] with Tukey’s test [**P=0.0026, n.s.=0.85]; n= averages from 100 cells from 3 independent HD and control lines). (e-f), Comet assay detected significantly more double-stranded DNA breaks (One-Way ANOVA [F(3,8)=7.329, P=0.0111] with Tukey’s test [*P=0.030, n.s. P=0.99] in HD-MSNs; n= averages from 20 cells from 3 independent samples per group). (g), Representative images of SYTOX staining. (h), Quantification of SYTOX-positive cells over Hoescht (One-Way ANOVA [F(7,16)= 36.71, P=1E-8], with Tukey’s test [*P=0.026 and **P=0.0013, n.s. P=0.99]; n= averages of 6,000 cells from 3 independent samples per group and time point). Solid lines represent the average while each line is shown separately as a dotted line. (i), AAV-mediated shRNA knockdown of HTT at PID 14 in HD-MSNs attenuates DNA damage at PID 35; AAV non-specific (ns) shRNA used as control (8-OHdG: n= 50 cells per group. One-Way ANOVA [F(3,196)=16.46, P=1.3E-9] with Tukey’s test [from left, ***P=4.4E-7 and 4.9E-6, n.s. P=0.90 and 0.95]; 53BP1: n= averages of 100 cells per group from 3 independent experiments. One-Way ANOVA [F(3,8)= 35.1, P=5.9E-5] with Tukey’s test [from left, ***P=1.6E-4 and 3.0E-4, n.s. P=0.80 and 0.90]). (j), Representative RNA-seq tracks of SP9. Experiment was done once with 7 HD-MSN samples and 5 Controls. (k), Validation by qPCR with SP9-specific primers (two-tailed student’s t-test; *P=0.027, t=2.702, df=8; n= 5 independent HD and control lines). (l), Restoring expression of SP9 by lentiviral transduction at PID 14 rescues cell death phenotype at PID 35. Quantification of SYTOX-positive cells over Hoescht (One-Way ANOVA [F(3,8= 9.792, P= 0.0047] with Tukey’s test [from left **P=0.009 and 0.008, n.s. P=0.99]; n= averages of 1,000 cells from 3 independent samples per group). (a-f), PID 30; (i-l) PID 35; (j) PID 32. (a-l) ***P<0.001; **P<0.01; *P<0.05; n.s.= not significant. Scale bar in a, e, 100 μm; in c, 10 μm; in g, 500 μm. Mean ± s.e.m.
Figure 7
Figure 7
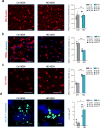
Mitochondrial and metabolic dysfunction in HD-MSNs. (a), MitoTracker Red staining shows that the total pool of mitochondria is unchanged between Ctrl- and HD-MSNs (two-tailed student’s t-test; P=0.92 t=0.1034 df=4; n= averages of 100 cells from 3 independent HD and control lines). (b), Live imaging of active mitochondria by TMRE (tetramethylrhodamine, ethyl ester) reveals significant loss of mitochondrial membrane potential in HD-MSNs (two-tailed student’s t-test; P=0.0052 t=5.54 df=4; n= averages of 60 cells from 3 independent HD and control lines). (c), Mitochondrial superoxide indicator, MitoSOX Red, shows increased superoxide production in HD-MSNs (two-tailed student’s t-test; P=0.0007 t=9.384 df=4; n= averages of 100 cells from 3 independent HD and control lines). (d), Accumulation of lipid droplets in HD-MSNs, visualized by Bodipy 493/503 dye (two-tailed student’s t-test; P=0.0318 t=3.237 df=4; n=averages of 100 cells from from 3 independent HD and control lines). ***P<0.001; **P<0.01; *P<0.05; n.s.= not significant. Scale bar a-c, 50 μm and d, 5 μm. Mean ± s.e.m.
Figure 8
Figure 8
HD-MSNs reprogrammed from pre-symptomatic patients are less vulnerable to mHTT-induced toxicity. MSNs reprogrammed from 6 pre-symptomatic HD patients with 42-49 CAG repeats collected at least 13 years prior to disease onset are phenotypically normal despite bearing similar levels of mHTT inclusions as symptomatic HD-MSNs. (a), Diagram depicting conversion of pre-clinical HD-fibroblasts by miR-9/9*-124+CDM (Pre-HD MSNs). (b), All 6 primary fibroblasts samples from pre-clinical patients tested were successfully reprogrammed by miR-9/9*-124+CDM as shown by TUBB3 staining at PID 30. This experiment was repeated independently two times. (c-d), Representative images and quantification of Ctrl-, Pre-HD and HD-MSNs at PID 35 assayed for cell death with SYTOX green (n= averages of 1,000 cells per group; One-Way ANOVA [F(2,9)=9.433, P=0.0062] with post hoc Tukey’s test [*P=0.0115 and **P=0.0084, n.s. P=0.69]), oxidative DNA damage with 8-OHdG (One-Way ANOVA [F(2,9)= 21.8, P=0.0004] with post hoc Tukey’s test [from left, ***P=0.0006 and ***P=0.0007, n.s. P=0.54]; n= averages of 100 cells per group), and mutant HTT inclusion bodies (IBs) with EM48 (n=averages of 100 cells per group; One-Way ANOVA [F(2,9)=9.911, P=0.0053] with post hoc Tukey’s test [*P=0.0138 and **P=0.0058, n.s. P=0.46]). *P<0.001; **P<0.01; *P<0.05; n.s.= not significant.; n= averages from 3 independent control lines, 6 independent pre-HD lines and 3 independent HD lines. Scale bars =100 μm, except for HTT panel (right column) where scale bar=20 μm. Mean ± s.e.m.

Comment in

References

    1. Gusella JF, et al. A polymorphic DNA marker genetically linked to Huntington’s disease. Nature. 1983;306:234–238. - PubMed
    1. A novel gene containing a trinucleotide repeat that is expanded and unstable on Huntington’s disease chromosomes. The Huntington’s Disease Collaborative Research Group. Cell. 1993;72:971–983. - PubMed
    1. Ross CA, et al. Huntington disease: natural history, biomarkers and prospects for therapeutics. Nature reviews Neurology. 2014;10:204–216. doi: 10.1038/nrneurol.2014.24. - DOI - PubMed
    1. Kremer B, et al. A worldwide study of the Huntington’s disease mutation. The sensitivity and specificity of measuring CAG repeats. N Engl J Med. 1994;330:1401–1406. doi: 10.1056/NEJM199405193302001. - DOI - PubMed
    1. Brinkman RR, Mezei MM, Theilmann J, Almqvist E, Hayden MR. The likelihood of being affected with Huntington disease by a particular age, for a specific CAG size. Am J Hum Genet. 1997;60:1202–1210. - PMC - PubMed

Publication types