. 2018 Mar;20(3):320-331.
doi: 10.1038/s41556-017-0033-8. Epub 2018 Feb 5.

The mTOR-S6K pathway links growth signalling to DNA damage response by targeting RNF168

Affiliations

The mTOR-S6K pathway links growth signalling to DNA damage response by targeting RNF168

Xiaoduo Xie et al. Nat Cell Biol. 2018 Mar.

Abstract

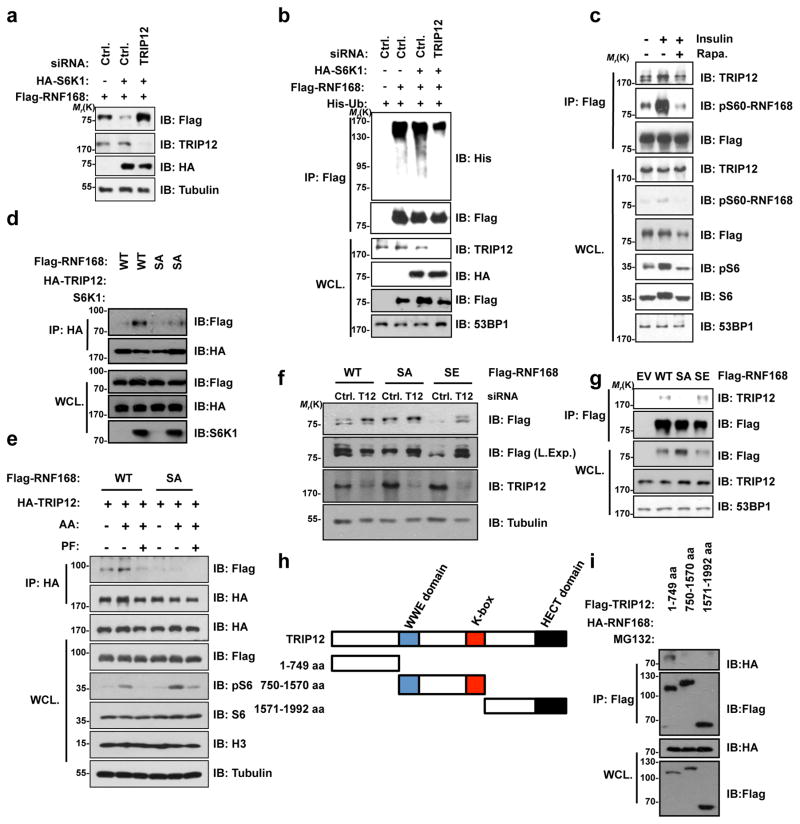
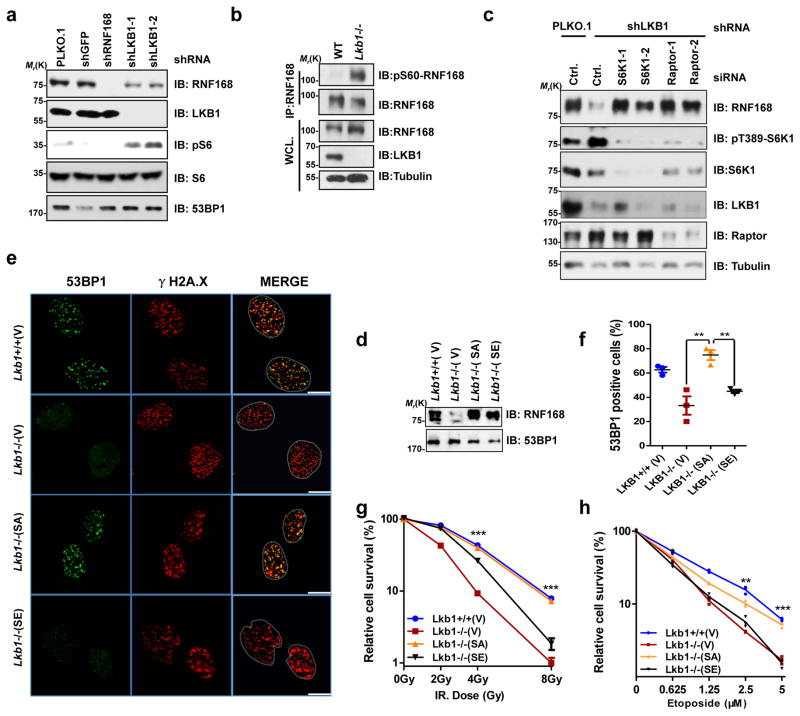
Growth signals, such as extracellular nutrients and growth factors, have substantial effects on genome integrity; however, the direct underlying link remains unclear. Here, we show that the mechanistic target of rapamycin (mTOR)-ribosomal S6 kinase (S6K) pathway, a central regulator of growth signalling, phosphorylates RNF168 at Ser60 to inhibit its E3 ligase activity, accelerate its proteolysis and impair its function in the DNA damage response, leading to accumulated unrepaired DNA and genome instability. Moreover, loss of the tumour suppressor liver kinase B1 (LKB1; also known as STK11) hyperactivates mTOR complex 1 (mTORC1)-S6K signalling and decreases RNF168 expression, resulting in defects in the DNA damage response. Expression of a phospho-deficient RNF168-S60A mutant rescues the DNA damage repair defects and suppresses tumorigenesis caused by Lkb1 loss. These results reveal an important function of mTORC1-S6K signalling in the DNA damage response and suggest a general mechanism that connects cell growth signalling to genome stability control.


Conflict of interest statement

Competing Financial Interests.

The authors declare no competing financial interests.

Figures

Figure 1
Figure 1. mTORC1-S6K signaling suppresses DNA damage response
(a) Immunoblotting (IB) of cell lysates from wild-type (WT) and S6k−/− MEF cells treated with 20 μM etoposide for 2 hours and collected at indicated time after recovery in the presence/absence of amino acids (+/−AA.). (b–c) Percentage of WT and S6k−/− MEF cells fixed at indicated time after IR (4 Gy) treatment and stained for γH2A.X (b) and 53BP1 (c) foci. The percentage of positive cells (>10 foci) among 100 cells for each sample were calculated and plotted. Results are from n=3 independent repeats. Related to Supplementary Fig. 1c. (d) WT and S6k−/− MEF cells were harvested for neutral comet assay at indicated time after IR (50 Gy) treatment. Scale bars, 5 μm. Cell numbers of NT (no treatment): WT, n=105; S6k−/−, n=98 cells. 30 min post IR: WT, n=154; S6k−/−, n=131 cells. 3h post IR: WT, n=216; S6k−/−, n=174 cells. The results were from a single experiment. (e) U2OS/DR-GFP reporter cells were transfected with indicated plasmids and the percentage of GFP positive cells were determined by FACS analysis 48 hours post transfection (n=3 independent experiments). (f) Relative cell survival of WT and S6k−/− MEF cells exposed to indicated doses of IR (n=3 independent experiments). (g–h) Representative images (g) and quantification (h) (n=3 independent experiments) of conjugated ubiquitin (Ub, FK2) foci positive WT MEF cells and S6k−/− cells 2 hours after IR (4 Gy) treatment. Scale bars, 10 μm. (i–k) Representative images (i) and quantification of FK2 (j) in WT and Lkb1−/− MEF cells. As indicated, Lkb1−/− MEF cells were pretreated with/without rapamycin (Rapa., 50 nM) for 1 hour before exposed to IR (4 Gy) treatment. Cells were fixed for immunofluorescence (IF) experiments 2 hours post IR (n=3 independent experiments). Scale bars, 10 μm. Effects of rapamycin treatment was validated with indicated antibodies (k). Unpaired student’s t test is used (ns, no significance; *0.01<p<0.05, **0.001<p<0.01 and ***p<0.001) and data were shown mean ± s.e.m. Statistics source data can be found in Supplementary Table 3. The immunoblots are representative of three independent experiments. Unprocessed original scans of blots are shown in Supplementary Fig. 8.
Figure 2
Figure 2. S6K phosphorylates RNF168 at Ser60
(a) A schematic structure of RNF168 and the position of Ser60 phosphorylation site (top). Ser60 site is conserved in many animal species and matches the consensus motif of AGC kinases (bottom). (b) IB analysis of whole cell lysates (WCL) and Flag-immunoprecipitation (IP) from 293T cells transfected with Flag-RNF168 WT or SA constructs. 20 nM rapamycin (Rapa.) or DMSO were added 12 hours before cell harvest. (c) IB analysis of WCL and Flag-IP with indicated antibodies from 293T cells transfected with indicated Flag-RNF168 constructs and siRNAs. (d–e) IB analysis of WCL and endogenous RNF168 IP derived from 293T cells pre-treated with 50 nM rapamycin (d) or transfected with S6K1 siRNA (e). (f) IB analysis of WCL and endogenous RNF168-IP derived from WT and S6k−/− MEF cells with indicated antibodies. (g) IB analysis of WCL and endogenous RNF168-IP derived from WT MEF cells treated with/without AA with indicated antibodies. (h) Recombinant GST-RNF168 proteins were incubated with purified HA-S6K1 to perform in vitro kinase assay in the presence of ATP and kinase inhibitors (PF4708671 (PF), 10 mM or rapamycin (Rapa.), 5 mM) as indicated. The products were stained with ponceau S first and then detected with indicated antibodies. The immunoblots are representative of three independent experiments. Unprocessed original scans of blots are shown in Supplementary Fig. 8.
Figure 3
Figure 3. Ser60 phosphorylation inhibits RNF168 function and impairs DNA damage repair
(a) IB analysis of histone extracts from 293T cells transfected with indicated constructs. (b) Recombinant GST-RNF168 proteins were incubated with mononucleosome in the presence of E1/E2 for in vitro ubiquitination assays. The products were stained with ponceau S first and then detected with indicated antibodies. (c–d) Quantification of WT and S60A/S60E knock-in MEF cells fixed at indicated time after IR (4 Gy) treatment and stained for γH2A.X (c) and 53BP1 (d) foci. The percentage of positive cells (>10 foci) among 100 cells for each sample were calculated and plotted. Results are from n=3 independent repeats, related to Supplementary Fig. 3e. (e) Neutral comet assays with WT and S60A/S60E knock-in MEF cells harvested at indicated time after IR (50 Gy) treatment. Scale bars, 5 μm. Cell numbers analyzed for NT (no treatment): WT, n=114; SA, n=130; SE, n=148 cells. 30 min post IR: WT, n=148; SA, n=157; SE, n=189 cells. 3h post IR: WT, n=138; SA, n=102; SE, n=181 cells. The results were from a single experiment. (f) FACS analysis of primary B cells expressing IgG1 from WT and S60A/S60E knock-in mice and stimulated with LPS (20 μg/ml) and IL-4 (25 ng/ml) for indicated days to determine antibody class switch recombination (CSR) efficiency. The number of mice analyzed: WT, n=11; SA, n=6; SE, n=5 mice. (g–h) Statistical analysis (g) and representative images (h) of γH2A.X immunohistochemistry (IHC) staining in lung sections from WT and S60A/S60E knock-in mice (6 mice for each group) 5 days post irradiation treatment (10Gy). Scale bars, 50 μm. Sections numbers analyzed for NT: WT, n=23; SA, n=20; SE, n=15 sections. For IR group: WT, n=53; SA, n=58; SE, n=36 sections. The results were from a single experiment. (i–j) Quantification (i) and representative images (j) of intestinal regenerating villi from mice in (g–h). n=20 fields per genotype were analyzed (×20 magnification) after HE staining. Scale bars, 50 μm. Unpaired student’s t test is used (ns, no significance; **0.001<p<0.01 and ***p<0.001) and data were shown mean ± s.e.m. Statistics source data can be found in Supplementary Table 3. The immunoblots are representative of three independent experiments. Unprocessed original scans of blots are in Supplementary Fig. 8.
Figure 4
Figure 4. RNF168 Ser60 phosphorylation promotes its degradation
(a–b) Protein and mRNA levels of RNF168 were determined by IB analysis and q-PCR from WT and S6k−/− MEF cells. (c) Half-life of RNF168 protein in WT and S6k−/− MEF cells. CHX, cycloheximide, 100 μg/ml. (d) IB analysis of WCL from U2OS cells infected with lenti-viral shS6K1 or shGFP. (e–f) IB analysis of WCL from U2OS cells treated with indicated shRNAs (e) or with indicated siRNAs (f). (g) IB analysis of S6k−/− MEF cells infected with virus expressing HA-S6K1 or empty vector (EV). Cells were harvested at indicated time after 20 μM etoposide treatment. (h) IB analysis of WCL from 293T cells transfected with indicated constructs. Cells were treated with/without 15 μM MG132 for 12 hours before harvest. KR, A kinase-dead version of S6K1 construct. (i) Half-life of Flag-RNF168 in 293T cells transfected with indicated plasmids. 36 hours after transfection, CHX (100 μg/ml) was added and cells were harvested at indicated time points for IB analysis. (j) 293T cells were cultured in amino acids free (-AA.) medium for indicated period of time, then were harvested directly or at indicated time points after re-addition of amino acids (+AA.) for IB analysis. (k–l) Representative images of RNF168 and pS6 signals in tissue microarrays containing 53 sets of clinical lung adenocarcinoma tissues and paired adjacent normal tissues as assessed by IHC. Both RNF168 and pS6 levels were classified as low and high based on the intensities of the IHC staining, and the number of tissues classified in each category are depicted in the tabulation in (l). Chi-square test was used to support a significant inverse correlation (p=0.000329, 95% CI is from 0.369 to 0.765) between RNF168 and pS6 levels in clinical samples. The numbers of samples with high/low RNF168 and pS6 levels are indicated. Scale bars, 100 μm. Unpaired student’s t test is used for (b) (***p<0.001) and data were shown mean ± s.e.m. Statistics source data can be found in Supplementary Table 3. The immunoblots are representative of three independent experiments. Unprocessed original scans of blots are in Supplementary Fig. 8.
Figure 5
Figure 5. Ser60 Phosphorylation destabilizes RNF168 in a TRIP12-depended manner
(a–b) IB analysis of WCL and Flag-IP from 293T cells co-transfected with indicated siRNAs and constructs. A mixture of two independent siRNAs targeting TRIP12 and control siRNA (Ctrl) were used. 12 hours before harvest for Flag-IP, 15μM MG132 was added to the cells in (b). (c) U2OS cells expressing Flag-RNF168-WT were serum starved and treated with 15μM MG132 for 12 hours before addition of insulin (45 μg/ml) and rapamycin (Rapa., 50 nM). 30 minutes later, cells were harvested for Flag-IP and IB analysis with indicated antibodies. (d) IB analysis of HA-IP and WCL from 293T cells co-transfected with indicated constructs. (e) IB analysis of HA-IP and WCL from 293T cells transfected with indicated constructs and treated with AA and PF4708671 (PF, 10μM). 36 hours after transfection, cells were cultured in AA free medium for 3 hours before treated with AA and PF for another 30 minutes. Then cells were harvested for HA-IP and IB analysis as indicated. (f) IB analysis of WCL from 293T cells co-transfected with RNF168 constructs and siRNAs targeting TRIP12 (T12) or control (Ctrl.) as indicated. (g) IB analysis of Flag-IP and WCL from U2OS stable cell lines expressing Flag-RNF168 variants with indicated antibodies. 12 hours before harvest, 15μM MG132 was added to the cells. (h) A schematic structure of TRIP12 truncation constructs. (i) IB analysis of Flag-IP and WCL from 293T cells transfected with HA-RNF168 and Flag-TRIP12 constructs as indicated in (h). The immunoblots are representative of three independent experiments. Unprocessed original scans of blots are in Supplementary Fig. 8.
Figure 6
Figure 6. Inhibition of RNF168 by mTORC1-S6K contributes to DDR defects caused by Lkb1 loss
(a) IB analysis of WCL derived from U2OS cells infected with lenti-viral shRNAs targeting RNF168 or LKB1. (b) IB analysis of endogenous RNF168-IP and WCL derived from WT and Lkb1−/− MEF cells. (c) U2OS cells were first stably infected with PLKO vector or lenti-viral shRNAs targeting LKB1, and then transfected with indicated siRNAs. 48 hours after transfection, WCL were made for IB analysis with indicated antibodies. (d) IB analysis of RNF168 in WT and Lkb1−/− MEF cells that infected with empty vector (V) or RNF168 S60A (SA)/RNF168 S60E (SE) expressing lenti-virus. (e–f) Representative images (e) and quantification of 53BP1 foci (f) in resulting MEF cells from (d). The percentage of positive cells (>10 foci) among 100 cells for each sample were calculated and plotted. Results are from n=3 independent experiments. Scale bars, 10 μm. (g–h) Indicated MEF cells from (d) were split by the limited dilution and exposed to indicated doses of IR (g) or etoposide treatment (h). 7 days later, the dishes were stained with crystal violet and visible colonies were counted and plotted. Results are from n=4 independent experiments in (g) and from n=3 independent experiments in (h). Panels in (ad) are representative of 3 experiments. Unpaired student’s t test is used for (f–h) (**0.001<p<0.01 and ***p<0.001) and data were shown mean ± s.e.m. Statistics source data can be found in Supplementary Table 3. Unprocessed original scans of blots are in Supplementary Fig. 8.
Figure 7
Figure 7. Phospho-deficient RNF168-SA mutant suppresses tumorigenesis in KrasG12D/Lkb1L/L mice NSCLC model
(a) Schematic model of lung tumorigenesis from KrasG12D/Lkb1L/L mice treated with lenti-CRE-RNF168 virus. 10 weeks after nasal inhalation, mice were sacrificed and analyzed. (b) Tumor histology images from all the mice treated in (a). Scale bar, 5 mm (n=6 mice for each group). (c–d) The total tumor burden (c) and average tumor numbers (d) from (a) were calculated and plotted (n=6 mice for each group). (e) Representative images for γH2A.X IHC staining in lung tissues from (b). Scale bar, 100 μm (50 μm in the magnification). T, tumor; N, normal lung tissue next to tumor nodules. (f–g) Statistical analysis of γH2A.X IHC staining in KrasG12D/Lkb1L/L mice lung tumor sections (f) and normal lung (g) from (a). Section numbers for analysis in (f): Ctrl, n=47; SA, n=39; SE, n=52 sections. And for analysis in (g): Ctrl, n=47; SA, n=48; SE, n=65 sections. Data are collected from 6 mice in each group. (h) Proposed model for how phosphorylation of RNF168, caused by extracellular growth signals and tumor suppressors loss and subsequent mTORC1 activation, impairs proper DNA damage repair in mutated cancer cells and therefore contributes to tumorigenesis. The experiments in panels (a–g) were performed twice. Unpaired student’s t test is used for (c–d) and (f–g) (***p<0.001) and data were shown mean ± s.e.m. Statistics source data can be found in Supplementary Table 3.

References

    1. Langie SA, et al. Causes of genome instability: the effect of low dose chemical exposures in modern society. Carcinogenesis. 2015;36(Suppl 1):S61–88. - PMC - PubMed
    1. Ciccia A, Elledge SJ. The DNA damage response: making it safe to play with knives. Molecular cell. 2010;40:179–204. - PMC - PubMed
    1. Symington LS, Gautier J. Double-strand break end resection and repair pathway choice. Annual review of genetics. 2011;45:247–271. - PubMed
    1. Khanna KK, Jackson SP. DNA double-strand breaks: signaling, repair and the cancer connection. Nature genetics. 2001;27:247–254. - PubMed
    1. Jackson SP. Sensing and repairing DNA double-strand breaks. Carcinogenesis. 2002;23:687–696. - PubMed

Publication types

MeSH terms

Substances