. 2018 Apr;17(4):361-368.
doi: 10.1038/s41563-017-0007-z. Epub 2018 Feb 5.

Quantitative self-assembly prediction yields targeted nanomedicines

Affiliations

Quantitative self-assembly prediction yields targeted nanomedicines

Yosi Shamay et al. Nat Mater. 2018 Apr.

Abstract

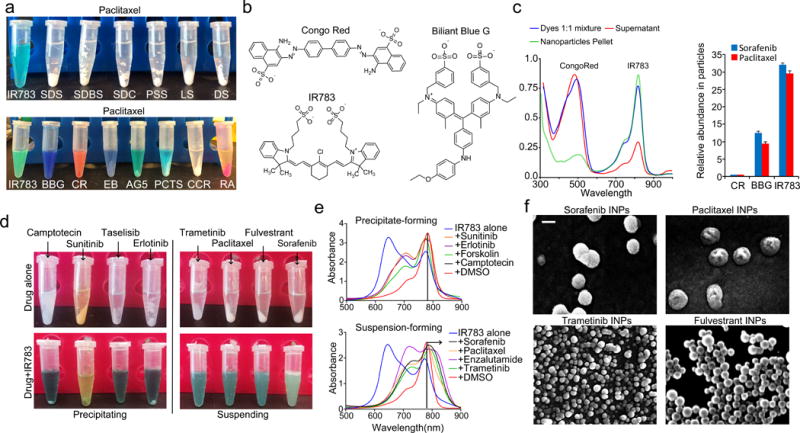
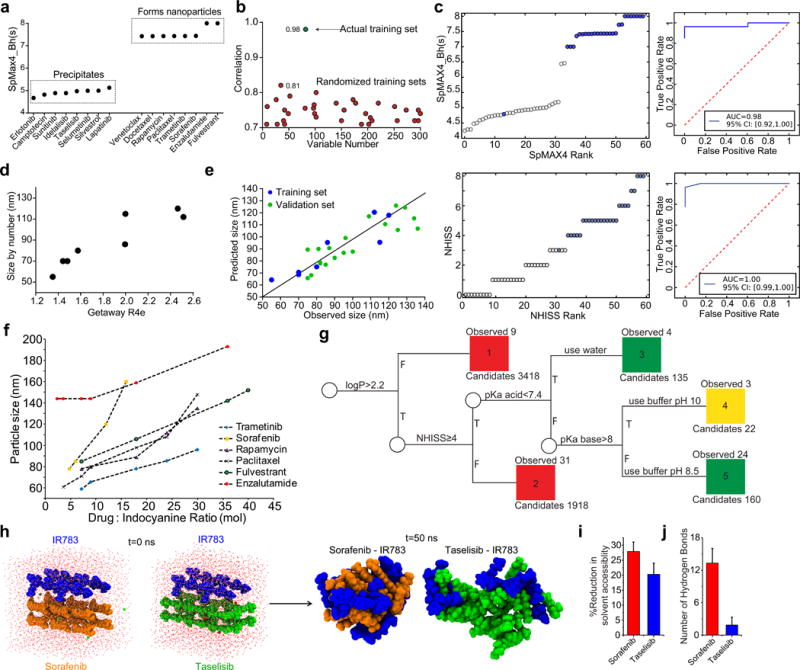
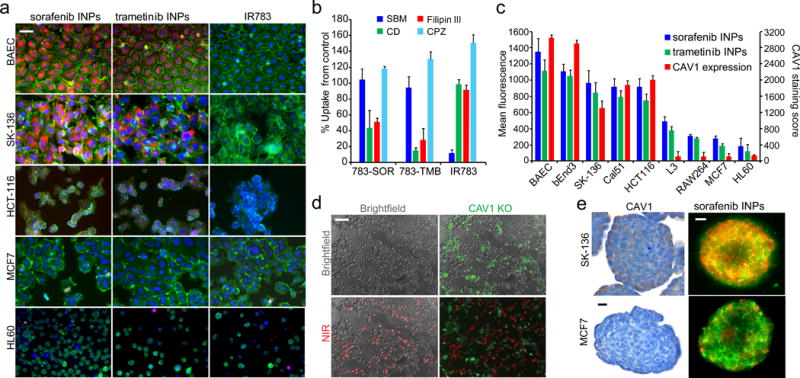
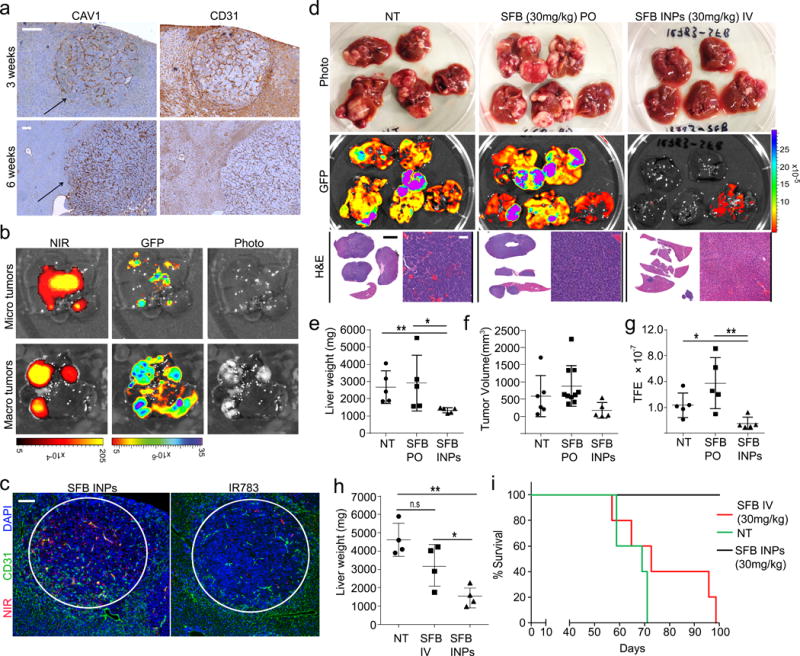
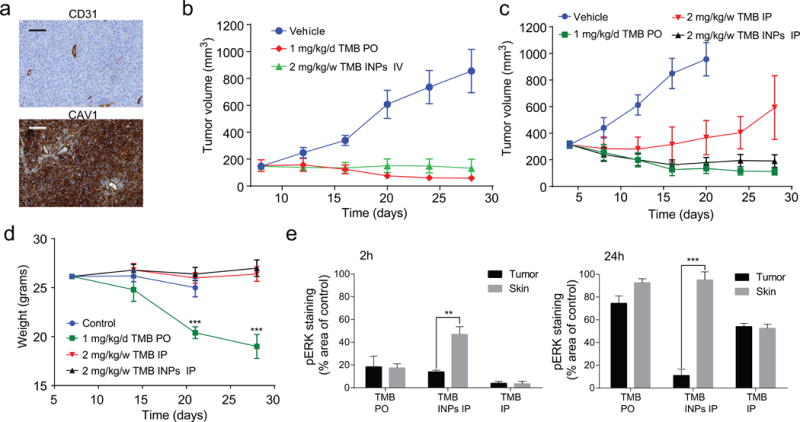
Development of targeted nanoparticle drug carriers often requires complex synthetic schemes involving both supramolecular self-assembly and chemical modification. These processes are generally difficult to predict, execute, and control. We describe herein a targeted drug delivery system that is accurately and quantitatively predicted to self-assemble into nanoparticles based on the molecular structures of precursor molecules, which are the drugs themselves. The drugs assemble with the aid of sulfated indocyanines into particles with ultrahigh drug loadings of up to 90%. We devised quantitative structure-nanoparticle assembly prediction (QSNAP) models to identify and validate electrotopological molecular descriptors as highly predictive indicators of nano-assembly and nanoparticle size. The resulting nanoparticles selectively targeted kinase inhibitors to caveolin-1-expressing human colon cancer and autochthonous liver cancer models to yield striking therapeutic effects while avoiding pERK inhibition in healthy skin. This finding enables the computational design of nanomedicines based on quantitative models for drug payload selection.


Conflict of interest statement

Competing financial interests

The authors declare no competing financial interests

Figures

Figure 1
Figure 1. Indocyanine-drug self-assembled nanoparticles
(a) Result of attempted water dispersion of paclitaxel with a panel of excipients. Sodium dodecyl sulfate (SDS), sodium dodecylbenzene sulfonate (SDBS), sodium deoxycholate (SDC), poly-4-styrensulfonate (PSS), lignin sulfonate (LS) and dextran sulfate (DS), Congo red (CR), Evans blue (EB), acid green 5(AG5), phtalocyanine tetra sulfonate (PCTS), Rhodamine 6G (RA), chromaxane cyanine R (CCR). (b) Chemical structures of dye excipients that most efficiently suspended drugs. (c) absorbance spectrum of Congo red/IR783 dye mixtures before and after suspension of paclitaxel as well as relative abundance of each dye in the suspensions. (d) Images of precipitating and suspending IR783-drug mixtures. (e) Absorption spectra of IR783 upon introduction of drugs which resulted in precipitate formation, and upon introduction of drugs which resulted in suspensions. (f) Scanning electron microscopy (SEM) images of indocyanine-drug nanoparticles. Scale bar = 100 nm.
Figure 2
Figure 2. Computational prediction and analyses of indocyanine nanoparticle formation
(a) Training set of 16 drugs experimentally determined to precipitate or form nanoparticles with indocyanine and plotted according to the SpMAX4_Bh(s) descriptor. (b) Pearson coefficient of SpMAX4_Bh(s) correlation to experimental data for 300 randomized training sets (red circles) and the actual training set (green circle). (c) Statistical analyses of experimentally validated predictions made with SpMAX4_Bh(s) and NHISS. Descriptor score of each drug plotted by ascending rank of that drug and corresponding receiver operating characteristic (ROC) curves. Blue = forms nanoparticles experimentally. White = does not form nanoparticles. (d) A training set of experimentally-determined nanoparticle size formed with indocyanine, and linearly correlated to the molecular descriptor GETAWAY R4e. R2 = 0.84 (95% CI [0.22, 0.98], N=8) (e) Validation set of drug molecules based on the Getaway-R4e descriptor. (f) Nanoparticle size as a function of drug:indocyanine ratio. (g) Decision tree for INP self-assembly. Green=formation of stable nanoparticles in PBS pH 7.4, yellow=formation of stable nanoparticles in basic pH, and red = non forming nanoparticles. Descriptors were calculated by Dragon and ChemAxon. (h) Snapshots from the top clusters acquired from all-atom molecular dynamics simulations of drug-indocyanine systems. Indocyanine, sorafenib, and taselisib molecules are blue, orange, and green, respectively. (i) Reduction in solvent accessible surface area of drug due to the presence of indocyanine. (j) Number of intra-nanoparticle hydrogen bonds averaged over the simulated trajectory. Error bars indicate standard deviation, n=5000. Bar graphs are of mean ±SD.
Figure 3
Figure 3. Internalization of indocyanine nanoparticles in 2D and 3D cell culture
(a) Fluorescence micrographs of INP internalization in different cell lines. Green = membrane stain (CellMask), red = indocyanine nanoparticle, blue = nuclear staining. (b) Inhibition of internalization mechanisms with chemical inhibitors, including cyclodextrin (CD) and filipin III inhibitors of caveolae, chloropromazine (CBZ) inhibitor of clathrin-mediated endocytosis, and bromo-sulfophthalein (SBM) inhibitor of OAT1-3. (c) Indocyanine nanoparticle uptake in cell lines, quantified by fluorescence intensity correlated with CAV1 expression (R2=0.86). (d) Nanoparticle uptake in a co-culture of CAV1 knockout (green) and WT HCT116 cells (unstained). Red = near-infrared (NIR) dye fluorescence. (e) CAV1 staining in tumor spheroids composed of two different cell lines and nanoparticle fluorescence in tumor spheroids. Green = CellMask, red = nanoparticle fluorescence. Scale bar = 25μm. Bar graphs are of mean ±SD.
Figure 4
Figure 4. Indocyanine nanoparticle targeting and efficacy in MYC-driven autochthonous murine hepatic tumor model
(a) CAV1 and CD31 staining in liver sections 3 weeks and 6 weeks after hydrodynamic injection. Arrow indicates tumor nodule. Scale bar = 50μm. (b) Fluorescence images of livers with multiple GFP-positive tumor nodules 24 h after administration of nanoparticles. NIR = INP indocyanine emission, GFP = cancer fluorescence. (c) Immunofluorescence images of tissue slices from the autochthonous liver cancer model 24 h after injections of sorafenib INPs or free IR783 dye. Red = NIR fluorescence, green = CD31 antibody for blood vessels, blue = DAPI nuclear stain. Scale bar = 100 μm. (d) Imaging data including photographs, tumor GFP fluorescence and H&E of livers extracted from mice treated with sorafenib (SFB) orally (PO) or sorafenib INPs (SFB INPs) intravenously (IV) for 28 days. Scale bar = 50 μm. White scale bar=50μm, Black scale bar=10mm (e) Liver weights, N=5, **P=0.006, *P=0.0426. (f) Tumor volume as measured in the livers if detectable. (g) Quantification of GFP fluorescence, N=5, **P=0.0098, *P=0.0201. (h) Comparison of liver weights from mice inoculated with 2× plasmids and treated with IV-administered sorafenib (SFB) or sorafenib INPs (SFB INPs) weekly for three weeks, N=4, **P=0.0021 *P=0.039 n.sP=0.067 (i) Survival data after treatments with i.v.-administered sorafenib (SFB IV) or sorafenib INPs, N=5, log-rank test z = 3.18, P = 0.00113.
Figure 5
Figure 5. Anti-tumor efficacy in HCT116 colon cancer model
(a) Immunohistochemical staining of tumor section for CAV1 and CD31 expression in HCT116 xenografts 2 weeks after inoculation. (b) Tumor growth inhibition in response to i.v injected nanoparticles weekly or free drug given orally daily (N=6) at equivalent doses. (c) Tumor growth inhibition in response to a weekly dose of nanoparticles or free drug injected i.p (N=6) vs. an oral daily dose of free drug. (d) Weights of tumor-bearing mice during treatments. Error bars are ±SD of mean, N=6, ***P=0.0002, 0.00061. (e) Quantification of IHC staining area of pERK in skin and tumor tissue divided by the average staining area of untreated tumors. Error bars are ±SE of mean, N=5, **P=0.008, and ***P=0.00014.

Comment in

References

    1. Peer D, Karp JM, Hong S, FaroKHzad OC, Margalit R, Langer R. Nanocarriers as an Emerging Platform for Cancer Therapy. Nature nanotechnology. 2007;2:751–760. - PubMed
    1. Schroeder A, Heller DA, Winslow MM, Dahlman JE, Pratt GW, Langer R, Jacks T, Anderson DG. Treating Metastatic Cancer with Nanotechnology. Nature reviews Cancer. 2012;12:39–50. - PubMed
    1. Yaari Z, et al. Theranostic Barcoded Nanoparticles for Personalized Cancer Medicine. Nature communications. 2016;7:13325. - PMC - PubMed
    1. Wilhelm S, Tavares AJ, Dai Q, Ohta S, Audet J, Dvorak HF, Chan WCW. Analysis of Nanoparticle Delivery to Tumours. Nat Rev Mater. 2016;1
    1. Cheng Z, Al Zaki A, Hui JZ, Muzykantov VR, Tsourkas A. Multifunctional Nanoparticles: Cost Versus Benefit of Adding Targeting and Imaging Capabilities. Science. 2012;338:903–10. - PMC - PubMed

Publication types