. 2018 Feb 5;8(1):2354.
doi: 10.1038/s41598-018-20713-6.

Effect of tube current on computed tomography radiomic features

Affiliations

Effect of tube current on computed tomography radiomic features

Dennis Mackin et al. Sci Rep. .

Abstract

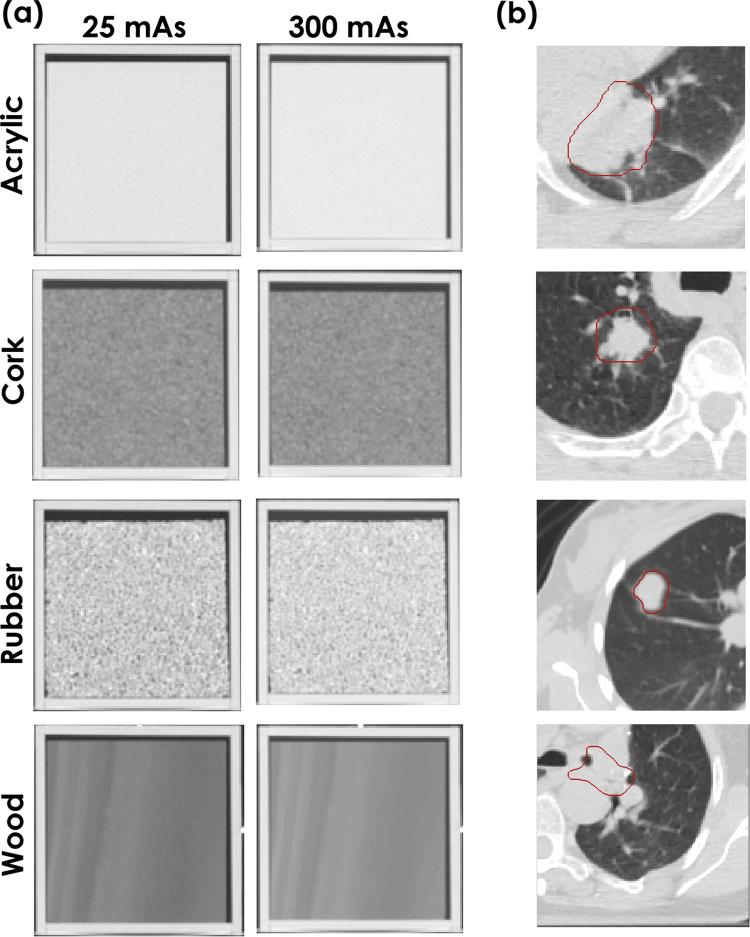
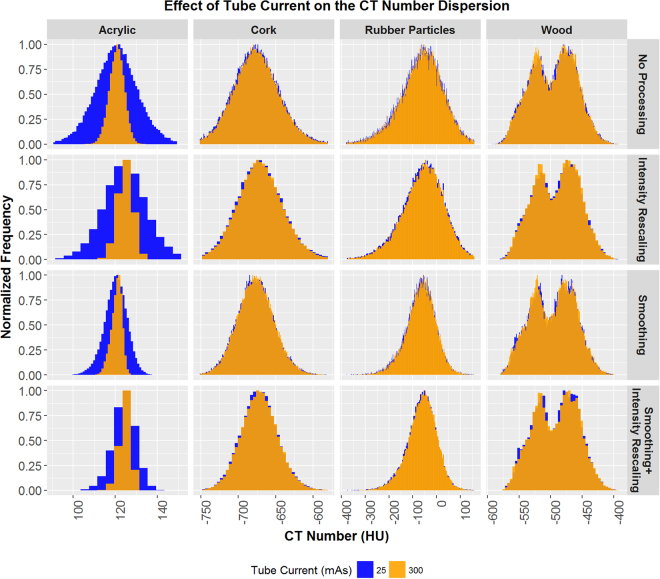
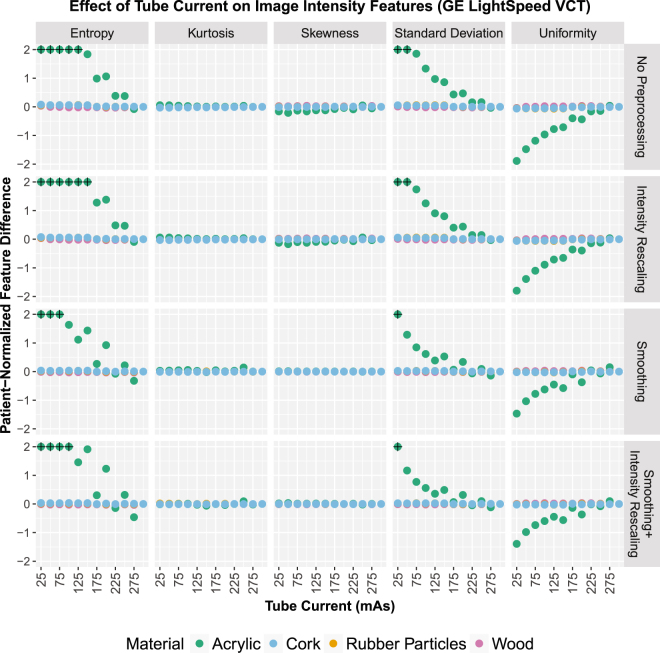
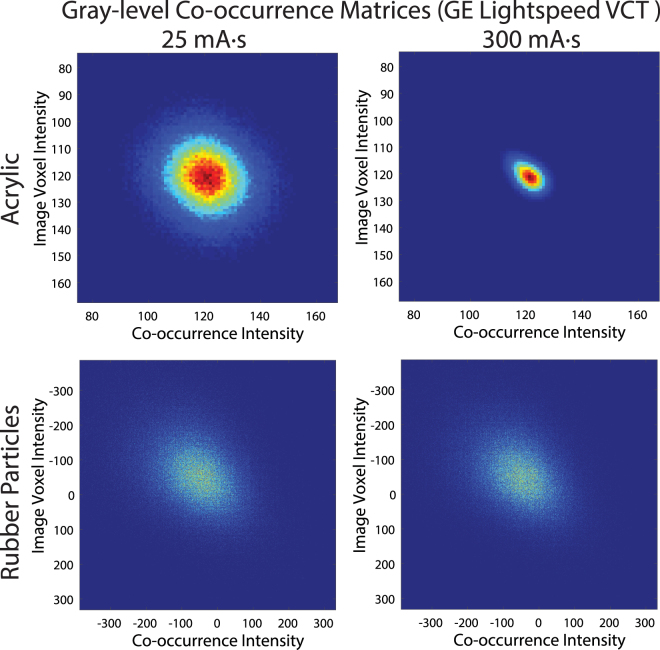
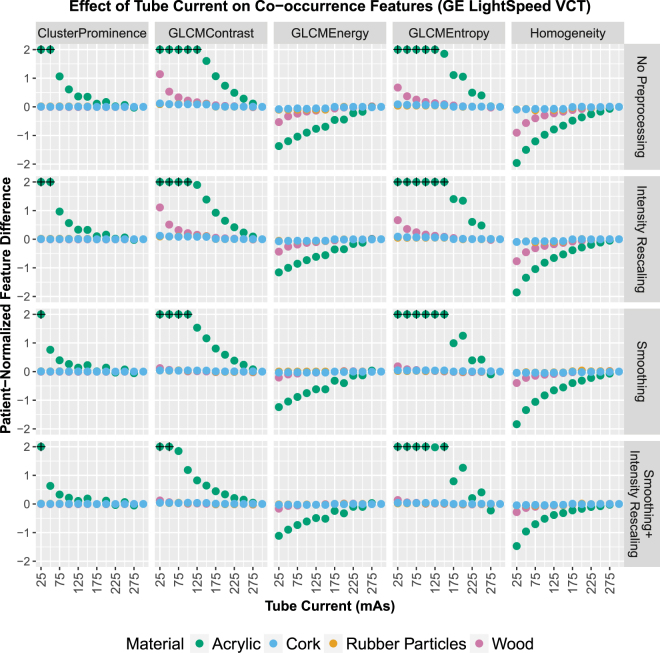
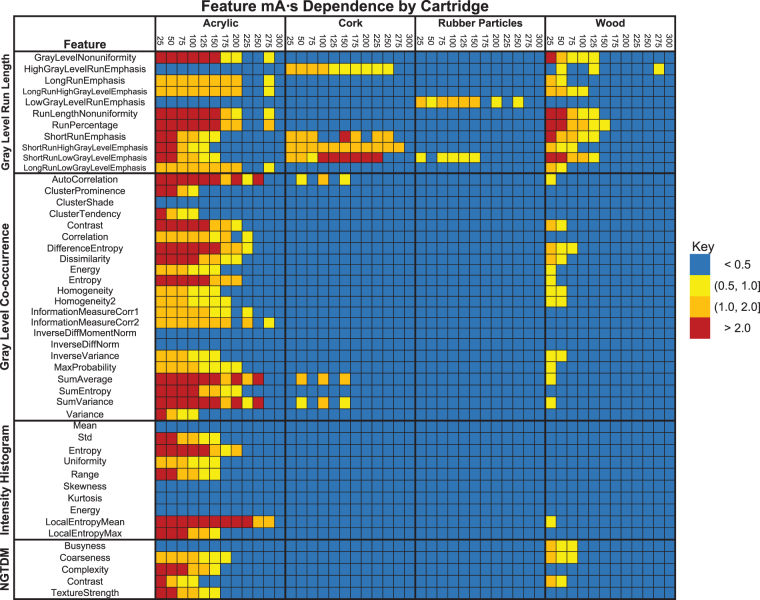
Variability in the x-ray tube current used in computed tomography may affect quantitative features extracted from the images. To investigate these effects, we scanned the Credence Cartridge Radiomics phantom 12 times, varying the tube current from 25 to 300 mA∙s while keeping the other acquisition parameters constant. For each of the scans, we extracted 48 radiomic features from the categories of intensity histogram (n = 10), gray-level run length matrix (n = 11), gray-level co-occurrence matrix (n = 22), and neighborhood gray tone difference matrix (n = 5). To gauge the size of the tube current effects, we scaled the features by the coefficient of variation of the corresponding features extracted from images of non-small cell lung cancer tumors. Variations in the tube current had more effect on features extracted from homogeneous materials (acrylic, sycamore wood) than from materials with more tissue-like textures (cork, rubber particles). Thirty-eight of the 48 features extracted from acrylic were affected by current reductions compared with only 2 of the 48 features extracted from rubber particles. These results indicate that variable x-ray tube current is unlikely to have a large effect on radiomic features extracted from computed tomography images of textured objects such as tumors.


Conflict of interest statement

The authors declare that they have no competing interests.

Figures

Figure 1
Figure 1
Cross sections of the (a) Credence Cartridge Radiomics phantom and (b) a representative cross sections of a non-small cell lung cancer tumors. The window level was (1600, −300) for all images. The columns in (a) show images acquired using tube currents of 25 and 300 mA∙s. The images in (b) were acquired with tube currents of 100 or 200 mA∙s.
Figure 2
Figure 2
Image intensity histograms for the acrylic, cork, rubber particle, and sycamore wood cartridges acquired using 25 and 300 mA∙s tube current on a GE LightSpeed VCT computed tomography (CT) scanner. For display purposes, the frequency values have been rescaled so that the maximum is 1.0.
Figure 3
Figure 3
Effects of reduced tube current values on the patient-normalized image intensity feature values for four phantom materials of varying degrees of texture. The effects were larger in materials with less texture, acrylic and wood. The images were acquired using a GE LightSpeed VCT scanner.
Figure 4
Figure 4
Images of the gray-level co-occurrence matrices for the acrylic and rubber particle cartridges for computed tomography scans acquired using 25 and 300 mA∙s tube current on a GE LightSpeed VCT scanner. For each co-occurrence matrix, the relative frequency of intensity pairs is plotted and scaled from 0 in dark blue to the max value for that matrix in dark red. Differences in the matrices were apparent for the homogeneous acrylic cartridge where increasing the mAs led to a diagonal distribution of intensity pairs compared to the lower mAs with its circular distribution.
Figure 5
Figure 5
Effects of reduced tube current on radiomic feature values for four phantom materials of varying degrees of texture, obtained using a GE LightSpeed VCT scanner. The effects were larger in materials with less texture, acrylic and sycamore wood. For display purposes, the values are restricted to the range (−2, 2), and points that fall outside the range are marked with a black + symbol.
Figure 6
Figure 6
Maps of the patient-normalized features extracted from the acrylic, cork, rubber particle, and sycamore wood cartridges. The columns represent the tube current (mA∙s) used to acquire the computed tomography scan and are grouped by the material. Colors other than blue indicate that the effect of the reduced tube current is large relative to the variability of the feature calculated for tumor samples from patients with non-small cell lung cancer. The almost solid blue table for the rubber particle cartridges indicates that reducing the tube current has little effect on the radiomic features. The images were acquired using a GE LightSpeed VCT scanner. NGTDM, neighborhood gray tone difference matrix.

References

    1. Fried DV, et al. Stage III Non-Small Cell Lung Cancer: Prognostic Value of FDG PET Quantitative Imaging Features Combined with Clinical Prognostic Factors. Radiology. 2016;278:214–222. doi: 10.1148/radiol.2015142920. - DOI - PMC - PubMed
    1. Fried DV, et al. Potential Use of (18)F-fluorodeoxyglucose Positron Emission Tomography-Based Quantitative Imaging Features for Guiding Dose Escalation in Stage III Non-Small Cell Lung Cancer. International journal of radiation oncology, biology, physics. 2016;94:368–376. doi: 10.1016/j.ijrobp.2015.10.029. - DOI - PubMed
    1. van Rossum PS, et al. The incremental value of subjective and quantitative assessment of 18F-FDG PET for the prediction of pathologic complete response to preoperative chemoradiotherapy in esophageal cancer. Journal of Nuclear Medicine. 2016;57:691–700. doi: 10.2967/jnumed.115.163766. - DOI - PubMed
    1. Scrivener M, et al. Radiomics applied to lung cancer: a review. Translational Cancer Research. 2016;5:398–409. doi: 10.21037/tcr.2016.06.18. - DOI
    1. Aerts HJ, et al. Defining a Radiomic Response Phenotype: A Pilot Study using targeted therapy in NSCLC. Sci Rep. 2016;6:33860. doi: 10.1038/srep33860. - DOI - PMC - PubMed

Publication types

MeSH terms