. 2018 Jan 18:10:53-65.
doi: 10.2147/CEOR.S148405. eCollection 2018.

Pain associated with health and economic burden in France: results from recent National Health and Wellness Survey data

Affiliations

Pain associated with health and economic burden in France: results from recent National Health and Wellness Survey data

Yacine Hadjiat et al. Clinicoecon Outcomes Res. .

Abstract

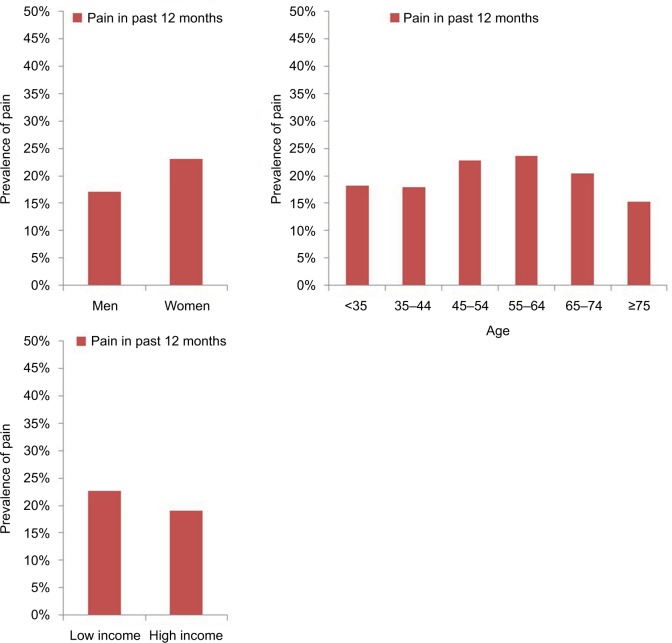
Purpose: This study aimed to estimate the prevalence of pain among French adults and assess the impact of pain on health-related quality of life (HRQoL), activity impairment, and health care resource use (HRU).

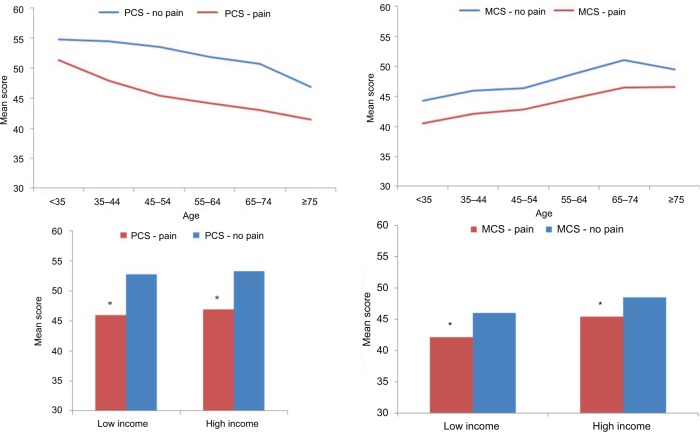
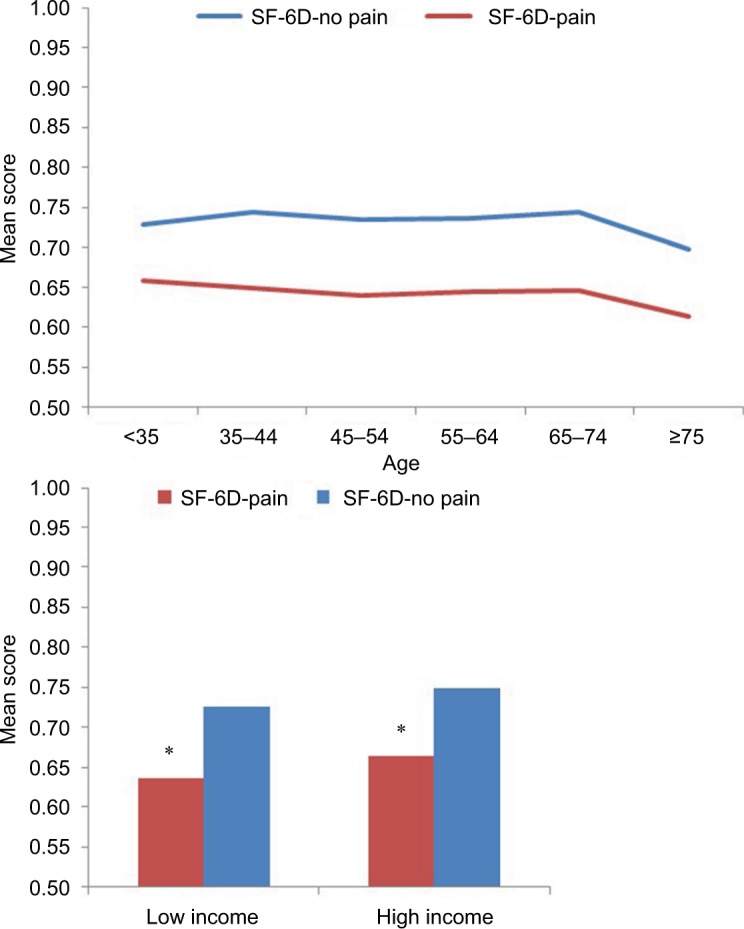
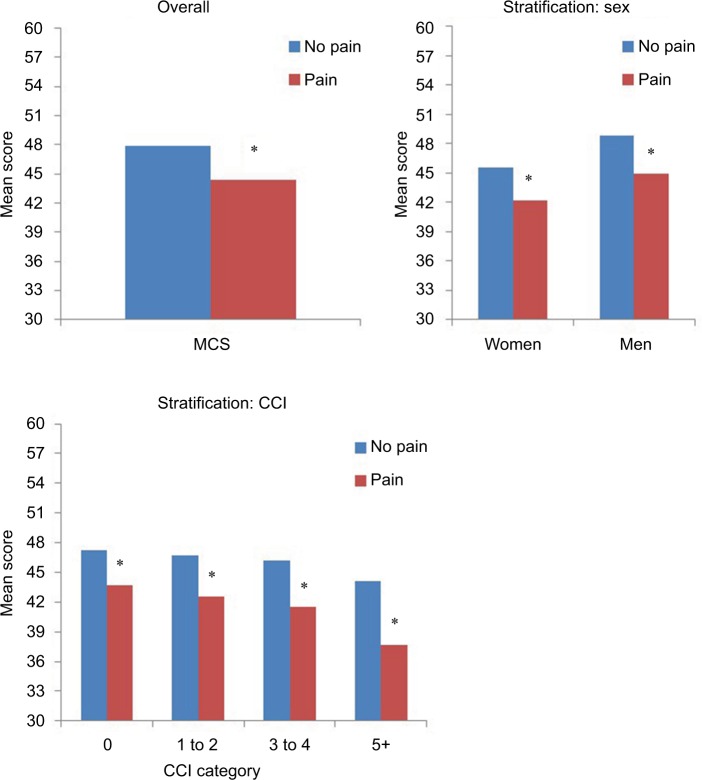
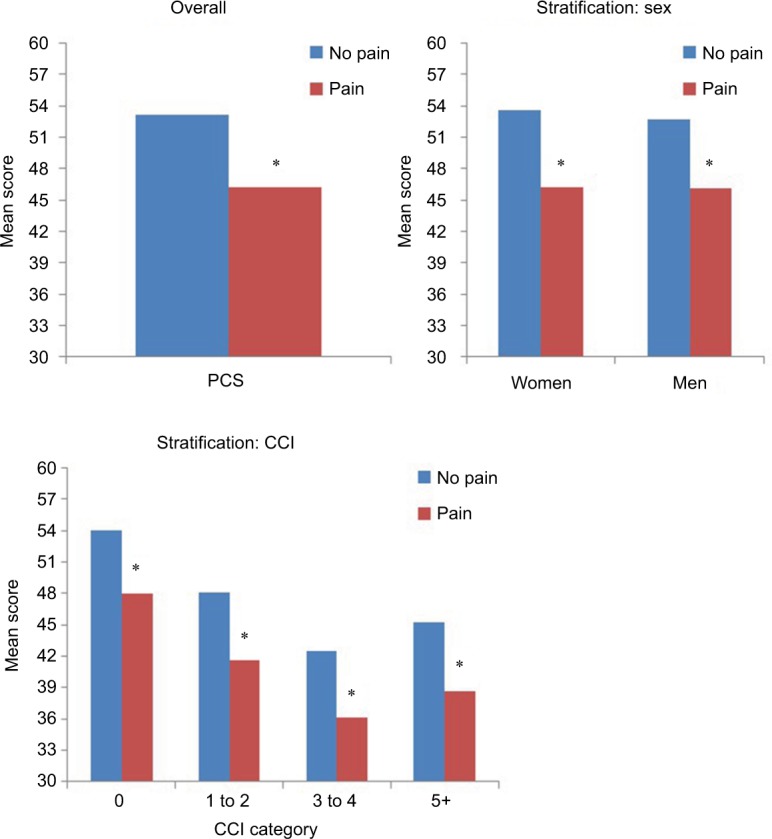
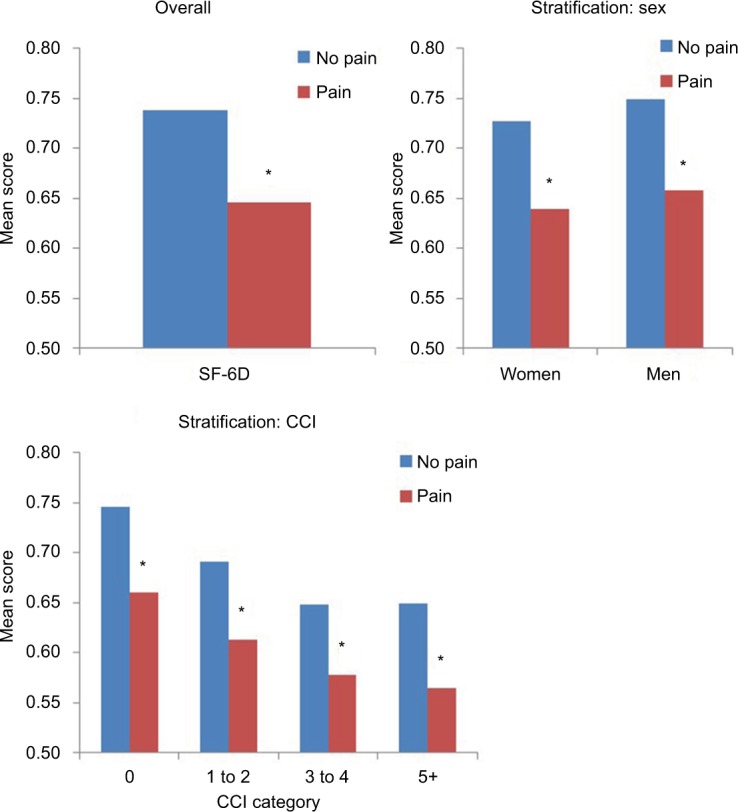
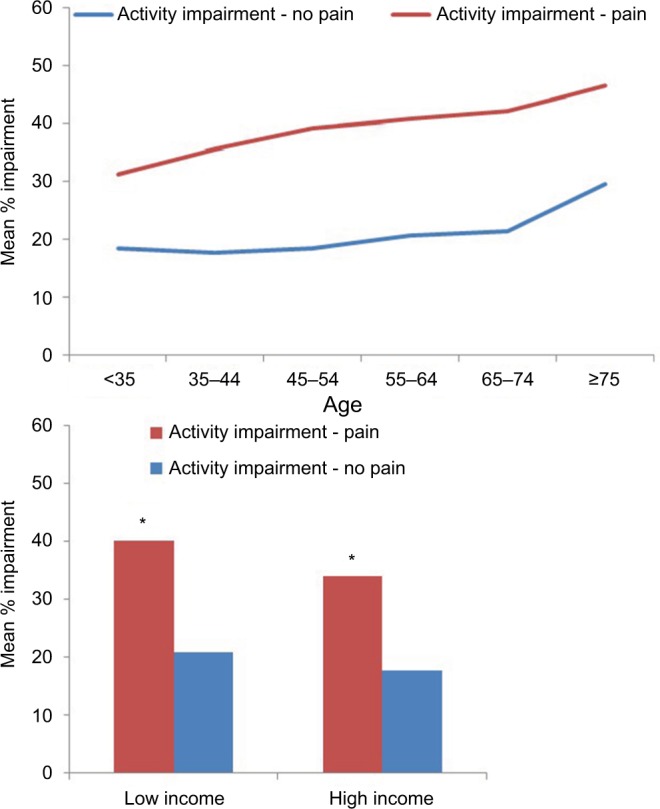
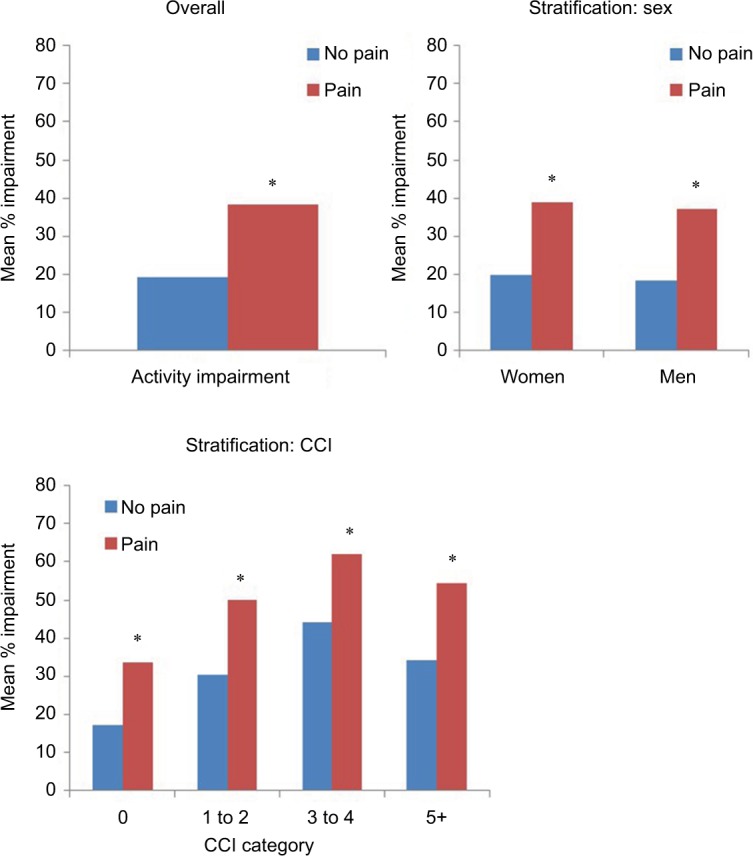
Patients and methods: Respondents from the 2015 France National Health and Wellness Survey (N=19,173) were categorized by self-reported pain (experienced pain in the past 12 months vs no pain) and compared on HRQoL (36-Item Short Form Health Survey version 2: Mental Component Summary, Physical Component Summary, and Short Form-6 Dimensions health utilities), activity impairment (Work Productivity and Activity Impairment questionnaire), employment status, and HRU (health care provider visits, emergency room visits, and hospitalizations). Bivariate analyses examined differences between pain groups stratified by age, sex, income, and Charlson comorbidity index (CCI) scores.

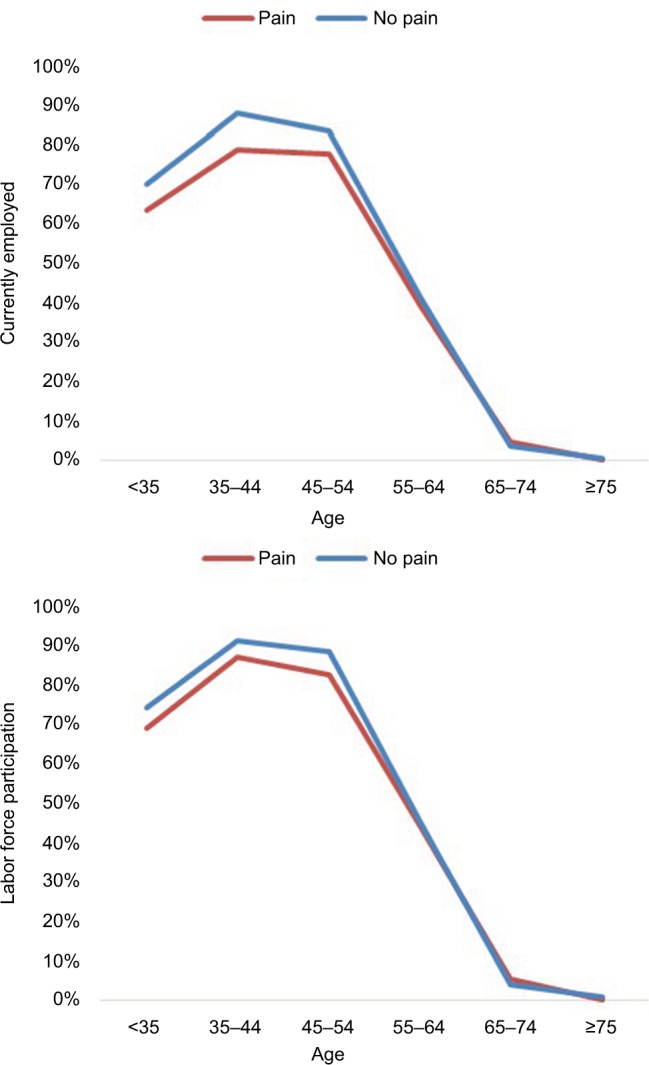
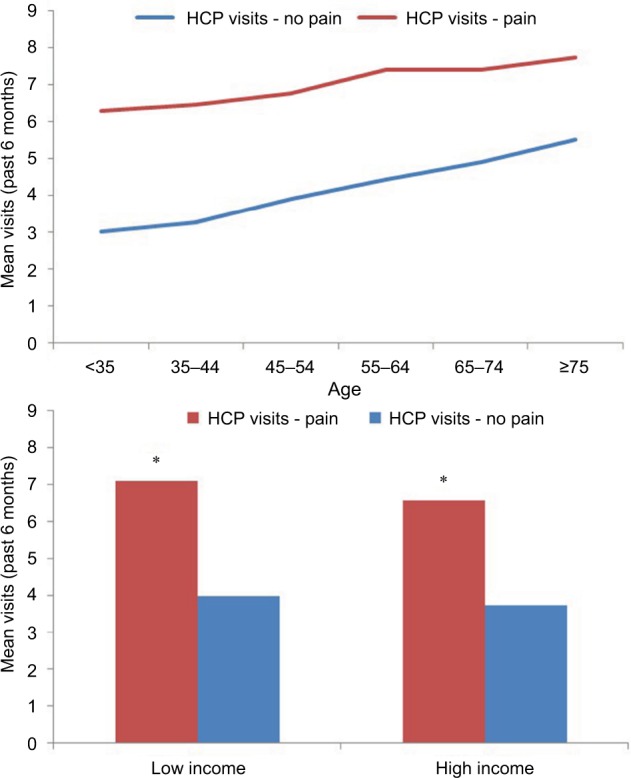
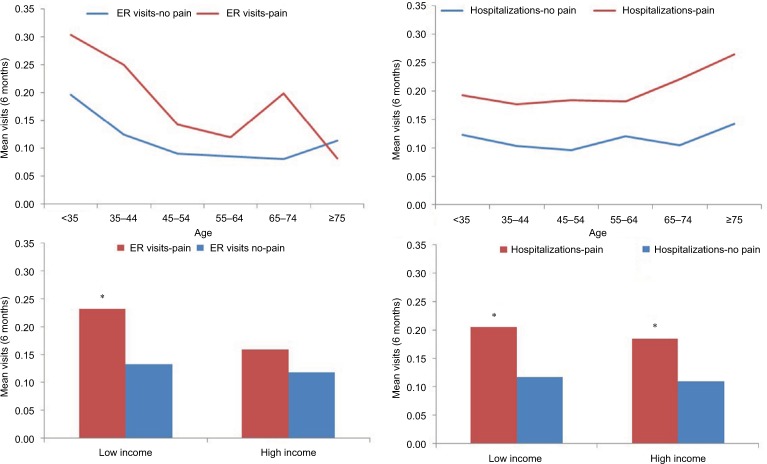
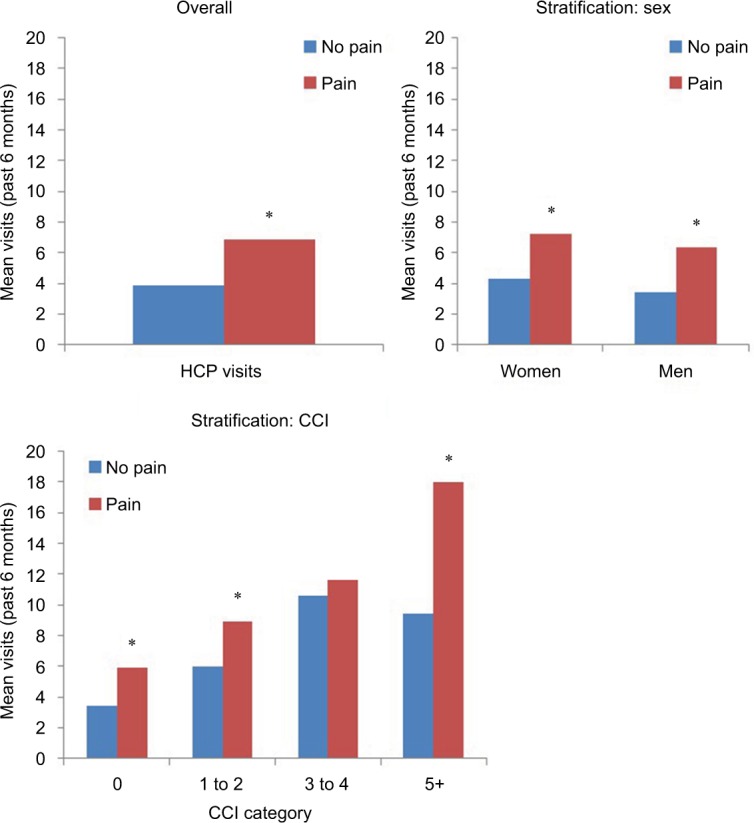
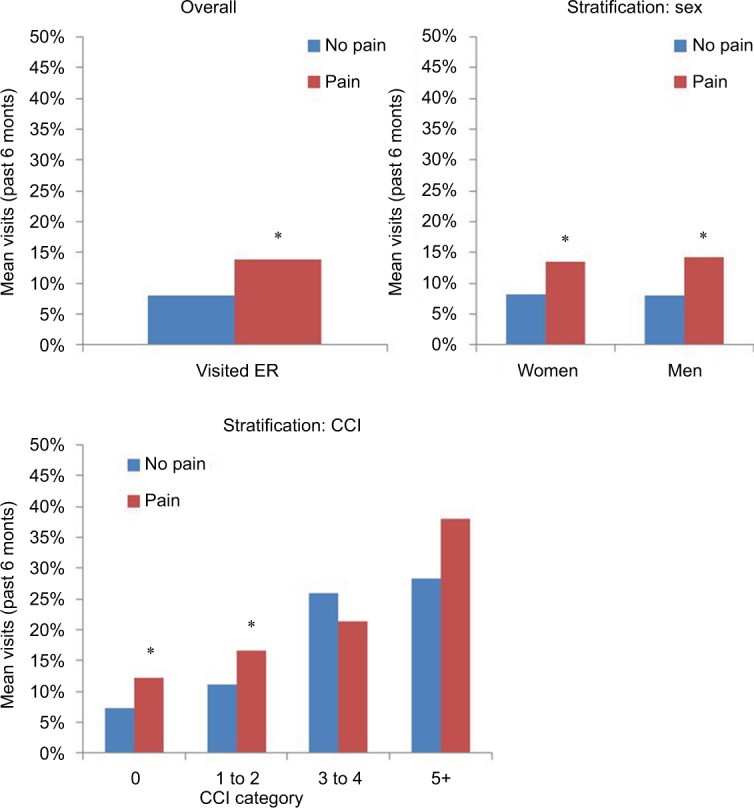
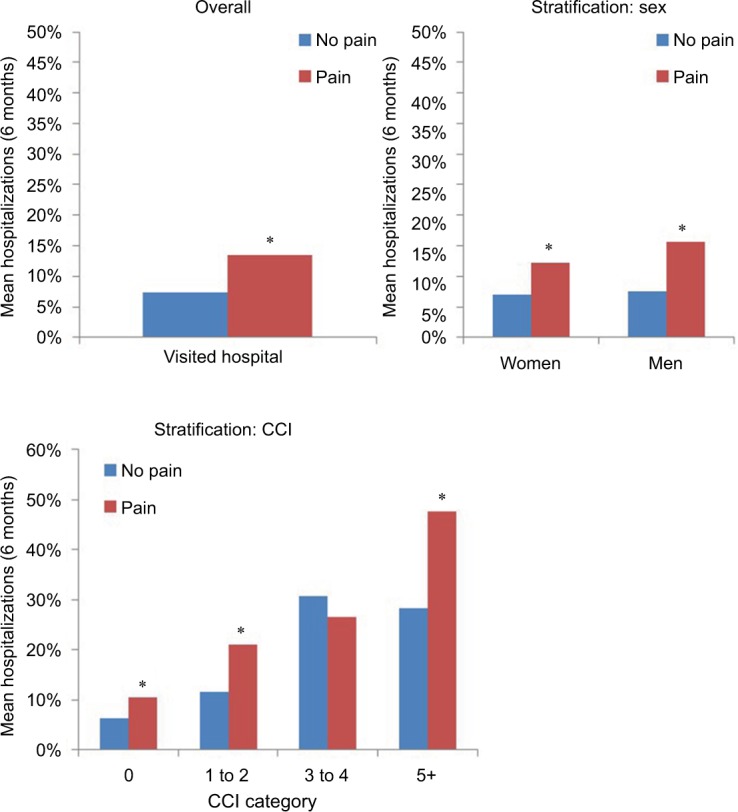
Results: Pain prevalence was 20.2% (n=4007). Mean Physical Component Summary decrements with pain ranged from 3.4 to 8.1 points among those aged <35 years to those aged 45-54 years, respectively. Results for Mental Component Summary and Short Form-6 Dimensions scores followed similar patterns. Regardless of income, sex, or CCI group, pain was associated with significant decrements on all HRQoL measures (for all, p<0.05). The impact of pain on activity impairment was lowest among those <35 years; this impact was higher in middle age and then tapered off among those aged ≥75 years. Pain was associated with greater activity impairment and more health care provider visits across income, sex, and CCI groups (for all, p<0.05). Generally, emergency room visits were more common among those with pain across age, sex, and CCI, but they were only significantly associated with pain in the lower income group (p<0.01). Pain was associated with significantly more hospitalizations across age and income groups.

Conclusion: Results suggest pain negatively affects HRQoL, activity impairment, and HRU across demographic subgroups. These findings help underscore the considerable health and economic burden of pain in France.

Keywords: activity impairment; health care resource use; health-related quality of life; prevalence.


Conflict of interest statement

Disclosure YH, BC, and LG are employees of Mundipharma. The authors report no other conflicts of interest in this work.

Figures

Figure 1
Figure 1
Prevalence of pain in the past 12 months, according to sex, age, and income level.
Figure 2
Figure 2
Mean mental and physical component summary scores, according to pain, age group, and income level. Notes: Pairwise tests between pain and no pain were significant for PCS for ages <35, 35–44, 45–54, 65–74, and ≥75; for MCS, for ages <35, 35–44, 45–54, 65–74. *p<0.05. Abbreviations: MCS, mental component summary; PCS, physical component summary.
Figure 3
Figure 3
Mean SF-6D health utility score, according to pain, age group, and income level. Notes: Pairwise tests between pain and no pain were significant for ages <35, 35–44, 45–54, 65–74, and ≥75. *p<0.05. Abbreviations: CCI, Charlson comorbidity index; SF-6D, Short Form 6-Dimensions.
Figure 4
Figure 4
Mental component summary scores, according to pain, sex, and CCI category. Notes: Higher CCI categories had small sample sizes. *p<0.05. Abbreviations: CCI, Charlson comorbidity index; MCS, mental component summary.
Figure 5
Figure 5
Physical component summary scores, according to pain, sex, and CCI category. Notes: Higher CCI categories had small sample sizes. *p<0.05. Abbreviations: CCI, Charlson comorbidity index; PCS, physical component summary.
Figure 6
Figure 6
SF-6D health utility scores, according to pain, sex, and CCI category. Notes: Higher CCI categories had small sample sizes. *p<0.05. Abbreviations: CCI, Charlson comorbidity index; SF-6D, Short Form 6-Dimensions.
Figure 7
Figure 7
Mean activity impairment (WPAI), according to pain, age group, and income level. Notes: Pairwise tests between pain and no pain were significant for ages <35, 35–44, 45–54, 65–74, and ≥75. *p<0.05. Abbreviation: WPAI, Work Productivity and Activity Impairment.
Figure 8
Figure 8
Mean activity impairment (WPAI), according to pain, sex, and CCI category. Notes: Higher CCI categories had small sample sizes. *p<0.05. Abbreviations: CCI, Charlson comorbidity index; WPAI, Work Productivity and Activity Impairment.
Figure 9
Figure 9
Prevalence of employment, according to pain and age group, in past 12 months. Notes: Pairwise tests between pain and no pain were significant for ages <35, 35–44, and 45–54 at p<0.05.
Figure 10
Figure 10
Mean number of health care provider visits in past 6 months, according to pain, age group, and income level. Notes: Pairwise tests between pain and no pain were significant for ages <35, 35–44, 45–54, 55–64, 65–74, and ≥75. *p<0.05. Abbreviation: HCP, health care provider.
Figure 11
Figure 11
Mean number of emergency room visits and hospitalizations in the past 6 months, according to pain, age group, and income level. Notes: Pairwise tests between pain and no pain were significant for ER visits for ages <35, 35–44, 45–54, and 65–74; for hospitalizations, for ages <35, 35–44, 45–54, 55–64, and 65–74. *p<0.05. Abbreviation: ER, emergency room.
Figure 12
Figure 12
Health care provider visits (6 months, all-cause) by pain, sex, and CCI category. Notes: Higher CCI categories had small sample sizes. *p<0.05. Abbreviations: CCI, Charlson comorbidity index
Figure 13
Figure 13
Percentage of adults visiting the emergency room by pain, sex, and CCI category. Notes: Higher CCI categories had small sample sizes. *p<0.05. Abbreviations: CCI, Charlson comorbidity index.
Figure 14
Figure 14
Percentage of adults who were hospitalized by pain, sex, and CCI category. Notes: Higher CCI categories had small sample sizes. *p<0.05. Abbreviation: CCI, Charlson comorbidity index.

Similar articles

Cited by

References

    1. Beck JG, Clapp JD. A different kind of co-morbidity: understanding posttraumatic stress disorder and chronic pain. Psychol Trauma. 2011;3(2):101–108. - PMC - PubMed
    1. Demyttenaere K, Bonnewyn A, Bruffaerts R, Brugh T, De Graaf R, Alonso J. Comorbid painful physical symptoms and depression: prevalence, work loss, and help seeking. J Affect Disord. 2006;92(2–3):185–193. - PubMed
    1. O’Brien T, Breivik H. The impact of chronic pain–European patients’ perspective over 12 months. Scand J Pain. 2012;3:23–29. - PubMed
    1. Goren A, Mould-Quevedo J, DiBonaventura MD. Prevalence of pain reporting and associated health outcomes across emerging markets and developed countries. Pain Med. 2014;15(11):1880–1891. - PubMed
    1. Breivik H, Eisenberg E, O’Brien T. The individual and societal burden of chronic pain in Europe: the case for strategic prioritization and action to improve knowledge and availability of appropriate care. BMC Public Health. 2013;13:1229. - PMC - PubMed

LinkOut - more resources