. 2018 Jan 19:11:1.
doi: 10.3389/fnmol.2018.00001. eCollection 2018.

Kv2 Ion Channels Determine the Expression and Localization of the Associated AMIGO-1 Cell Adhesion Molecule in Adult Brain Neurons

Affiliations

Kv2 Ion Channels Determine the Expression and Localization of the Associated AMIGO-1 Cell Adhesion Molecule in Adult Brain Neurons

Hannah I Bishop et al. Front Mol Neurosci. .

Abstract

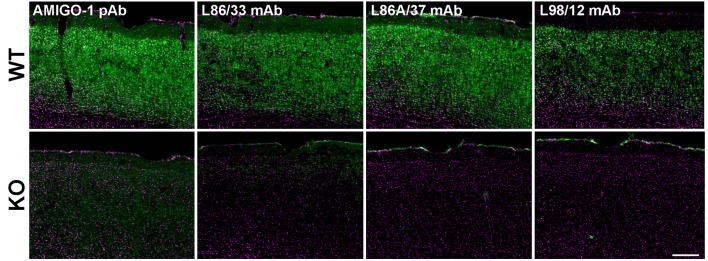
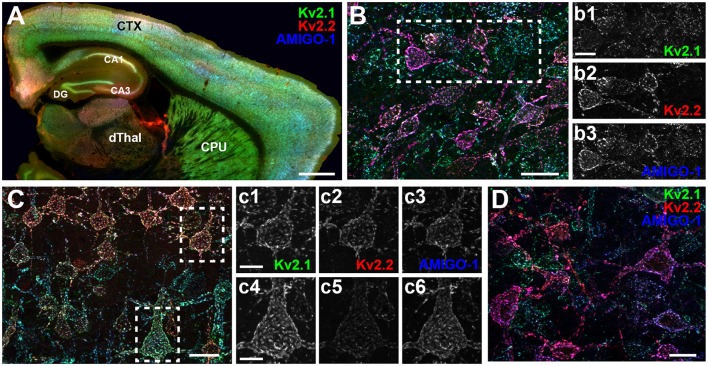
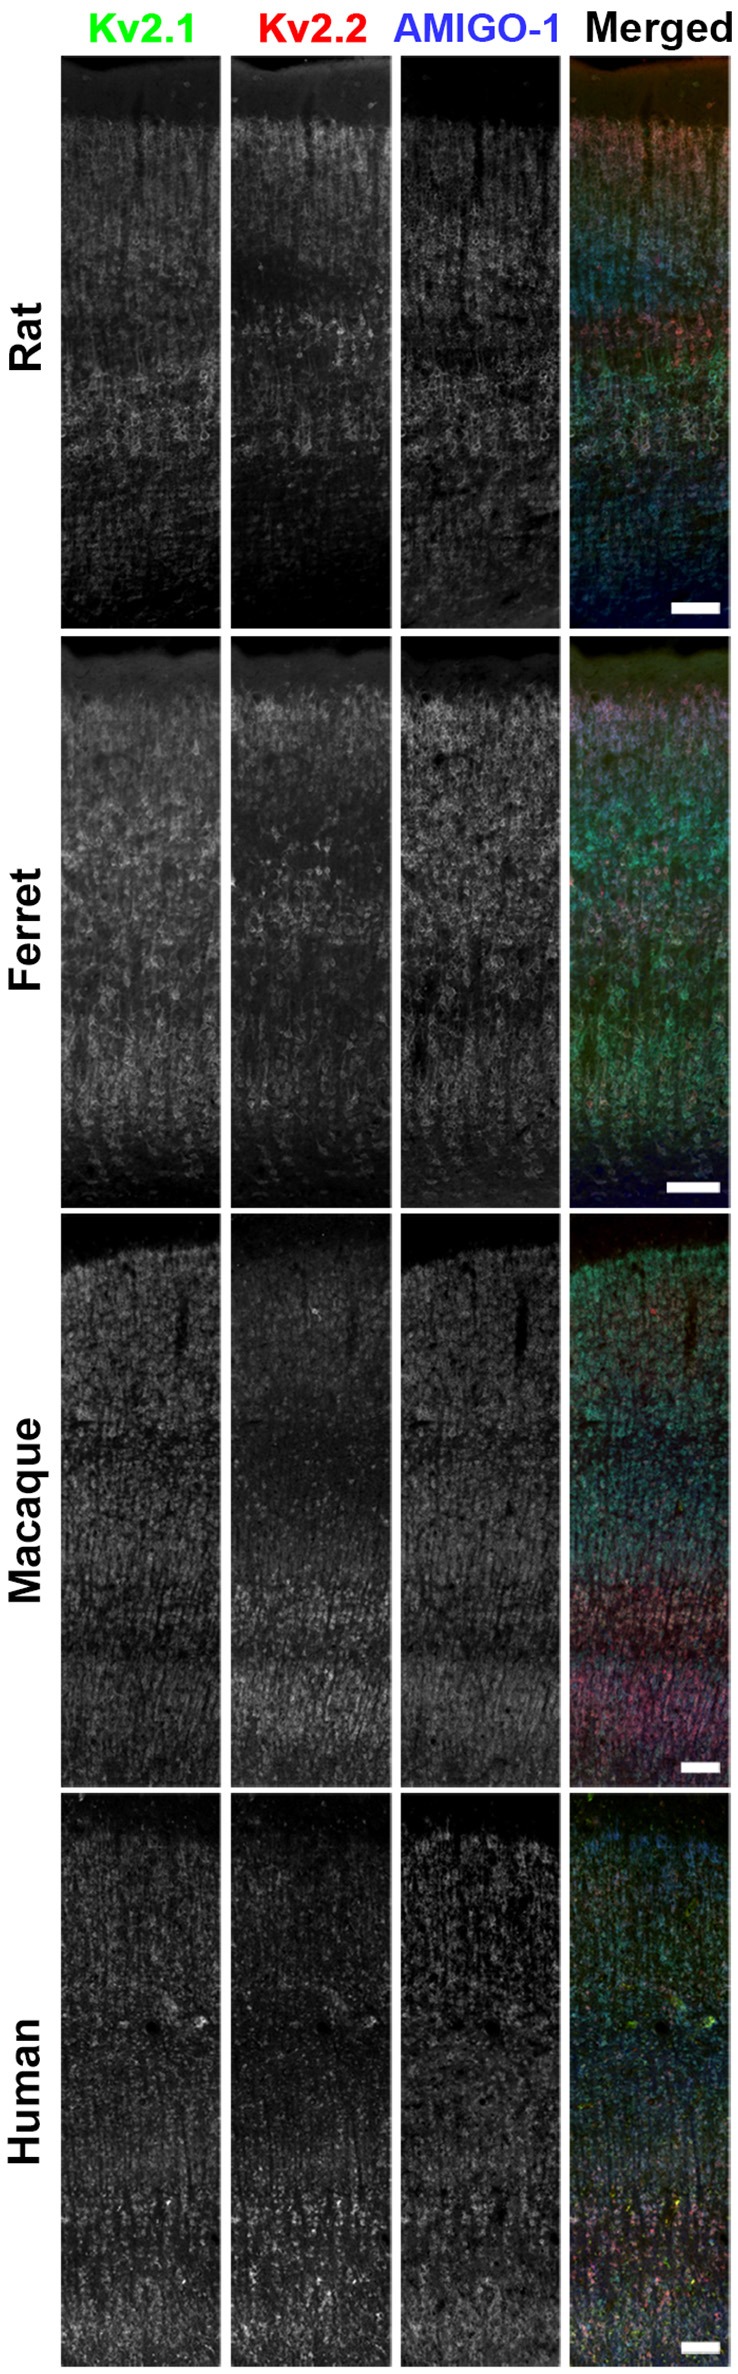
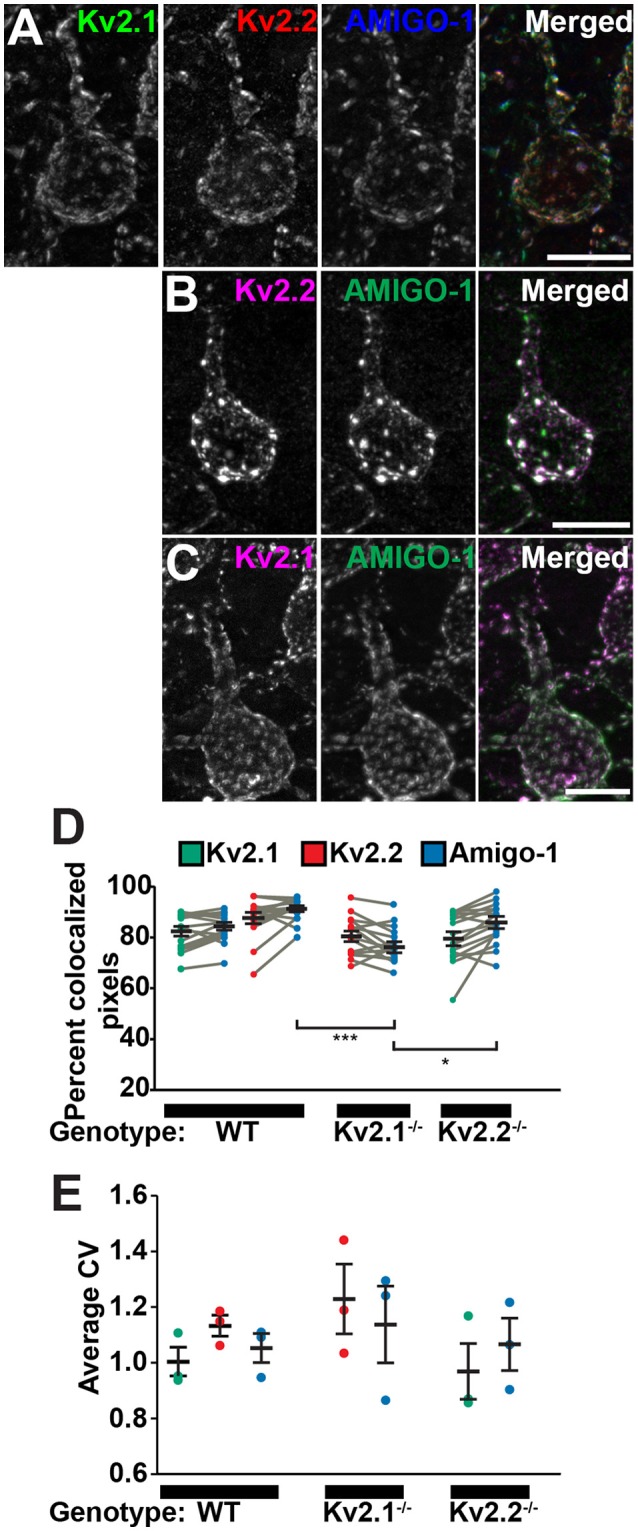
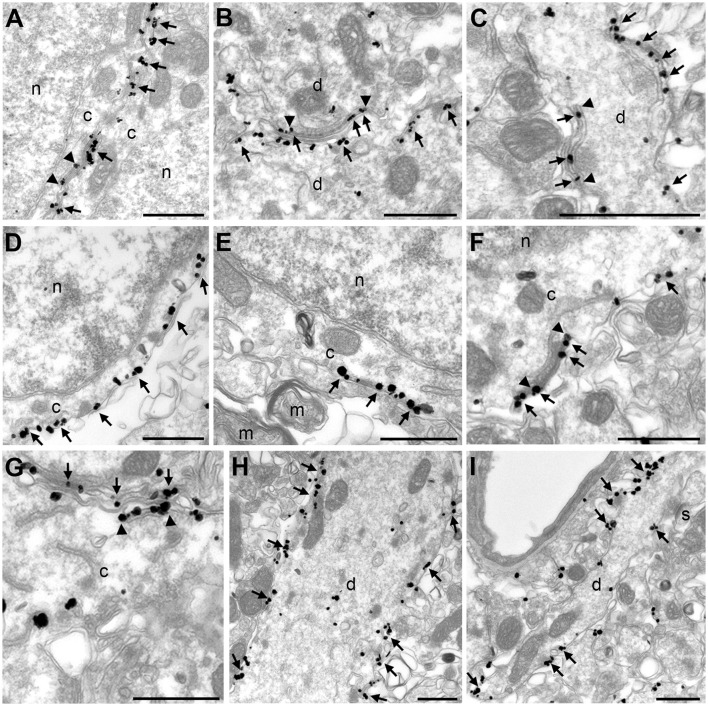
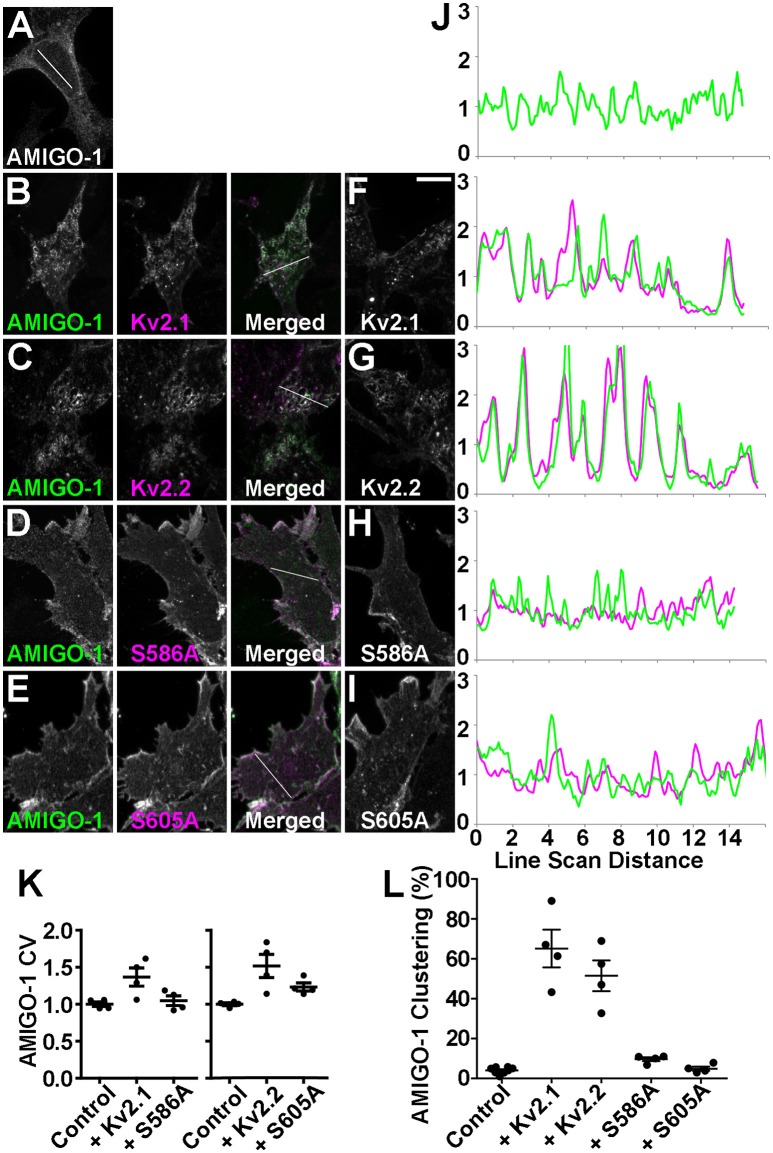
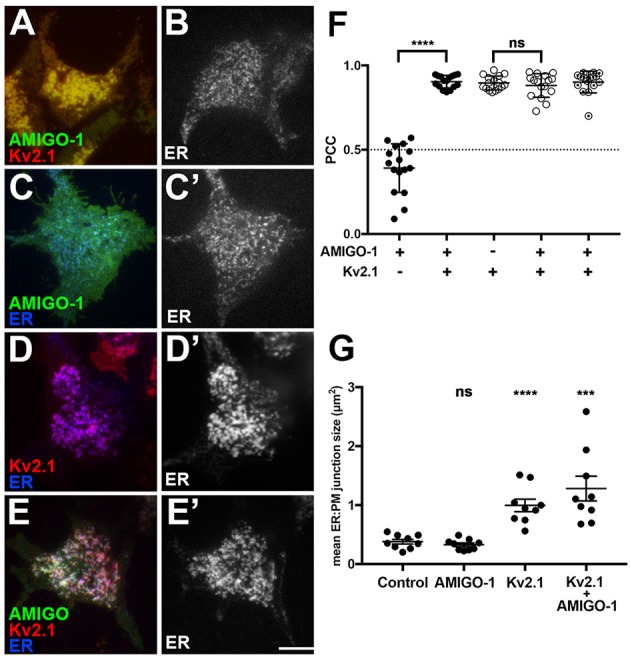
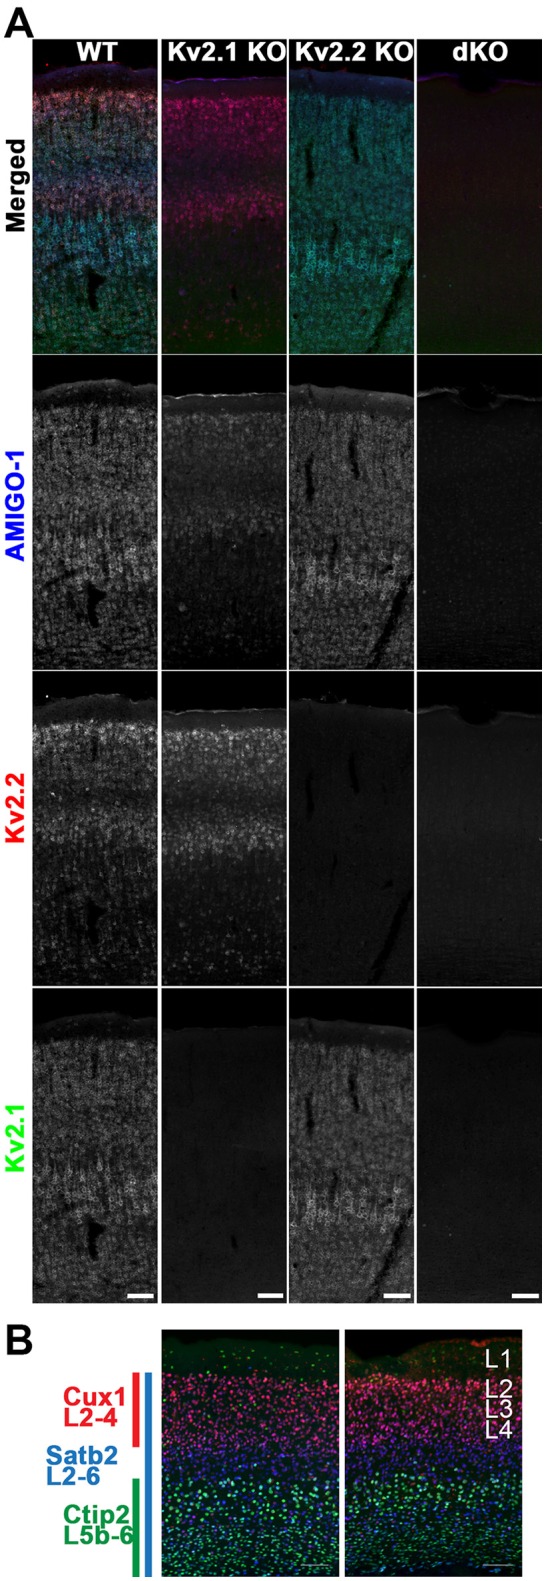
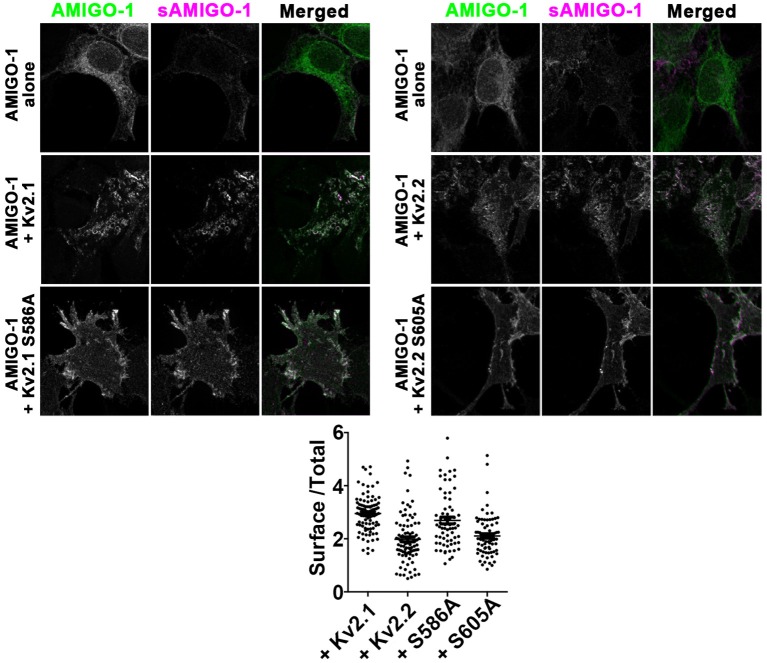
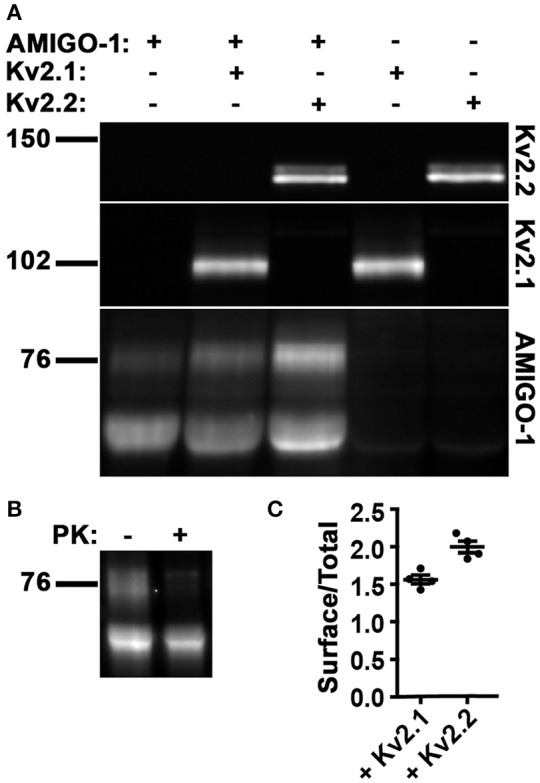
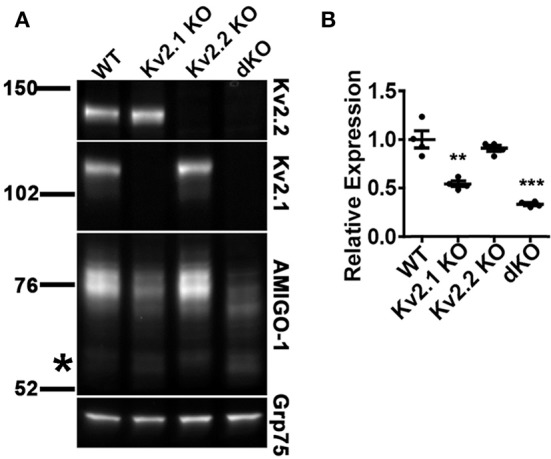
Voltage-gated K+ (Kv) channels play important roles in regulating neuronal excitability. Kv channels comprise four principal α subunits, and transmembrane and/or cytoplasmic auxiliary subunits that modify diverse aspects of channel function. AMIGO-1, which mediates homophilic cell adhesion underlying neurite outgrowth and fasciculation during development, has recently been shown to be an auxiliary subunit of adult brain Kv2.1-containing Kv channels. We show that AMIGO-1 is extensively colocalized with both Kv2.1 and its paralog Kv2.2 in brain neurons across diverse mammals, and that in adult brain, there is no apparent population of AMIGO-1 outside of that colocalized with these Kv2 α subunits. AMIGO-1 is coclustered with Kv2 α subunits at specific plasma membrane (PM) sites associated with hypolemmal subsurface cisternae at neuronal ER:PM junctions. This distinct PM clustering of AMIGO-1 is not observed in brain neurons of mice lacking Kv2 α subunit expression. Moreover, in heterologous cells, coexpression of either Kv2.1 or Kv2.2 is sufficient to drive clustering of the otherwise uniformly expressed AMIGO-1. Kv2 α subunit coexpression also increases biosynthetic intracellular trafficking and PM expression of AMIGO-1 in heterologous cells, and analyses of Kv2.1 and Kv2.2 knockout mice show selective loss of AMIGO-1 expression and localization in neurons lacking the respective Kv2 α subunit. Together, these data suggest that in mammalian brain neurons, AMIGO-1 is exclusively associated with Kv2 α subunits, and that Kv2 α subunits are obligatory in determining the correct pattern of AMIGO-1 expression, PM trafficking and clustering.

Keywords: auxiliary subunit; brain; cell adhesion molecule; immunohistochemistry; ion channel.


Figures

Figure 1
Figure 1
Validation of anti-AMIGO-1 antibodies in WT and KO mouse brain. Images of brain sections prepared from WT (Upper) and KO (Lower) mice, and immunolabeled and imaged under identical conditions. Green = anti-AMIGO-1 immunolabeling. Magenta = Hoechst 33258 nuclear dye. Antibodies used as indicated. Scale bar = 200 μm.
Figure 2
Figure 2
AMIGO-1 expression is highly colocalized with both Kv2.1 and Kv2.2 in mouse brain. (A) Sagittal section of mouse brain immunolabeled for Kv2.1 (green, K89/34 mAb), Kv2.2 (red, N372B/60 mAb), and AMIGO-1 (blue, L86/33 mAb). Caudate nucleus and putamen, CPU, Neocortex, CTX, Cornu Ammonis areas, CA1-3, dentate gyrus, DG, dorsal thalamus, dThal. Scale bar = 750 μm. (B) Immunolabeling for Kv2.1 (green), Kv2.2 (red), and AMIGO-1 (blue) in a sagittal section of mouse brain showing strong immunoreactivity of Kv2.2 and AMIGO-1 in cells of the magnocellular preoptic area (MCPO) of the hypothalamus. Scale bar = 20 μm. Separate grayscale images of individual layers for the boxed region are shown to the right. (C) Immunolabeling for Kv2.1 (green), Kv2.2 (red), and AMIGO-1 (blue) in a sagittal section of mouse brain showing strong immunoreactivity for AMIGO-1 in layer 5 somatosensory cortical neurons that differentially express Kv2.1 and Kv2.2. Scale bar = 20 μm. Separate grayscale images of individual layers are shown to the right for cells in layer 5a (c1,c2,c3) and layer 5b (c4,c5,c6). Scale bar of insets = 10 μm. (D) Immunolabeling for Kv2.1 (green), Kv2.2 (red), and AMIGO-1 (blue) in a sagittal section of mouse brain showing strong immunoreactivity for AMIGO-1 among cells of the basal forebrain that differentially express Kv2.1 and Kv2.2. Scale bar = 20 μm. Note that areas of overlap between the three fluorescent signals appear white.
Figure 3
Figure 3
AMIGO-1 is coexpressed with Kv2 α subunits in multiple species. Brain sections from rat, ferret, macaque, and human immunolabeled for Kv2.1 (green, K89/34R mAb), Kv2.2 (red, N372B/1 mAb), and AMIGO-1 (blue, L86A/37 mAb). Images were adjusted linearly for optimal display. Scale bars = 100 μm.
Figure 4
Figure 4
AMIGO-1 coclusters with Kv2.1 and Kv2.2 in neurons. High-magnification images of layer 5 pyramidal cells from S1 cortex of (A) WT mice immunolabeled for Kv2.1 (green, K89/34 mAb), Kv2.2 (red, N372B/60 mAb), and AMIGO-1 (blue, L86/33 mAb), and (B) Kv2.1 KO, and (C) Kv2.2 KO mice immunolabeled for Kv2 (magenta) and AMIGO-1 (green). Images were adjusted linearly for optimal display. Note that areas of overlap between the three fluorescent signals in (A), and the two fluorescent signals in (B,C), appear white. Scale bars = 10 μm. (D) Summary graph of MCC values measured for Kv2.1 (green) and Kv2.2 (red) and AMIGO-1 (blue) in cortical cells from WT, Kv2.1-KO and Kv2.2-KO animals (n = 16 cells each). Gray bars connect MCC values for Kv2 and AMIGO-1 from the same neuron. Error bars denote mean and SEM for each group. Differences in MCC values were evaluated by one-way ANOVA followed by Sidak's multiple-comparison test. ***p = 3.38 × 10⁻⁶, *p = 0.0102. (E) Summary graph of CV measurements of cortical cells from WT, Kv2.1-KO and Kv2.2-KO mice immunolabeled for Kv2.1, Kv2.2 and AMIGO-1. Error bars represent the SEM for n = 3 groups. Differences in CV measurements between immunosignals were evaluated by one-way randomized block ANOVA followed by Sidak's multiple-comparison test. The p values for these pairwise comparisons of CV values were: Kv2.1 vs. Kv2.2 in WT: p = 0.554, Kv2.1 vs. AMIGO-1 in WT: p = 0.9605, Kv2.2 vs. AMIGO-1 in WT: p = 0.218, Kv2.2 vs. AMIGO-1 in Kv2.1−/−: p = 0.8672, Kv2.1 vs. AMIGO-1 in Kv2.2−/−: p = 0.9785. Note that the y-axis origin begins at 0.6.
Figure 5
Figure 5
Kv2.1 and AMIGO-1 exhibit similar localization pattern at the ultrastructural level. Electron micrographs show the clustered localization of Kv2.1 immunogold particles (arrows) in the soma (A) and dendrite (B,C). A vast majority of immunogold particles are PM associated. Similar to the localization of Kv2.1 shown here, and previous reports on Kv2.1 localization in rat (Du et al., 1998) and mouse (Mandikian et al., 2014), and Kv2.2 localization in mouse (Bishop et al., 2015), AMIGO-1 immunogold particles also show distinct clustering at the PM of the somata (D–G) and dendrites (H). Immunogold particles are observed both in the large-caliber apical dendritic shaft (H) and the small-caliber oblique apical dendrites (I). Noteworthy, both Kv2.1 and AMIGO-1 immunogold particles locate to the edges of subsurface cisternae (arrowheads in A–C for Kv2.1 and F–G for AMIGO). Note the lack of AMIGO-1 immunogold particles in myelinated axon and dendritic spines. c, cytoplasm; d, dendritic shaft; m, myelinated axon, n, nucleus, s, dendritic spine. Scale bars: 500 nm.
Figure 6
Figure 6
Kv2 α subunits promote clustering of AMIGO-1. HEK293 cells expressing (A) AMIGO-1 (green) alone, (B) AMIGO-1 (green) and Kv2.1 (magenta), (C) AMIGO-1 (green) and Kv2.2 (magenta), (D) AMIGO-1 (green) and S586A (magenta), and (E) AMIGO-1 (green) and S605A (magenta). Images were adjusted linearly for optimal display. Scale bar = 10 μm. HEK293 cells expressing (F) Kv2.1, (G) Kv2.2, (H) S586A, and (I) S605A alone. (J) AMIGO-1 (green) and Kv2 (magenta) fluorescence intensity values across individual line scans depicted by the white lines in the AMIGO-1 image in (A), and the merged images in (B–E). Note that areas of overlap between the two fluorescent signals appear white. (K) Coefficient of variation (CV) of AMIGO-1 fluorescence intensity in HEK293 cells expressing AMIGO-1 with the indicated Kv2 α subunit, relative to AMIGO-1 alone. Values are normalized to control. Data are the mean ± SEM from n = 4 independent samples of at least 14 cells each. The p values for these pairwise comparisons of CV values vs. cells expressing AMIGO-1 alone are: AMIGO-1 + Kv2.1: 0.0270, AMIGO-1 + S586A: 0.5366, AMIGO-1 + Kv2.2: 0.0167, AMIGO-1 + S605A: 0.0066. (L) HEK293 cells coexpressing AMIGO-1 with the indicated Kv2 α subunit were scored as having either clustered or unclustered AMIGO-1. Cells with over 25% of their membrane covered in clusters were considered clustered. Data are from an n = 4 independent samples of at least 100 cells each. The p values for these pairwise comparisons of clustering vs. cells expressing AMIGO-1 alone are: AMIGO-1 + Kv2.1: 2.345 × 10⁻⁶, AMIGO-1 + Kv2.2: 3.909 × 10⁻⁶, AMIGO-1 + S586A: 0.0004, AMIGO-1 + S605A: 0.4584. For other pairwise comparisons of clustering: AMIGO-1 + Kv2.1 vs. AMIGO-1 + S586A: p = 0.0011, AMIGO-1 + Kv2.2 vs. AMIGO-1 + S605A: p = 0.0010.
Figure 7
Figure 7
Kv2.1:AMIGO-1 complexes are present at and recruit/stabilize ER:PM junctions. Live cell TIRF imaging. (A) Cell expressing YFP-AMIGO-1 (green) and DsRed-Kv2.1 (red). (B) Untransfected cell showing ER (SEC61β) labeling. (C) Cell expressing YFP-AMIGO-1 (green) showing ER (SEC61β, blue) labeling. (C) ER (SEC61β) labeling of cell in (C). (D): Cell expressing DsRed-Kv2.1 (red) showing ER (SEC61β, blue) labeling. (D): ER (SEC61β) labeling of cell in (D). (E) Cell expressing YFP-AMIGO-1 (green) and DsRed-Kv2.1 (red) showing ER (SEC61β, blue) labeling. (E) ER (SEC61β) labeling of cell in panel E. Note that areas of overlap between the three fluorescent signals appear white. Scale bar = 10 μm. (F) Graph of Pearson's Colocalization Coefficient (PCC) values for SEC61β and AMIGO-1 (filled circles), or SEC61β and Kv2.1 (open circles). Partially filled circles are PCC values for AMIGO-1 and Kv2.1. Bars are the mean ± SEM. ****p = 1.62 × 10⁻¹⁴. ns: p = 0.4798. (G) Mean ER:PM junction size (in μm2) for cells expressing SEC61β ER marker alone, or with AMIGO-1 and/or Kv2.1 as indicated. Bars are the mean ± SEM. ns: p = 0.3119. ****p = 5.275 × 10⁻⁵. ***p = 6.463 × 10⁻⁴.
Figure 8
Figure 8
Mice lacking Kv2 α subunits have altered AMIGO-1 expression. (A) Mouse sagittal brain sections from WT, Kv2.1 KO, Kv2.2 KO, and Kv2 dKO mice immunolabeled for AMIGO-1 (blue, AMIGO-1 pAb), Kv2.2 (red, N372B/60 mAb), and Kv2.1 (green, K89/34 mAb). Note the lack of AMIGO-1 labeling present in the Kv2 double KO mice. Scale bar = 100 μm. (B) Sagittal brain sections from WT and Kv2 dKO mice immunolabeled for cortical layer markers Cux1 (red), Satb2 (blue), and Ctip2 (green). Cortices of dKO mice show no gross abnormalities in cortical laminae or cell density. Scale bar = 100 μm. Note that areas of overlap between the three fluorescent signals appear white.
Figure 9
Figure 9
Kv2 α subunits increase AMIGO-1 cell surface localization in heterologous cells. HEK293 cells expressing AMIGO-1 alone, or AMIGO-1 plus WT Kv2.1 or Kv2.2, or the respective clustering deficient mutants Kv2.1 S586A or Kv2.2 S605A, as indicated. Cells were immunolabeled for total AMIGO-1 (green) and cell surface AMIGO-1 (magenta). All images within the left and right panels were acquired under identical conditions and were linearly adjusted identically. Note that areas of overlap between the two fluorescent signals appear white. Scale bar = 10 μm. The graph shows the ratio of cell surface: total AMIGO-1 fluorescence intensity measured in HEK293 cells expressing AMIGO-1 alone or with the indicated Kv2 α subunits. Values are normalized to cells expressing AMIGO- alone. Data are the mean ± SEM from 4 independent samples of at least n = 67 cells total. The p values (two-tailed unpaired t-test) for surface/total AMIGO-1 levels relative to AMIGO-1 alone: AMIGO-1 + Kv2.1: 2.192 × 10−37, AMIGO-1 + S586A: 4.681 × 10⁻²⁰, AMIGO-1 + Kv2.2: 8.240 × 10⁻¹³, AMIGO-1 alone vs. AMIGO-1 + S605A: 9.921 × 10⁻¹⁷.
Figure 10
Figure 10
Kv2 α subunits increase cell surface expression of AMIGO-1. (A) Representative immunoblot of HEK293 cell lysates expressing AMIGO-1, AMIGO-1 + Kv2.1, AMIGO-1 + Kv2.2, Kv2.1, or Kv2.2. Numbers to the left of immunoblots indicate the mobility of molecular mass standards in kD. See Figure S1 for original immunoblot. (B) Representative immunoblot of AMIGO-1 expressing HEK293 cells treated with or without proteinase K (PK). Numbers to the left of the immunoblots indicate the mobility of molecular mass standards in kD. See Figure S2 for original immunoblot. (C) The ratio of the intensity of AMIGO-1 cell surface (top band) to total (sum of top and bottom bands) was measured in HEK293 cells expressing AMIGO-1 alone (control), AMIGO-1 with Kv2.1 (white bar), or AMIGO-1 with Kv2.2 (black bar). Values are normalized to control. Data are the mean ± SEM from n = 4 independent samples. The p (two-tailed unpaired t-test) for surface/total AMIGO-1 levels relative to AMIGO-1 alone: AMIGO-1 + Kv2.1: 0.0003, AMIGO-1 + Kv2.2: 2.6111 × 10⁻⁵.
Figure 11
Figure 11
AMIGO-1 cell surface expression is preferentially decreased in mice lacking Kv2 α subunits. (A) Representative immunoblot of crude whole brain homogenates from WT, Kv2.1 KO, Kv2.2 KO, and Kv2 double KO mice. Immunoblots were probed with mAbs against Kv2.1 (K89/34 mAb), Kv2.2 (N372B/60 mAb), AMIGO-1 (AMIGO-1 pAb), and Grp75 (N52A/42 mAb) as a loading control. Note that AMIGO-1 signal in higher Mr bands is substantially reduced in both Kv2.1 KO and Kv2 dKO as compared to WT. Numbers to the left of the immunoblots indicate the mobility of molecular mass standards in kD. The asterisk to left of the AMIGO-1 panel shows approximate location AMIGO-1 population of Mr = 66 kD. See Figure S3 for original immunoblot. (B) Summary graph of differences in AMIGO-1 protein levels between WT and KO mice. Fluorescence intensity values were normalized to the loading control (Grp75) and then expressed relative to the total WT signal. Data are the mean ± SEM from n = 4 mice per group. Differences in AMIGO-1 expression between WT and Kv2.1 KO as well as WT and Kv2 dKO were statistically significant as evaluated by independent t-test (Kv2.1 KO, p = 0.002; Kv2.2 KO, p = 0.36; Kv2 dKO, p = 0.004).

References

    1. Alberts B., Johnson A., Lewis J., Morgan D., Raff M., Roberts K., et al. (2014). Molecular Biology of the Cell. New York, NY: Garland Science.
    1. Antonucci D. E., Lim S. T., Vassanelli S., Trimmer J. S. (2001). Dynamic localization and clustering of dendritic Kv2.1 voltage-dependent potassium channels in developing hippocampal neurons. Neuroscience 108, 69–81. 10.1016/S0306-4522(01)00476-6 - DOI - PubMed
    1. Bekele-Arcuri Z., Matos M. F., Manganas L., Strassle B. W., Monaghan M. M., Rhodes K. J., et al. . (1996). Generation and characterization of subtype-specific monoclonal antibodies to K+ channel alpha- and beta-subunit polypeptides. Neuropharmacology 35, 851–865. 10.1016/0028-3908(96)00128-1 - DOI - PubMed
    1. Bishop H. I., Guan D., Bocksteins E., Parajuli L. K., Murray K. D., Cobb M. M., et al. . (2015). Distinct cell- and layer-specific expression patterns and independent regulation of Kv2 channel subtypes in cortical pyramidal neurons. J. Neurosci. 35, 14922–14942. 10.1523/JNEUROSCI.1897-15.2015 - DOI - PMC - PubMed
    1. Chen Y., Hor H. H., Tang B. L. (2012). AMIGO is expressed in multiple brain cell types and may regulate dendritic growth and neuronal survival. J. Cell. Physiol. 227, 2217–2229. 10.1002/jcp.22958 - DOI - PubMed