. 2018 Jan 19:12:5.
doi: 10.3389/fncel.2018.00005. eCollection 2018.

Horizontal Synchronization of Neuronal Activity in the Barrel Cortex of the Neonatal Rat by Spindle-Burst Oscillations

Affiliations

Horizontal Synchronization of Neuronal Activity in the Barrel Cortex of the Neonatal Rat by Spindle-Burst Oscillations

Dmitrii Suchkov et al. Front Cell Neurosci. .

Abstract

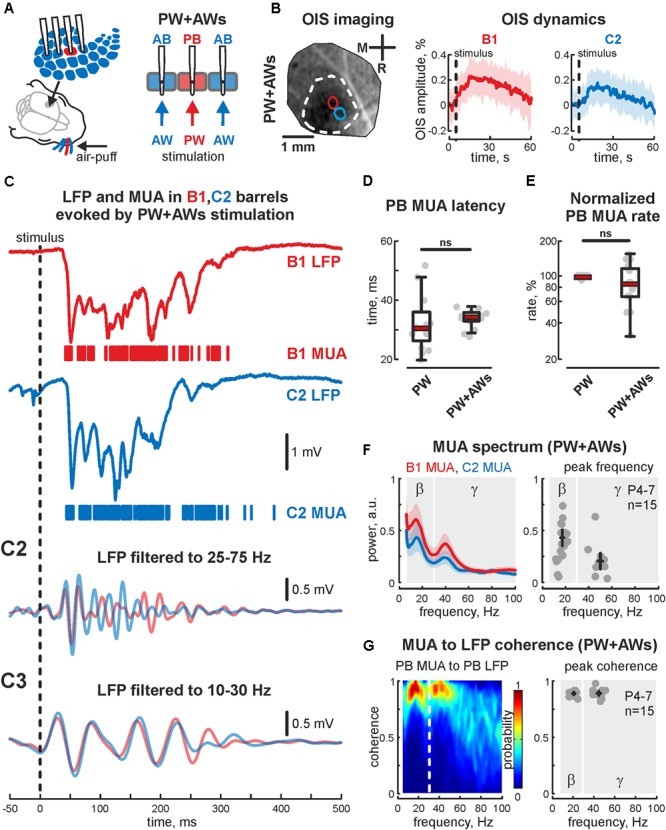
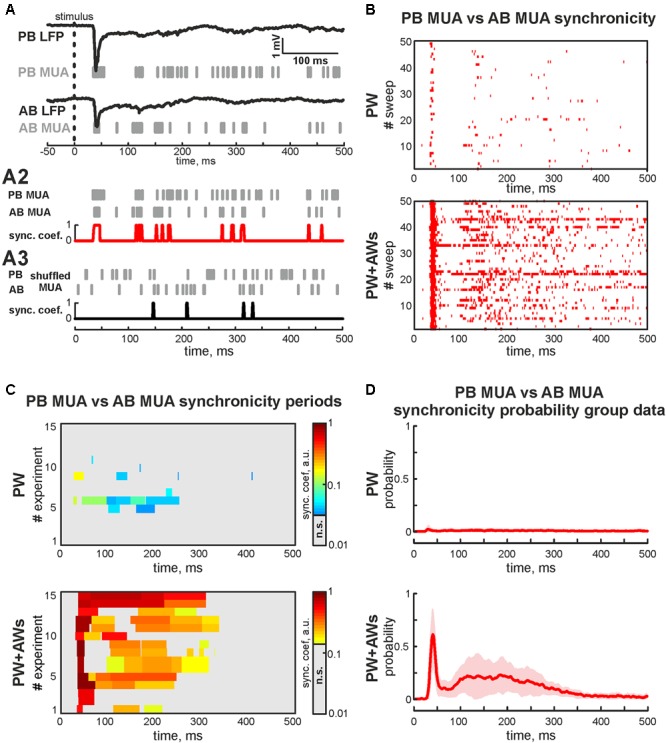
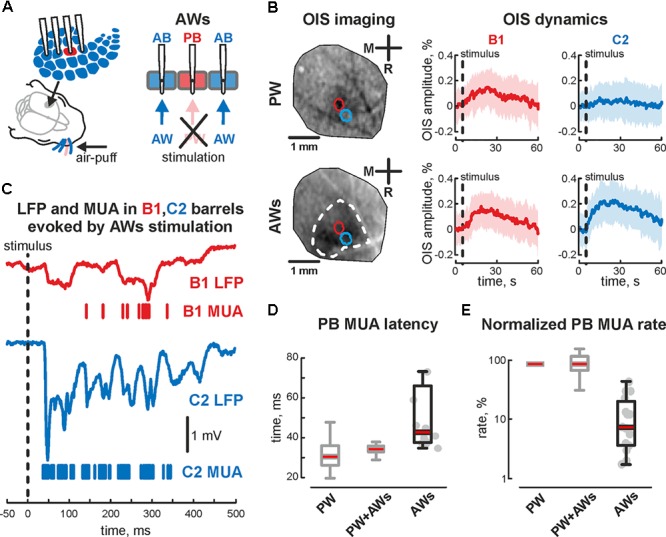
During development, activity in the somatosensory cortex is characterized by intermittent oscillatory bursts at gamma (early gamma-oscillations, EGOs) and alpha-beta (spindle-bursts, SBs) frequencies. Here, we explored the topography of EGOs and SBs in the neighbor barrels of the whisker-related barrel cortex of neonatal rats (P4-7) during responses evoked by simultaneous activation of multiple whiskers as it occurs during natural conditions. We found that brief simultaneous deflection of all whiskers evoked complex neuronal responses comprised of EGOs and SBs. In contrast to EGOs, that specifically synchronized neuronal activity in each individual barrel, SBs efficiently synchronized activity between neighboring barrels. After plucking a single whisker, synchronous stimulation of spared whiskers evoked EGO-lacking responses in the whisker-deprived barrel, even though the remaining neuronal activity was synchronized by SBs in neighboring barrels. Thus, EGOs specifically support topographic synchronization of neuronal activity within barrels, whereas SBs support horizontal synchronization between neighboring barrels during stimulation of multiple whiskers. We suggest that these two co-existing activity patterns coordinate activity-dependent formation of topographic maps and support the emergence of integrative functions in the primary somatosensory cortex during the critical period of somatosensory maps development.

Keywords: barrel cortex; development; early gamma oscillation; immature cortical activity; neonatal rat; spindle-burst.


Figures

FIGURE 1
FIGURE 1
Cortical responses from the neonatal rat barrel system evoked by PW+AWs stimulation. (A) Scheme of the experimental setup with multishank recordings of the evoked activity from barrels receiving sensory input during all whiskers stimulation (PW+AWs), the PB with corresponding PW are shown by red, the neighboring ABs are blue. Note, that during ‘PW+AWs’ stimulation all barrels received the sensory input from their whiskers. (B) OISs evoked in barrel cortex (left) and OIS dynamics in B1 (red) and C2 (blue) barrels (right) are shown. Confidence interval (CI) is shown by the shaded area. (C) Evoked LFP (trace) and MUA (bars) recorded in B1 (red) and C2 (blue) barrels. Bandpass filtered B1 and C2 LFPs in beta (C2) and gamma (C3) frequency ranges. Latency time (D) and normalized rate (E) for MUA, recorded in PB during ‘PW’ and ‘PW+AWs’ stimulation types. On each box the central mark indicates the median, and the bottom and top edges of the box indicate the 25th and 75th percentiles, respectively. The whiskers extend to the most extreme data points not considered outliers. (F) Power spectral density for evoked MUA recorded in B1 (red) and C2 (blue) barrels of the experiment shown on (C) (left plot). CI is shown by the shaded area. Group data of the MUA spectral peaks detected in beta and gamma frequency ranges in the recorded barrels, receiving sensory input during ‘PW+AWs’ simulation (right plot). Detected peaks in the beta and gamma frequency ranges of single experiments are shown by circles, whereas mean values and CI for phase and frequency distributions are shown by black crossed lines; (G) MUA to LFP coherence for the B1 and C2 barrels for the experiment shown on (C) (left), and group data for MUA to LFP coherence peaks in beta and gamma frequency ranges in the recorded barrels, receiving sensory input during ‘PW+AWs’ simulation (right). Detected peaks in the beta and gamma frequency ranges of single experiments are shown by circles, whereas mean values and CI for coherence and frequency distributions are shown by black crossed lines.
FIGURE 2
FIGURE 2
Phase-lock analysis of evoked MUA to LFP in the neonatal rat barrel cortex. (A) Evoked LFP (trace) and MUA (bars) recorded in PB following the ‘PW’ stimulation; (A2) wavelet filtered LFP (Morlet mother wavelet with scale coefficient equal to 20 Hz) and (A3) LFP phases (calculated using Hilbert transform) are shown. Red vertical lines correspond to phase 0 (LFP trough). (A4) Simultaneously recorded AB LFP (gray trace) and corresponded AB MUA (gray bars). (A5)3D plot of PB MUA (left) and AB MUA (right) phase lock to PB wavelet filtered LFP during ‘PW’ stimulation. Shaded surfaces correspond to significance threshold. (B) Group data of PB (left column) and AB MUA (right column) phase locks to PB wavelet filtered LFP during ‘PW’ (upper row) and ‘PW+AWs’ (lower row) types of stimulation. Detected peaks in the beta and gamma frequency ranges of single experiments are shown by circles, whereas mean values and CI for phase and frequency distributions are shown by black crossed lines; (C) group data of resultant vector lengths for PB MUA phase lock to PB LFP at different frequencies during ‘PW’ (red) and ‘PW+AWs’ (blue) types of stimulation. Resultant vector length for cross phase lock of PB MUA to AB LFP at different frequencies during ‘PW+AWs’ stimulation is shown by green color. CI is shown by the shaded area.
FIGURE 3
FIGURE 3
Synchronicity analysis of MUA in adjacent barrels. (A) Evoked LFPs (trace) and MUA (bars) recorded in PB and AB during the ‘PW+AWs’ stimulation; (A2) evoked MUA (bars) from PB and AB used for calculation of the synchronicity. Result of the synchronicity analysis is shown by red trace; (A3) shuffled MUA (bars) from PB and AB used for calculation of the threshold of synchronicity significance (black trace); (B) post-stimulus time histogram of the synchronous events (red dots) between PB MUA and AB MUA during ‘PW’ (upper box) and ‘PW+AWs’ (lower box) types of stimulation (50 sweep’s analysis is shown). (C) Group data of synchronicity analysis between PB MUA and AB MUA for 15 experiments during ‘PW’ (upper box) and ‘PW+AWs’ (lower box) types of stimulation. Synchronicity probability is coded by color. (D) Averaged synchronicity probability between PB MUA and AB MUA in the 500 ms window during ‘PW’ (upper plot) or ‘PW+AWs’ (lower plot) types of stimulation. CI is shown by the shaded area.
FIGURE 4
FIGURE 4
Evoked cortical activity in the sensory deprived barrel during ‘AWs’ stimulation. (A) Scheme of the experimental setup with evoked activity recordings from barrel cortex during ‘AWs’ (all except one) whisker stimulation. Note, that PW was pulled out or covered before the experiment. (B) OIS imaging during ‘PW’ (upper image) and ‘AWs’ (lower image) types of stimulation. The OIS dynamics in B1 and C2 barrels, during the B1 – ‘PW’ stimulation (upper row) and during the ‘AWs’ (following the sensory deprivation of B1 barrel, lower row) are shown. CI is shown by the shaded area. (C) Evoked LFP (trace) and MUA (bars) recorded in B1 (red) and C2 (blue) barrels during ‘AWs’ stimulation. Time latency (D) and normalized MUA rate (E) recorded in PB during ‘PW,’ ‘PW+AWs,’ and ‘AWs’ types of stimulation. On each box the central mark indicates the median, and the bottom and top edges of the box indicate the 25th and 75th percentiles, respectively. The whiskers extend to the most extreme data points not considered outliers. B1 barrel is sensory deprived. Gray colored boxplots correspond to the data already shown on Figure 1.
FIGURE 5
FIGURE 5
Cross analysis of the cortical activity in sensory deprived and intact barrels during ‘AWs’ stimulation. (A) PB MUA to AB LFP coherence (for the experiment presented in Figure 4C) is shown on the left. Group data of peak values of the PB MUA to AB LFP coherence in the beta and gamma frequency ranges shown on the right. Detected peaks in the beta and gamma frequency ranges of single experiments are shown by circles, whereas mean values and CI for coherence and frequency distributions are shown by black crossed lines. Note, significantly detectable peaks in the gamma frequency range are absent. (B) Phase distribution of PB MUA to AB LFP for experiment shown in Figure 4C. The region with significant PB MUA to AB LFP phase locks is circled with a white contour (left plot). Group data of PB MUA to AB LFP phase lock peaks is shown on the right. Detected peaks in the beta and gamma frequency ranges of single experiments are shown by circles, whereas mean values and CI for phase and frequency distributions are shown by black crossed lines. (C) Group data of resultant vector lengths for cross phase lock of PB MUA to AB LFP at different frequencies during ‘AWs’ (violet) stimulation. Resultant vector lengths of PB MUA to PB LFP at different frequencies during ‘PW’ (pink), ‘PW+AWs’ (light blue) are shown for comparison (they were already shown in Figure 2C). CI is shown by the shaded area. (D) Post-stimulus time histogram of the synchronous events (red dots) between PB MUA and AB MUA during ‘AWs’ type of stimulation (50 sweep’s analysis is shown). (E) Group data of synchronicity analysis between PB MUA and AB MUA for 15 experiments using ‘AWs’ type of stimulation. Synchronicity probability is coded by color. (F) Averaged synchronicity probability between PB MUA and AB MUA in the 500 ms window triggered by the ‘AWs’ stimulation. CI is shown by the shaded area.

Similar articles

Cited by

References

    1. Ackman J. B., Crair M. C. (2014). Role of emergent neural activity in visual map development. Curr. Opin. Neurobiol. 24 166–175. 10.1016/j.conb.2013.11.011 - DOI - PMC - PubMed
    1. Akhmetshina D., Nasretdinov A., Zakharov A., Valeeva G., Khazipov R. (2016). The nature of the sensory input to the neonatal rat barrel cortex. J. Neurosci. 36 9922–9932. 10.1523/JNEUROSCI.1781-16.2016 - DOI - PMC - PubMed
    1. An S., Kilb W., Luhmann H. J. (2014). Sensory-evoked and spontaneous gamma and spindle bursts in neonatal rat motor cortex. J. Neurosci. 34 10870–10883. 10.1523/JNEUROSCI.4539-13.2014 - DOI - PMC - PubMed
    1. Bastos A. M., Vezoli J., Bosman C. A., Schoffelen J.-M., Oostenveld R., Dowdall J. R., et al. (2015). Visual areas exert feedforward and feedback influences through distinct frequency channels. Neuron 85 390–401. 10.1016/j.neuron.2014.12.018 - DOI - PubMed
    1. Bokil H., Andrews P., Kulkarni J. E., Mehta S., Mitra P. P. (2010). Chronux: a platform for analyzing neural signals. J. Neurosci. Methods 192 146–151. 10.1016/j.jneumeth.2010.06.020 - DOI - PMC - PubMed

LinkOut - more resources