

The Aspergillus fumigatus Sialidase (Kdnase) Contributes to Cell Wall Integrity and Virulence in Amphotericin B-Treated Mice
- PMID: 29403452
- PMCID: PMC5778107
- DOI: 10.3389/fmicb.2017.02706
The Aspergillus fumigatus Sialidase (Kdnase) Contributes to Cell Wall Integrity and Virulence in Amphotericin B-Treated Mice
Abstract
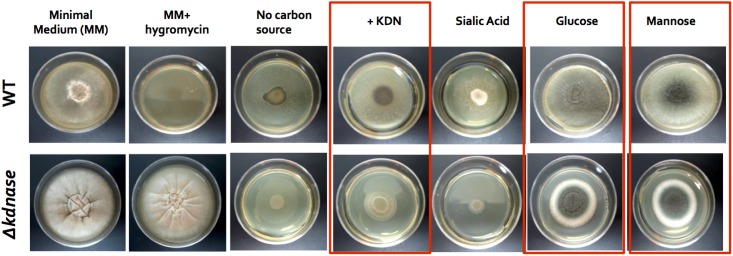
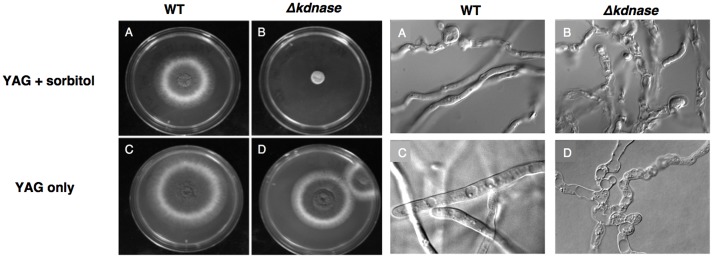
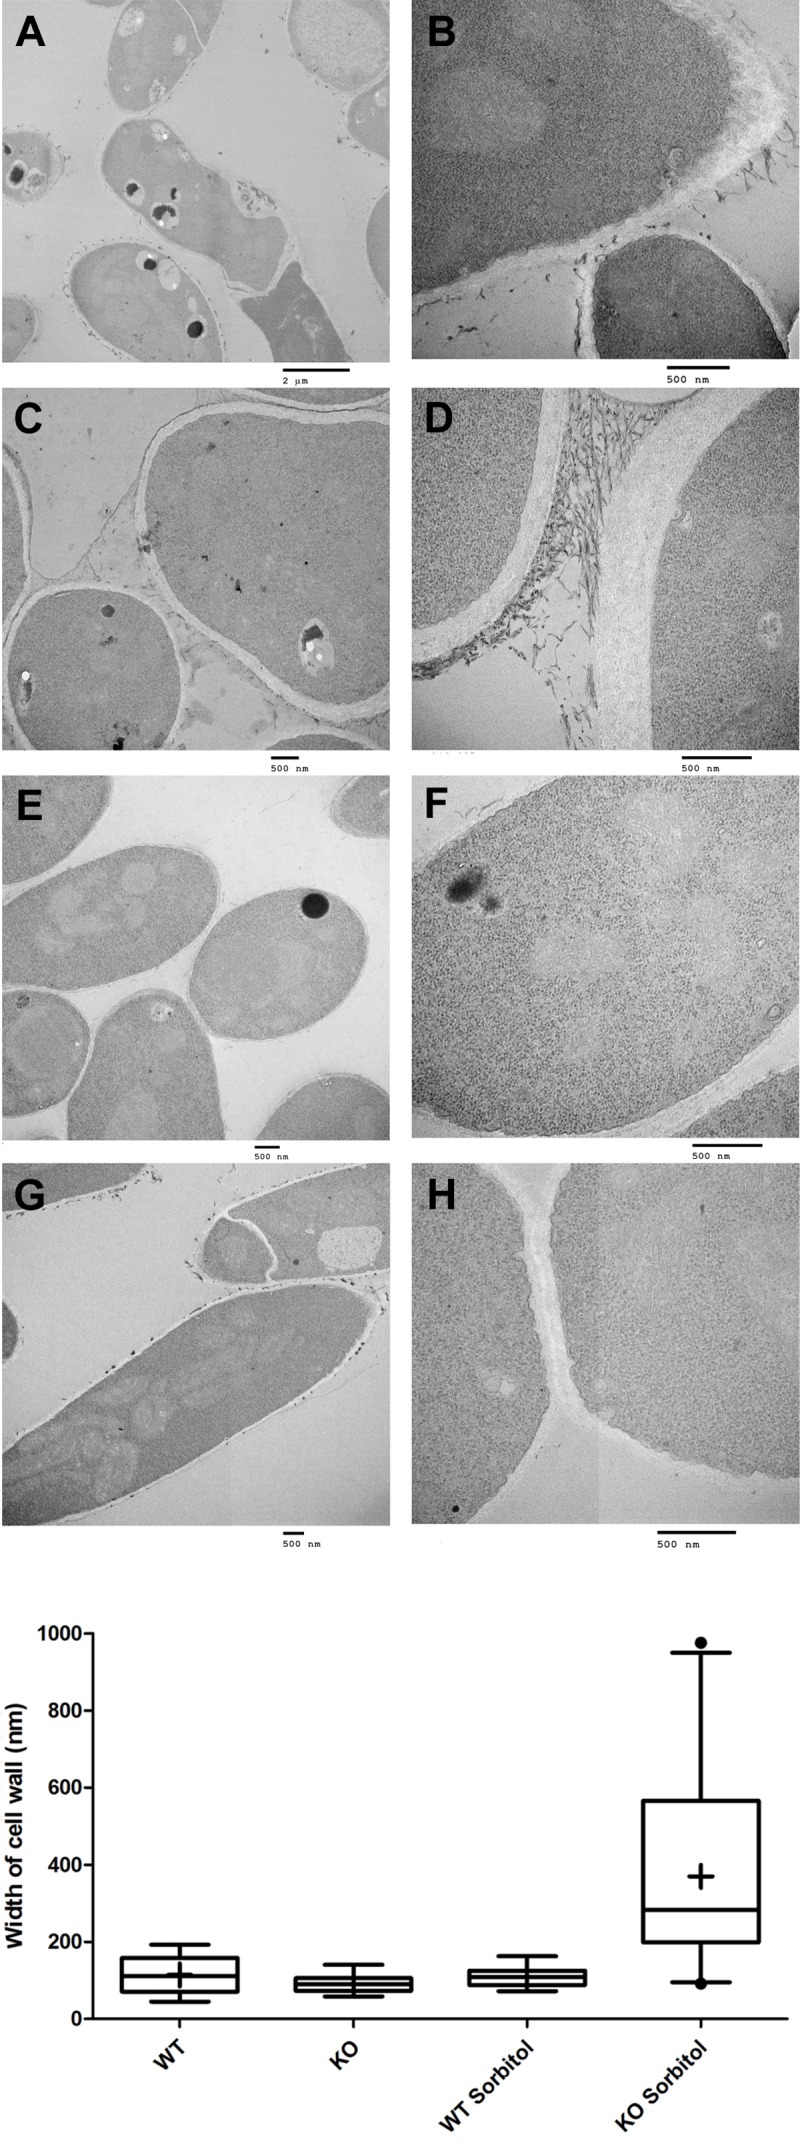
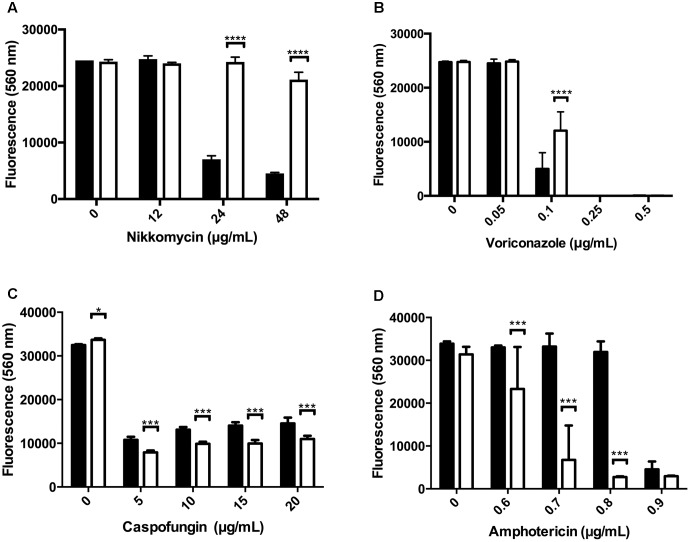
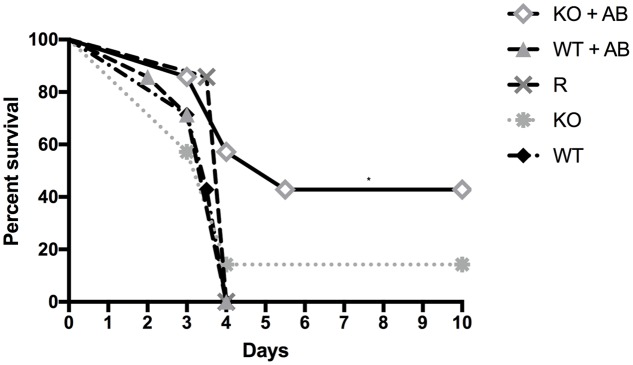
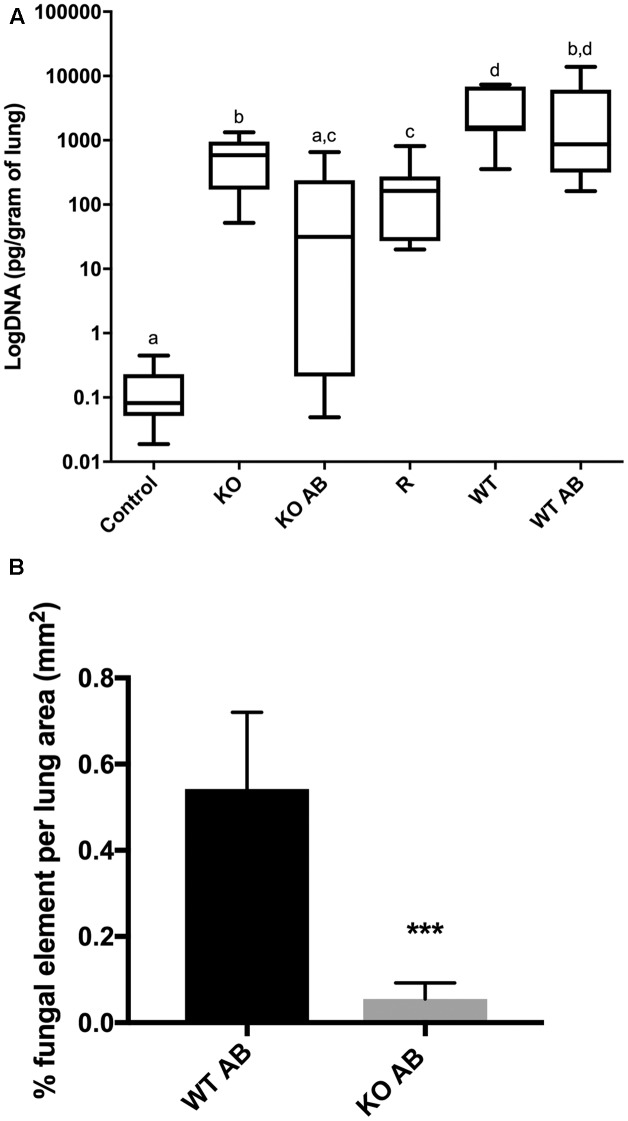
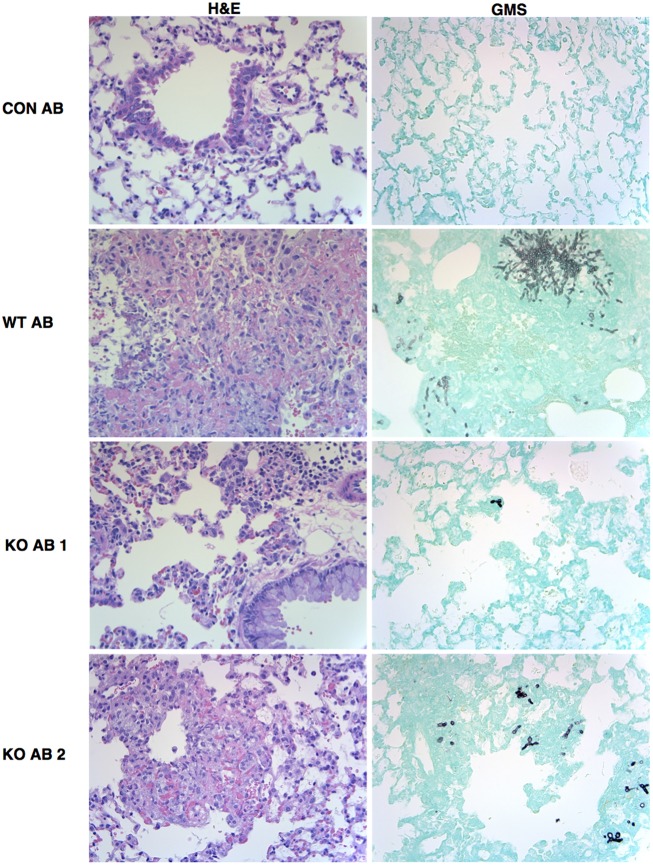
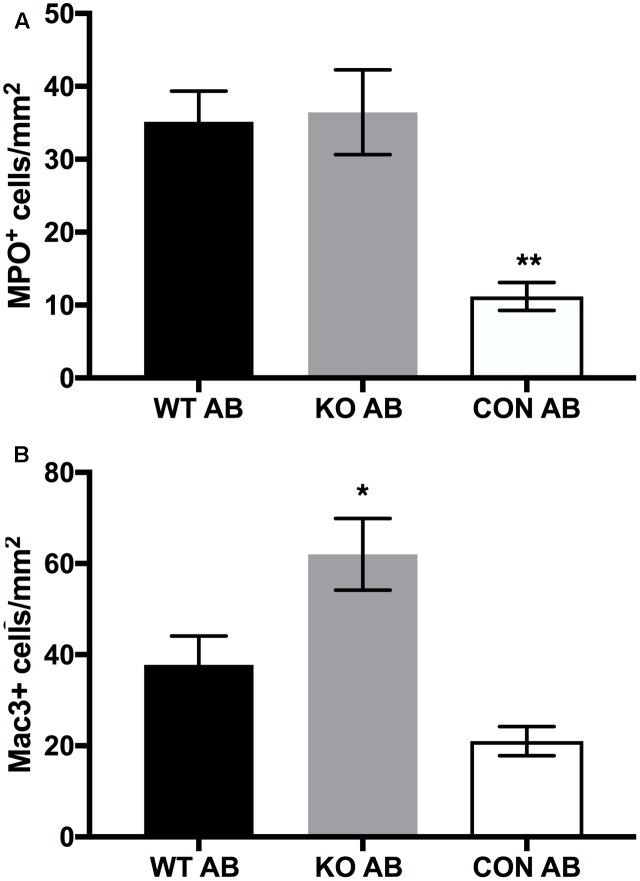
Aspergillus fumigatus is a filamentous fungus that can cause a life-threatening invasive pulmonary aspergillosis (IPA) in immunocompromised individuals. We previously characterized an exo-sialidase from A. fumigatus that prefers the sialic acid substrate, 2-keto-3-deoxy-D-glycero-D-galacto-nononic acid (Kdn); hence it is a Kdnase. Sialidases are known virulence factors in other pathogens; therefore, the goal of our study was to evaluate the importance of Kdnase in A. fumigatus. A kdnase knockout strain (Δkdnase) was unable to grow on medium containing Kdn and displayed reduced growth and abnormal morphology. Δkdnase was more sensitive than wild type to hyperosmotic conditions and the antifungal agent, amphotericin B. In contrast, Δkdnase had increased resistance to nikkomycin, Congo Red and Calcofluor White indicating activation of compensatory cell wall chitin deposition. Increased cell wall thickness and chitin content in Δkdnase were confirmed by electron and immunofluorescence microscopy. In a neutropenic mouse model of invasive aspergillosis, the Δkdnase strain had attenuated virulence and a significantly lower lung fungal burden but only in animals that received liposomal amphotericin B after spore exposure. Macrophage numbers were almost twofold higher in lung sections from mice that received the Δkdnase strain, possibly related to higher survival of macrophages that internalized the Δkdnase conidia. Thus, A. fumigatus Kdnase is important for fungal cell wall integrity and virulence, and because Kdnase is not present in the host, it may represent a potential target for the development of novel antifungal agents.
Keywords: Kdn; cell wall integrity; chitin; invasive aspergillosis; sialidase.
Figures
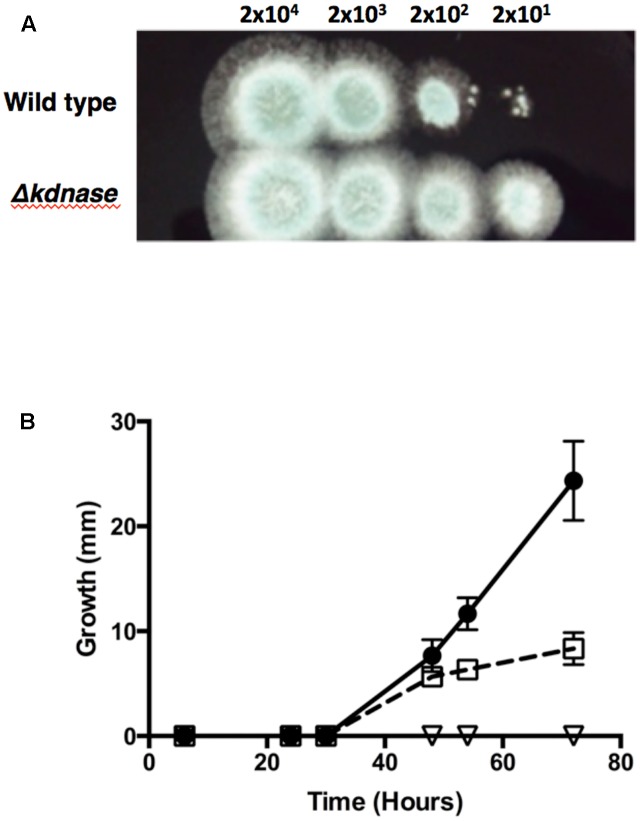
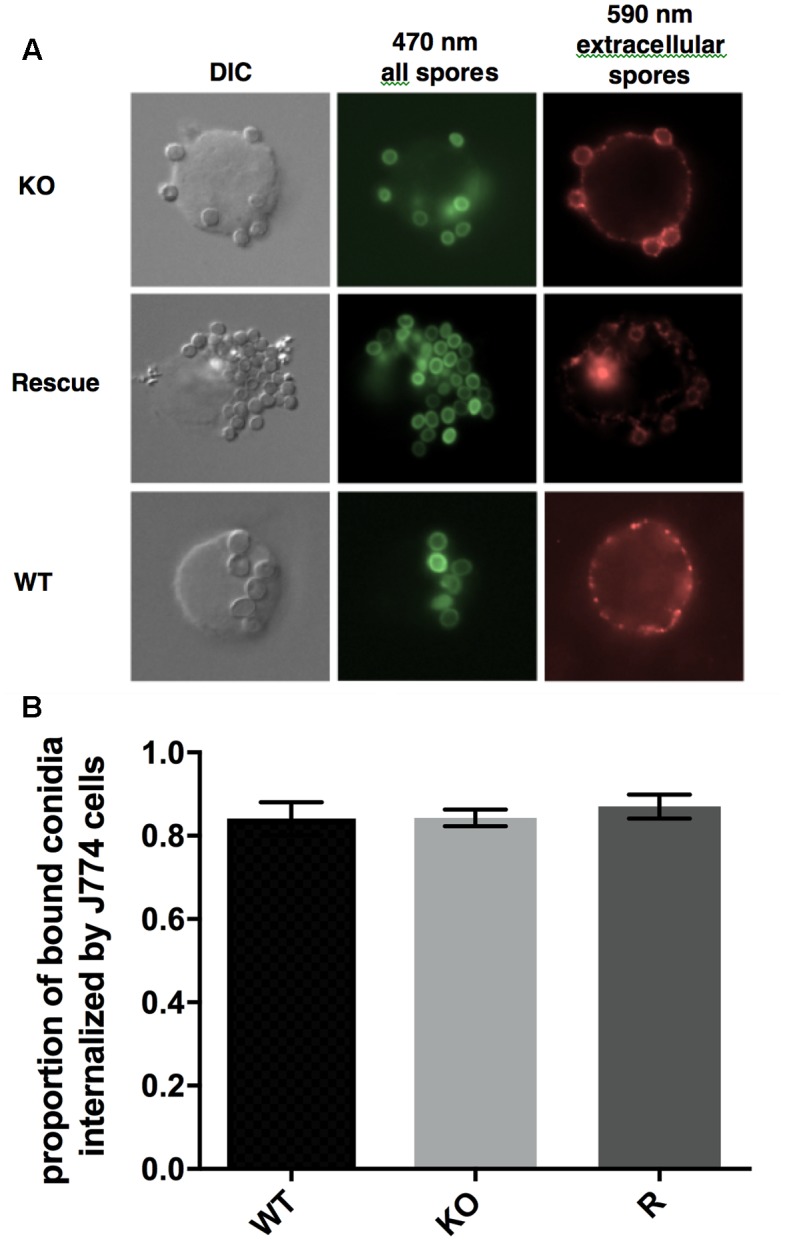
 - wild type;
  - Δkdnase knockout strain; and
  - ΔkdnaseR strain. Values represent the mean ± SD of three experiments.
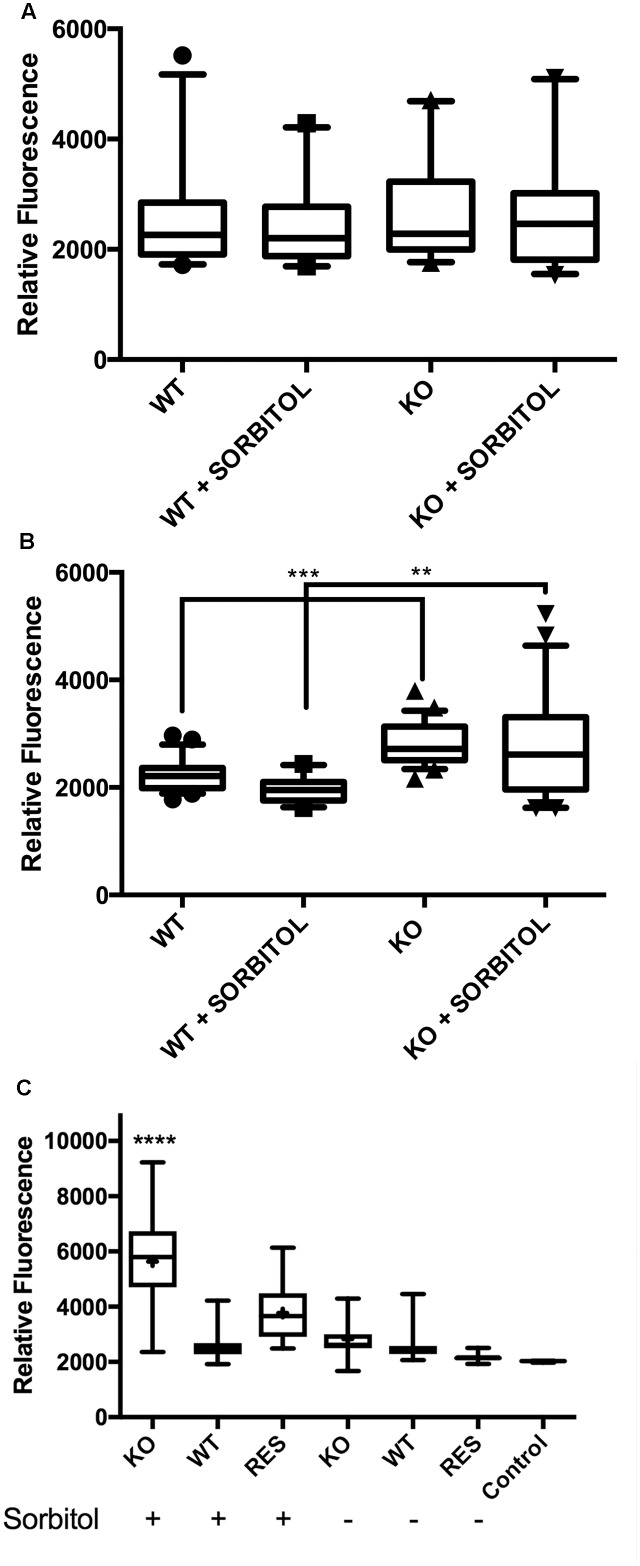
References
LinkOut - more resources
Full Text Sources
Other Literature Sources