. 2018 Jan 22:9:15.
doi: 10.3389/fimmu.2018.00015. eCollection 2018.

TRAIL-Mediated Suppression of T Cell Receptor Signaling Inhibits T Cell Activation and Inflammation in Experimental Autoimmune Encephalomyelitis

Affiliations

TRAIL-Mediated Suppression of T Cell Receptor Signaling Inhibits T Cell Activation and Inflammation in Experimental Autoimmune Encephalomyelitis

I-Tsu Chyuan et al. Front Immunol. .

Abstract

Objective: Tumor necrosis factor-related apoptosis-inducing ligand (TRAIL) induces cell apoptosis by transducing apoptosis signals after interacting with its receptor (TRAIL-R). Although the actual biological role of TRAIL remains to be elucidated, recent accumulating evidence implies that TRAIL regulates immune responses and immune cell homeostasis via an apoptosis-independent pathway, suggesting a novel immune-regulatory role of TRAIL in autoimmune diseases. The purpose of this study is to address the immune-regulatory role and molecular mechanism of TRAIL in regulating T cell activation in autoimmune diseases.

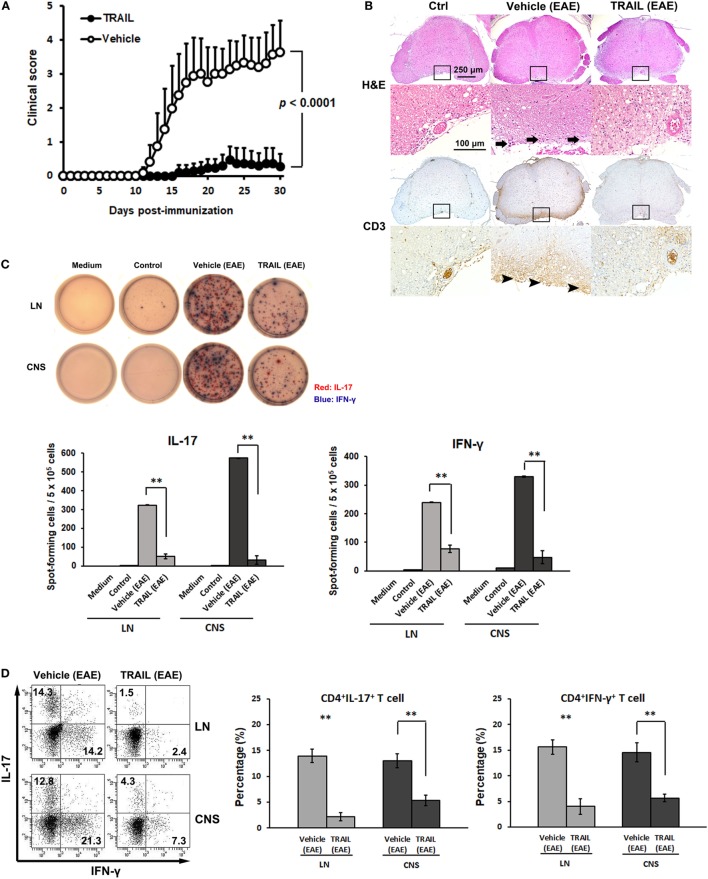
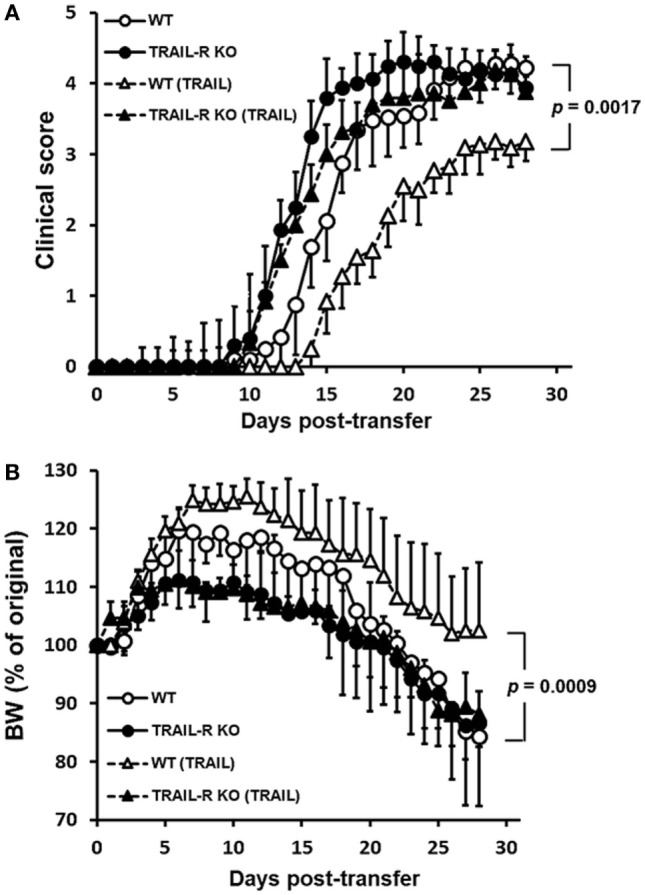
Design: TRAIL was administered to mice to induce experimental autoimmune encephalomyelitis (EAE), and to evaluate its impact on neuroinflammation and disease activity. The effects of TRAIL on neuroantigen [myelin oligodendrocyte glycoprotein (MOG)35-55]-activated T cell proliferation and cytokine production were investigated. TRAIL-treated MOG35-55-activated splenic Th17 cells were further adoptively transferred into Rag1 KO mice to induce passive EAE. Gene expression profiles of CD4+ T cells from EAE mice treated with TRAIL were analyzed by RNA sequencing and transcriptome analysis.

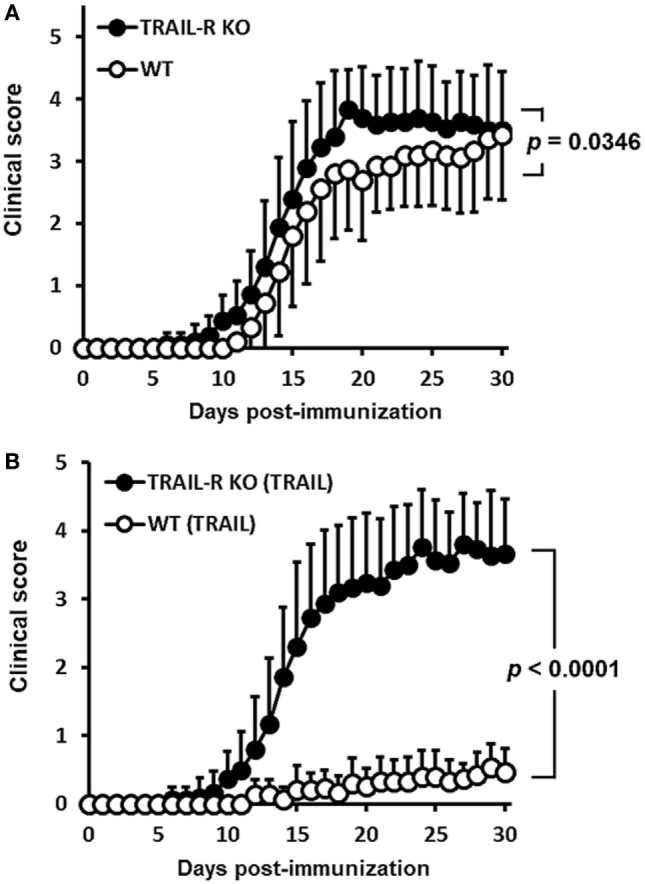
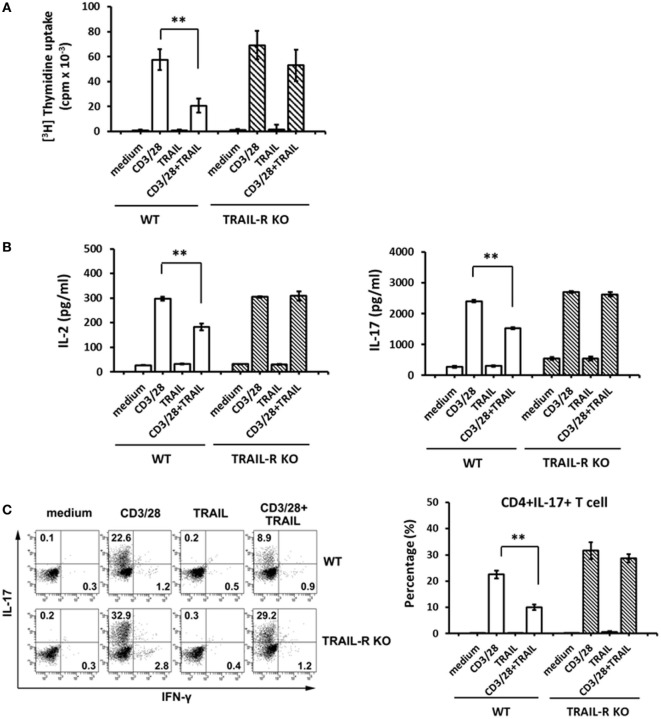
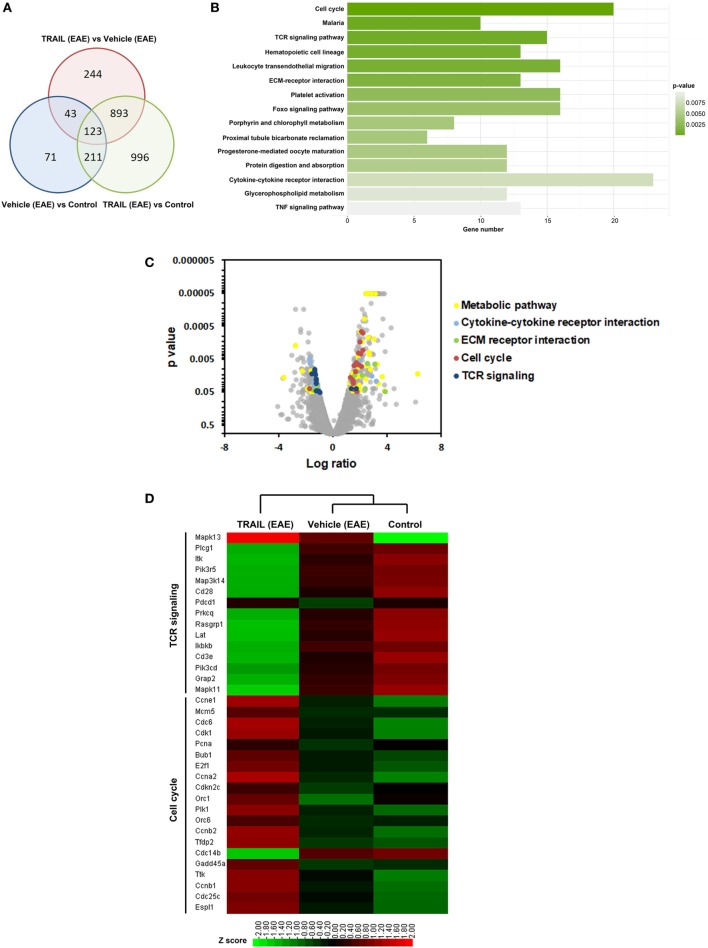
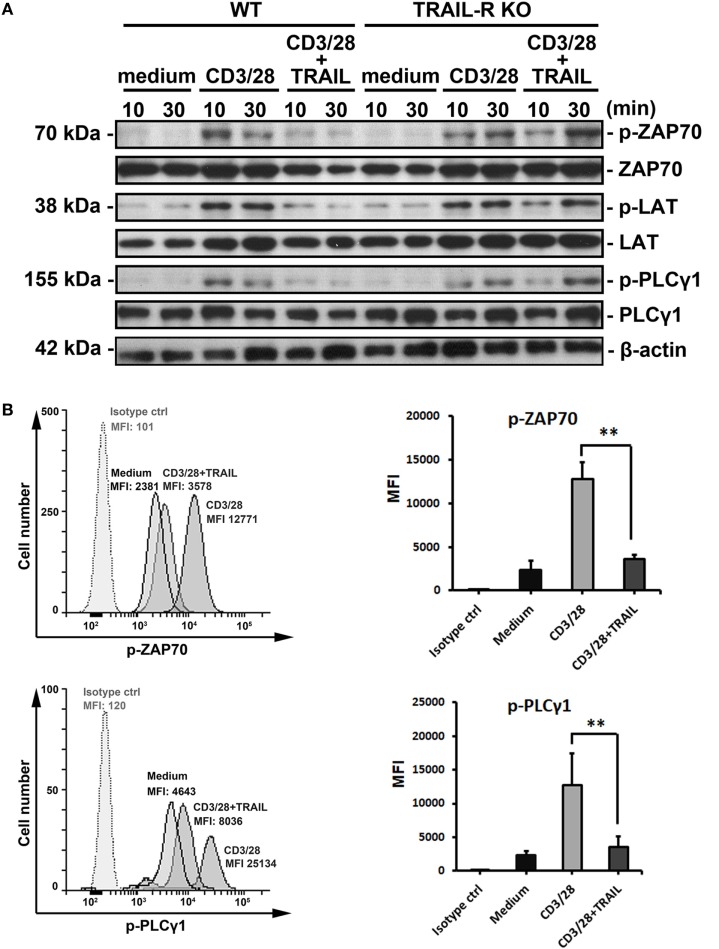
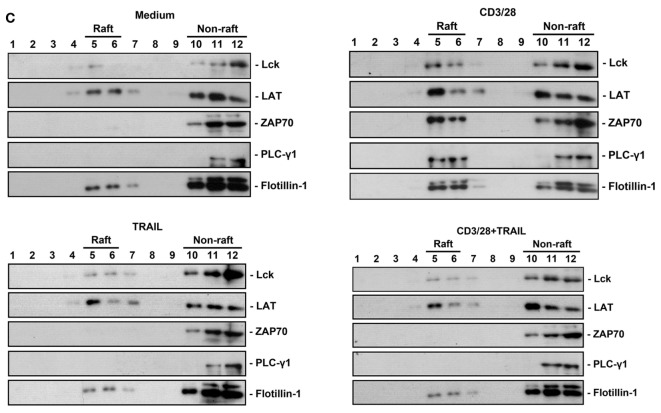
Results: TRAIL suppressed autoimmune encephalomyelitis and inhibited T cell reactivity to neuro-antigen in murine EAE, and the effects were dependent on TRAIL-R signaling. Moreover, TRAIL directly inhibited activation of MOG35-55-activated CD4+ T cells, resulting in suppression of neuroinflammation and reduced disease activity in adoptive transfer-induced EAE. Furthermore, TRAIL-R signaling inhibited phosphorylation of proximal T cell receptor (TCR)-associated tyrosine kinases in activated CD4+ T cells. Importantly, TRAIL/TRAIL-R interaction downregulated TCR downstream signaling genes in RNA sequencing and transcriptome analysis.

Conclusion: TRAIL/TRAIL-R interaction regulates CD4+ T cell activation in autoimmune inflammation and directly suppresses T cell activation via inhibiting TCR signaling, suggesting that TRAIL-R serves as a novel immune checkpoint in T cell responses.

Keywords: T cell activation; T cell receptor signaling; TRAIL; apoptosis; experimental autoimmune encephalomyelitis.


Figures

Figure 1
Figure 1
TRAIL suppressed neuroinflammation and T cell reactivity to neuroantigen in mice with experimental autoimmune encephalomyelitis (EAE). C57BL/6 mice were immunized by an s.c. injection with 200 µg the myelin oligodendrocyte glycoprotein (MOG)35–55 peptide emulsified in CFA containing 500 µg heat-killed Mycobacterium tuberculosis H37RA on day 0. Pertussis toxin, at 250 ng per mouse, was i.p. injected on the day of immunization (day 0) and 24 h later (day 1). From 48 h postimmunization (day 2), mice were treated with either vehicle (200 µl/mouse/day, i.p.) or TRAIL (100 µg/mouse/day, i.p.). (A) Mice were monitored daily for clinical paralysis, and the daily mean clinical score ± SD is presented for each group (n = 15 in each group). Statistics were calculated by the two way ANOVA test. (B) Spinal cords were isolated and examined histologically from control and EAE mice treated with the vehicle or TRAIL on day 30 after immunization. Cross-sections of paraffin-embedded spinal cords were stained with hematoxylin and eosin (H&E) and an anti-CD3 immunohistochemical antibody. Staining is representative of sections taken from five mice per group. Arrows indicate inflammatory cells. Arrow heads indicate CD3+ T cells. (C) Lymph node (LN) and central nervous system (CNS) mononuclear cells were isolated from control and EAE mice treated with vehicle or TRAIL on day 30 after immunization and restimulated with MOG35–55 (20 µg/ml) for 24 h. MOG35–55-activated interleukin (IL)-17 (red) and interferon (IFN)-γ (blue) responses were analyzed by a dual color ELISPOT assay. Representative figures of each group are shown (upper panel), and the frequency of MOG35–55-activated IL-17 and IFN-γ secretion was quantified as spot-forming cells per 5 × 105 cells (lower panel). **p < 0.01 by non-parametric Mann–Whitney U-test. Data are representative of at least six independent experiments. (D) LN and CNS mononuclear cells were isolated from EAE mice treated with the vehicle or TRAIL on day 30 after immunization and restimulated with phorbol 12-myristate 13-acetate/ionomycin in the presence of GolgiSTOP for 5 h. IL-17 and IFN-γ production by LN and CNS CD4+ cells was measured by intracellular cytokine staining. Data are representative of three independent experiments, each using pools of three mice for each group (left panel). Percentages of CD4+ IL-17+ and CD4+IFN-γ+ cells were quantified (right panel). **p < 0.01 by non-parametric Mann–Whitney U-test.
Figure 2
Figure 2
TRAIL-mediated inhibition of neuroinflammation in experimental autoimmune encephalomyelitis is through TRAIL-R. (A) Wild-type (WT) and TRAIL receptor-knockout (TRAIL-R KO) mice were immunized with the myelin oligodendrocyte glycoprotein (MOG)35–55 peptide (200 µg/mouse, s.c.) in a complete Freund’s adjuvant (CFA) emulsion on day 0 followed by pertussis toxin (250 ng/mouse, i.p.) on days 0 and 1. Clinical scores among groups were measured at the indicated time points (n = 15 in each group). Statistics were calculated by the two way ANOVA. (B) WT and TRAIL-R KO mice were immunized with the MOG35–55 peptide (200 µg/mouse, s.c.) in a CFA emulsion on day 0 followed by pertussis toxin (250 ng/mouse, i.p.) on days 0 and 1. Beginning on day 2 after immunization, mice were treated daily with TRAIL (100 µg/mouse, i.p.). Clinical scores among groups were measured at the indicated time points (n = 15 in each group). Statistics were calculated by the two way ANOVA.
Figure 3
Figure 3
TRAIL inhibited myelin oligodendrocyte glycoprotein (MOG)35–55-activated T cells. Th17-polarized MOG35–55-activated splenic T cells were generated from wild-type (WT) and TRAIL-R KO mice after experimental autoimmune encephalomyelitis immunization, as described in Section “Materials and Methods.” (A) 105 MOG35–55-activated splenic Th17 cells were cultured in 96-well flat-bottomed plates precoated with medium, an anti-CD3 antibody (Ab; 1 µg/ml), an anti-CD28 Ab (1 µg/ml), and TRAIL (10 µg/ml), or a combination of anti-CD3/anti-CD28 Abs and TRAIL for 96 h; then [3H] thymidine was added for an additional 16 h. Radioactivity (presented as cpm) was determined with a scintillation counter. **p < 0.01 by non-parametric Mann–Whitney U-test. (B) 2 × 105 MOG35–55-activated splenic Th17 cells were cultured in 96-well flat-bottomed plates precoated with medium, anti-CD3/anti-CD28 Abs, and TRAIL, or a combination of anti-CD3/anti-CD28 Abs and TRAIL for 24 h. Supernatants were collected and assayed for interleukin (IL)-2 (left panel) and IL-17 (right panel) concentrations by an enzyme-linked immunosorbent assay. Data are shown as the mean ± SD of triplicate samples. **p < 0.01 by non-parametric Mann–Whitney U-test. (C) IL-17 and interferon (IFN)-γ production by MOG35–55-activated splenic Th17 cells were measured by intracellular cytokine staining following stimulation with medium, anti-CD3/anti-CD28 Abs, and TRAIL, or a combination of anti-CD3/anti-CD28 Abs and TRAIL for 24 h. Data are representative of three independent experiments (left panel), and percentages of CD4+ IL-17+ cells were quantified (right panel). **p < 0.01 by non-parametric Mann–Whitney U-test.
Figure 4
Figure 4
TRAIL-treated myelin oligodendrocyte glycoprotein (MOG)-activated T cells reduced disease activity in adoptive transfer-induced experimental autoimmune encephalomyelitis (EAE). Th17-polarized MOG35–55-activated T cells were generated from wild-type (WT) and TRAIL-R KO mice after EAE immunization, as described in Section “Materials and Methods.” MOG35–55-activated splenic Th17 cells were stimulated with anti-CD3 (1 µg/ml) and anti-CD28 (1 µg/ml) antibodies in the presence or absence of TRAIL (10 µg/ml) for 24 h and adoptively transferred into Rag1 KO mice (5 × 106 CD4+ T cells/recipient). Adoptive transfer recipients were monitored daily for clinical paralysis and body weight changes. The daily (A) mean clinical score ± SD and (B) percentage of body weight change ± SD are presented for each group. Statistics were calculated by the two way ANOVA. Data shown are from one experiment with 12 mice/group representative of three performed.
Figure 5
Figure 5
Downregulated T cell receptor (TCR) signaling-associated genes in TRAIL-treated mice with experimental autoimmune encephalomyelitis (EAE). C57BL/6 mice were immunized with the myelin oligodendrocyte glycoprotein35–55 peptide (200 µg/mouse, s.c.) in a complete Freund’s adjuvant emulsion on day 0 followed by pertussis toxin (250 ng/mouse, i.p.) on days 0 and 1. Beginning on day 2 after immunization, mice were treated daily with vehicle (200 µl/mouse/day, i.p.) or TRAIL (100 µg/mouse/day, i.p.). On day 15 after immunization, splenic CD4+ T cells were isolated from control and EAE mice after treatment with the vehicle or TRAIL. Total RNA of splenic CD4+ T cells from each group was extracted and sequenced on the Solexa platform (Illumina), as described in Section “Materials and Methods.” (A) Venn diagram showing the overlap among nominally significant genes of splenic CD4+ T cells from each group. (B) The number of significant genes in splenic CD4+ T cells from TRAIL-treated mice compared to vehicle-treated mice was plotted following a Kyoto Encyclopedia of Genes and Genomes (KEGG) pathway analysis. (C) Volcano plot showing distribution of up- and downregulated genes in splenic CD4+ T cells from TRAIL-treated mice compared to vehicle-treated mice following a KEGG pathway analysis. Significantly up- and downregulated genes are highlighted. (D) Heatmap representing gene expressions of splenic CD4+ T cells from each group. Only the most significant genes in TCR signaling and the cell cycle from the KEGG pathway analysis are shown. Statistical analysis was performed using R. Scale: Red indicates high expression and green is low expression.
Figure 6
Figure 6
TRAIL inhibited T cell activation by suppressing phosphorylation of proximal T cell receptor signaling molecules. (A) 2 × 106 primary splenic CD4+ T cells from C57BL/6 wild-type (WT) and TRAIL-R KO mice were stimulated at the indicated time point with medium, an anti-CD3 antibody (Ab; 1 µg/ml), an anti-CD28 Ab (1 µg/ml), and TRAIL (10 µg/ml), or a combination of anti-CD3/anti-CD28 Abs and TRAIL. Lysates of each group were prepared and immunoblotted with antiphospho-ZAP70 (Tyr319), anti-ZAP70, antiphospho-LAT (Tyr191), anti-LAT, antiphospho-PLCγ1 (Tyr783), anti-PLCγ1, and antiactin Abs. Blots are representative of three independent experiments performed. (B) 2 × 106 primary splenic CD4+ T cells from C57BL/6 mice were stimulated for 2 h at 37°C with medium, anti-CD3/anti-CD28 Abs, TRAIL, or combination of anti-CD3/anti-CD28 Abs and TRAIL. Cells were fixed, permeabilized, and stained with anti-p-ZAP70 Ab or anti-p-PLCγ1 Ab. Representative figures for each group are shown (left panel) and quantified (right panel) from four independent experiments in each group. **p < 0.01 by non-parametric Mann–Whitney U-test. (C) 2 × 107 primary splenic CD4+ T cells from C57BL/6 mice were stimulated for 24 h with medium, anti-CD3/anti-CD28 Abs, and TRAIL, or a combination of anti-CD3/anti-CD28 Abs and TRAIL. Cell were lysed and subjected to sucrose density gradient centrifugation to isolate lipid rafts. Proteins from equal volumes of representative collected fractions were immunoblotted with anti-Lck, anti-LAT, anti-ZAP70, anti-PLCγ1, and anti-flotillin-1 Abs. Blots are representative of three independent experiments performed.
Figure 6
Figure 6
TRAIL inhibited T cell activation by suppressing phosphorylation of proximal T cell receptor signaling molecules. (A) 2 × 106 primary splenic CD4+ T cells from C57BL/6 wild-type (WT) and TRAIL-R KO mice were stimulated at the indicated time point with medium, an anti-CD3 antibody (Ab; 1 µg/ml), an anti-CD28 Ab (1 µg/ml), and TRAIL (10 µg/ml), or a combination of anti-CD3/anti-CD28 Abs and TRAIL. Lysates of each group were prepared and immunoblotted with antiphospho-ZAP70 (Tyr319), anti-ZAP70, antiphospho-LAT (Tyr191), anti-LAT, antiphospho-PLCγ1 (Tyr783), anti-PLCγ1, and antiactin Abs. Blots are representative of three independent experiments performed. (B) 2 × 106 primary splenic CD4+ T cells from C57BL/6 mice were stimulated for 2 h at 37°C with medium, anti-CD3/anti-CD28 Abs, TRAIL, or combination of anti-CD3/anti-CD28 Abs and TRAIL. Cells were fixed, permeabilized, and stained with anti-p-ZAP70 Ab or anti-p-PLCγ1 Ab. Representative figures for each group are shown (left panel) and quantified (right panel) from four independent experiments in each group. **p < 0.01 by non-parametric Mann–Whitney U-test. (C) 2 × 107 primary splenic CD4+ T cells from C57BL/6 mice were stimulated for 24 h with medium, anti-CD3/anti-CD28 Abs, and TRAIL, or a combination of anti-CD3/anti-CD28 Abs and TRAIL. Cell were lysed and subjected to sucrose density gradient centrifugation to isolate lipid rafts. Proteins from equal volumes of representative collected fractions were immunoblotted with anti-Lck, anti-LAT, anti-ZAP70, anti-PLCγ1, and anti-flotillin-1 Abs. Blots are representative of three independent experiments performed.

Similar articles

Cited by

  • Apoptotic cell death in disease-Current understanding of the NCCD 2023.
    Vitale I, Pietrocola F, Guilbaud E, Aaronson SA, Abrams JM, Adam D, Agostini M, Agostinis P, Alnemri ES, Altucci L, Amelio I, Andrews DW, Aqeilan RI, Arama E, Baehrecke EH, Balachandran S, Bano D, Barlev NA, Bartek J, Bazan NG, Becker C, Bernassola F, Bertrand MJM, Bianchi ME, Blagosklonny MV, Blander JM, Blandino G, Blomgren K, Borner C, Bortner CD, Bove P, Boya P, Brenner C, Broz P, Brunner T, Damgaard RB, Calin GA, Campanella M, Candi E, Carbone M, Carmona-Gutierrez D, Cecconi F, Chan FK, Chen GQ, Chen Q, Chen YH, Cheng EH, Chipuk JE, Cidlowski JA, Ciechanover A, Ciliberto G, Conrad M, Cubillos-Ruiz JR, Czabotar PE, D'Angiolella V, Daugaard M, Dawson TM, Dawson VL, De Maria R, De Strooper B, Debatin KM, Deberardinis RJ, Degterev A, Del Sal G, Deshmukh M, Di Virgilio F, Diederich M, Dixon SJ, Dynlacht BD, El-Deiry WS, Elrod JW, Engeland K, Fimia GM, Galassi C, Ganini C, Garcia-Saez AJ, Garg AD, Garrido C, Gavathiotis E, Gerlic M, Ghosh S, Green DR, Greene LA, Gronemeyer H, Häcker G, Hajnóczky G, Hardwick JM, Haupt Y, He S, Heery DM, Hengartner MO, Hetz C, Hildeman DA, Ichijo H, Inoue S, Jäättelä M, Janic A, Joseph B, Jost PJ, Kanneganti TD, Karin M, Kashkar H, Kaufmann T, Kelly … See abstract for full author list ➔ Vitale I, et al. Cell Death Differ. 2023 May;30(5):1097-1154. doi: 10.1038/s41418-023-01153-w. Epub 2023 Apr 26. Cell Death Differ. 2023. PMID: 37100955 Free PMC article. Review.
  • The Role of TRAIL/DRs in the Modulation of Immune Cells and Responses.
    Sag D, Ayyildiz ZO, Gunalp S, Wingender G. Sag D, et al. Cancers (Basel). 2019 Sep 30;11(10):1469. doi: 10.3390/cancers11101469. Cancers (Basel). 2019. PMID: 31574961 Free PMC article. Review.
  • A novel model based on necroptosis to assess progression for polycystic ovary syndrome and identification of potential therapeutic drugs.
    Wang M, An K, Huang J, Mprah R, Ding H. Wang M, et al. Front Endocrinol (Lausanne). 2023 Sep 7;14:1193992. doi: 10.3389/fendo.2023.1193992. eCollection 2023. Front Endocrinol (Lausanne). 2023. PMID: 37745699 Free PMC article.
  • A transcriptomic study of probenecid on injured spinal cords in mice.
    Zhang YX, Wang SN, Chen J, Hu JG, Lü HZ. Zhang YX, et al. PeerJ. 2020 Jan 3;8:e8367. doi: 10.7717/peerj.8367. eCollection 2020. PeerJ. 2020. PMID: 31921518 Free PMC article.
  • TRAIL and FasL Functions in Cancer and Autoimmune Diseases: Towards an Increasing Complexity.
    Rossin A, Miloro G, Hueber AO. Rossin A, et al. Cancers (Basel). 2019 May 8;11(5):639. doi: 10.3390/cancers11050639. Cancers (Basel). 2019. PMID: 31072029 Free PMC article. Review.

References

    1. Wiley SR, Schooley K, Smolak PJ, Din WS, Huang CP, Nicholl JK, et al. Identification and characterization of a new member of the TNF family that induces apoptosis. Immunity (1995) 3(6):673–82.10.1016/1074-7613(95)90057-8 - DOI - PubMed
    1. Pitti RM, Marsters SA, Ruppert S, Donahue CJ, Moore A, Ashkenazi A. Induction of apoptosis by Apo-2 ligand, a new member of the tumor necrosis factor cytokine family. J Biol Chem (1996) 271(22):12687–90.10.1074/jbc.271.22.12687 - DOI - PubMed
    1. Pan G, Ni J, Wei YF, Yu G, Gentz R, Dixit VM. An antagonist decoy receptor and a death domain-containing receptor for TRAIL. Science (1997) 277(5327):815–8.10.1126/science.277.5327.815 - DOI - PubMed
    1. Wu GS, Burns TF, Zhan Y, Alnemri ES, El-Deiry WS. Molecular cloning and functional analysis of the mouse homologue of the KILLER/DR5 tumor necrosis factor-related apoptosis-inducing ligand (TRAIL) death receptor. Cancer Res (1999) 59(12):2770–5. - PubMed
    1. Kischkel FC, Lawrence DA, Chuntharapai A, Schow P, Kim KJ, Ashkenazi A. Apo2L/TRAIL-dependent recruitment of endogenous FADD and caspase-8 to death receptors 4 and 5. Immunity (2000) 12:611–20.10.1016/S1074-7613(00)80212-5 - DOI - PubMed

Publication types

MeSH terms

Substances