

The expert system of genotype discrimination for D5S818 locus based on near-infrared spectroscopy-principal discriminant variate
- PMID: 29403730
- PMCID: PMC5760823
- DOI: 10.1016/j.jpha.2011.10.007
The expert system of genotype discrimination for D5S818 locus based on near-infrared spectroscopy-principal discriminant variate
Abstract
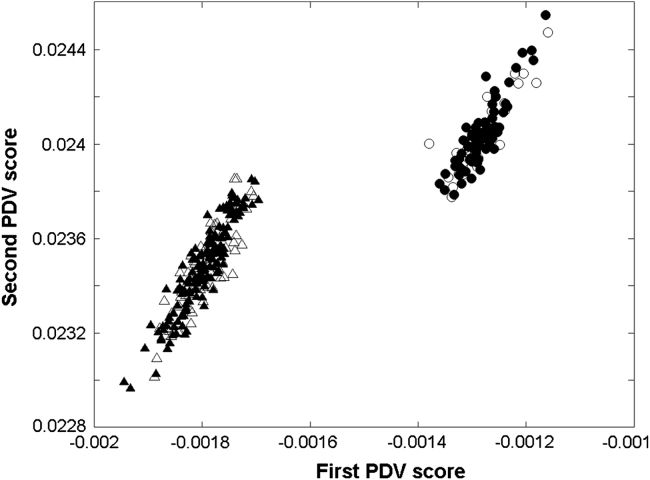
This paper studied the expert system of genotype discrimination for the STR locus D5S818 based on near-infrared spectroscopy-principal discriminant variate (PDV). Six genotypes, i.e. genotypes 10-10, 10-11, 11-11, 11-12, 11-13 and 13-13, were selected as research subjects. Based on the optimum polymerase chain reaction (PCR) conditions, about 54 measuring samples for each genotype were obtained; these samples were tested by near-infrared spectroscopy directly. With differences between homozygote genotypes and heterozygote ones, and differences of the total number of core repeat units between the six genotypes, two types of genotyping-tree structure were constructed and their respective PDV models were studied using the near-infrared spectra of the samples as recognition variables. Finally, based on the classification ability of these two genotyping-tree structures, an optimum expert system of genotype discrimination was built using the PDV models. The result demonstrated that the built expert system had good discriminability and robustness; without any preprocessing for PCR products, the six genotypes studied could be discriminated rapidly and correctly. It provided a methodological support for establishing an expert system of genotype discrimination for all genotypes of locus D5S818 and other STR loci.
Keywords: Expert system; Genotyping-tree structure; Near-infrared spectroscopy; Principal discriminant variate; Short tandem repeat.
Figures


Similar articles
-
The determination for the three genotypes of D16S539 locus based on near-infrared spectroscopy and chemical pattern recognition.Anal Chim Acta. 2009 Apr 13;638(2):202-8. doi: 10.1016/j.aca.2009.02.041. Epub 2009 Mar 5. Anal Chim Acta. 2009. PMID: 19327461
-
Statistical methods for discrimination of STR genotypes using high resolution melt curve data.Int J Legal Med. 2024 Nov;138(6):2281-2288. doi: 10.1007/s00414-024-03289-x. Epub 2024 Jul 13. Int J Legal Med. 2024. PMID: 38997516 Free PMC article.
-
[Discrimination of Varieties of Cabbage with Near Infrared Spectra Based on Principal Component Analysis and Successive Projections Algorithm].Guang Pu Xue Yu Guang Pu Fen Xi. 2016 Nov;36(11):3536-41. Guang Pu Xue Yu Guang Pu Fen Xi. 2016. PMID: 30198665 Chinese.
-
Polymorphism profile of nine short tandem repeat Loci in the Han chinese.Genomics Proteomics Bioinformatics. 2003 May;1(2):166-70. doi: 10.1016/s1672-0229(03)01020-9. Genomics Proteomics Bioinformatics. 2003. PMID: 15626346 Free PMC article.
-
Mother-child double incompatibility at vWA and D5S818 loci in paternity testing.Clin Chem Lab Med. 2007;45(10):1288-91. doi: 10.1515/CCLM.2007.276. Clin Chem Lab Med. 2007. PMID: 17727308
References
-
- Butler J.M. Forensic DNA Typing: Biology, Technology, and Genetics of STR Markers. second ed. Elsevier; New York: 2005.
-
- Morgante M., Rafalski A., Biddle P. Genetic mapping and variability of seven soybean simple sequence repeat loci. Genome. 1994;37:763–769. - PubMed
-
- Holt C.L., Stauffer C., Wallin J.M. Practical applications of genotypic surveys for forensic STR testing. Forensic Sci. Int. 2000;112:91–109. - PubMed
-
- Roewer L. Y chromosome STR typing in crime casework. Forensic Sci. Med. Pathol. 2009;5:77–84. - PubMed
-
- Lea R.A., Dohy A., Jordan K. Evidence for allelic association of the dopamine b-hydroxylase gene (DBH) with susceptibility to typical migraine. Neurogenetics. 2000;3:35–40. - PubMed
LinkOut - more resources
Full Text Sources
