

Determination of a novel ACE inhibitor in the presence of alkaline and oxidative degradation products using smart spectrophotometric and chemometric methods
- PMID: 29403875
- PMCID: PMC5761084
- DOI: 10.1016/j.jpha.2013.09.006
Determination of a novel ACE inhibitor in the presence of alkaline and oxidative degradation products using smart spectrophotometric and chemometric methods
Abstract
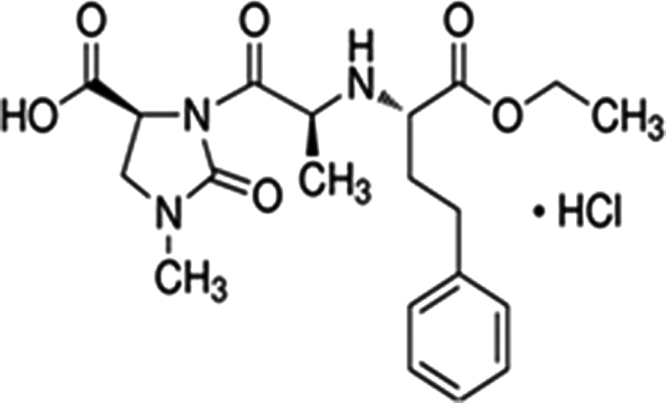
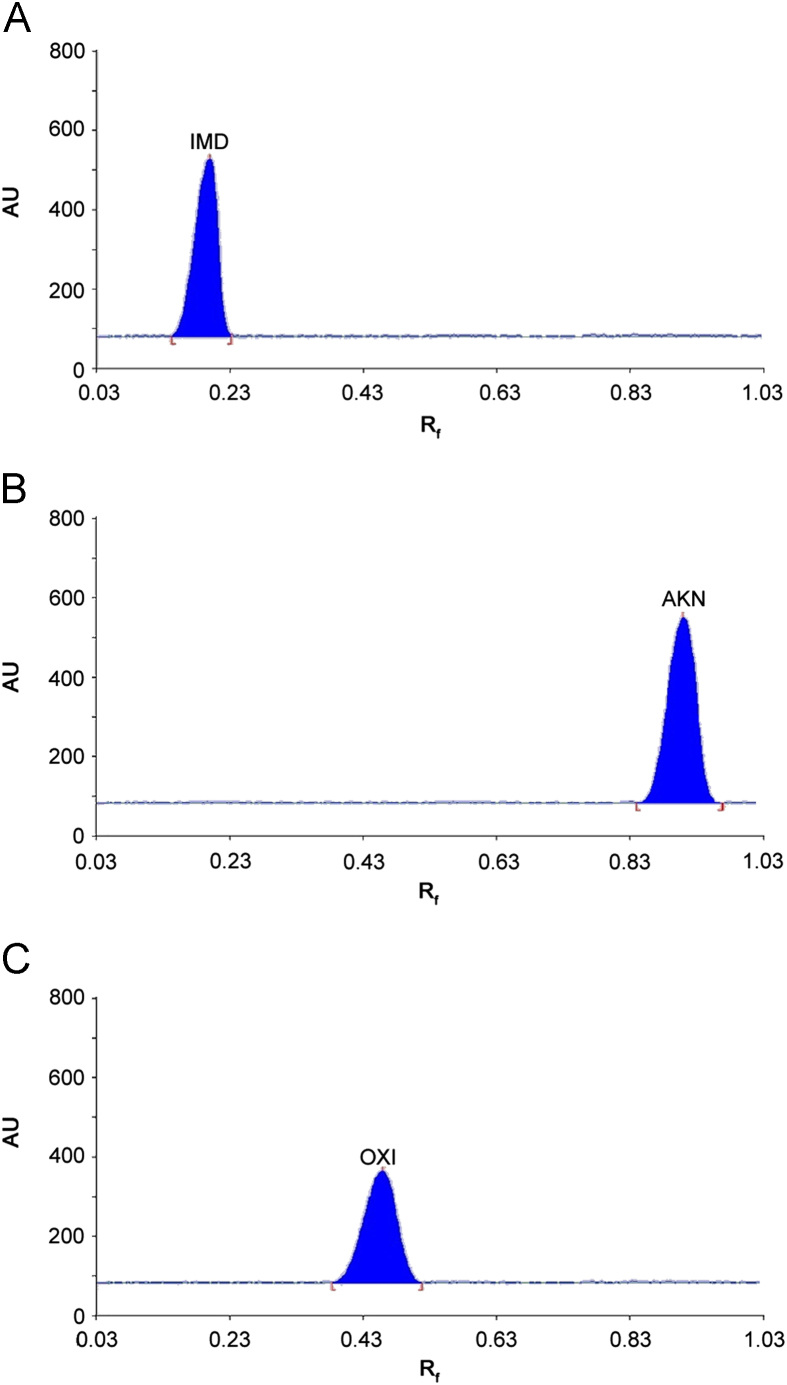
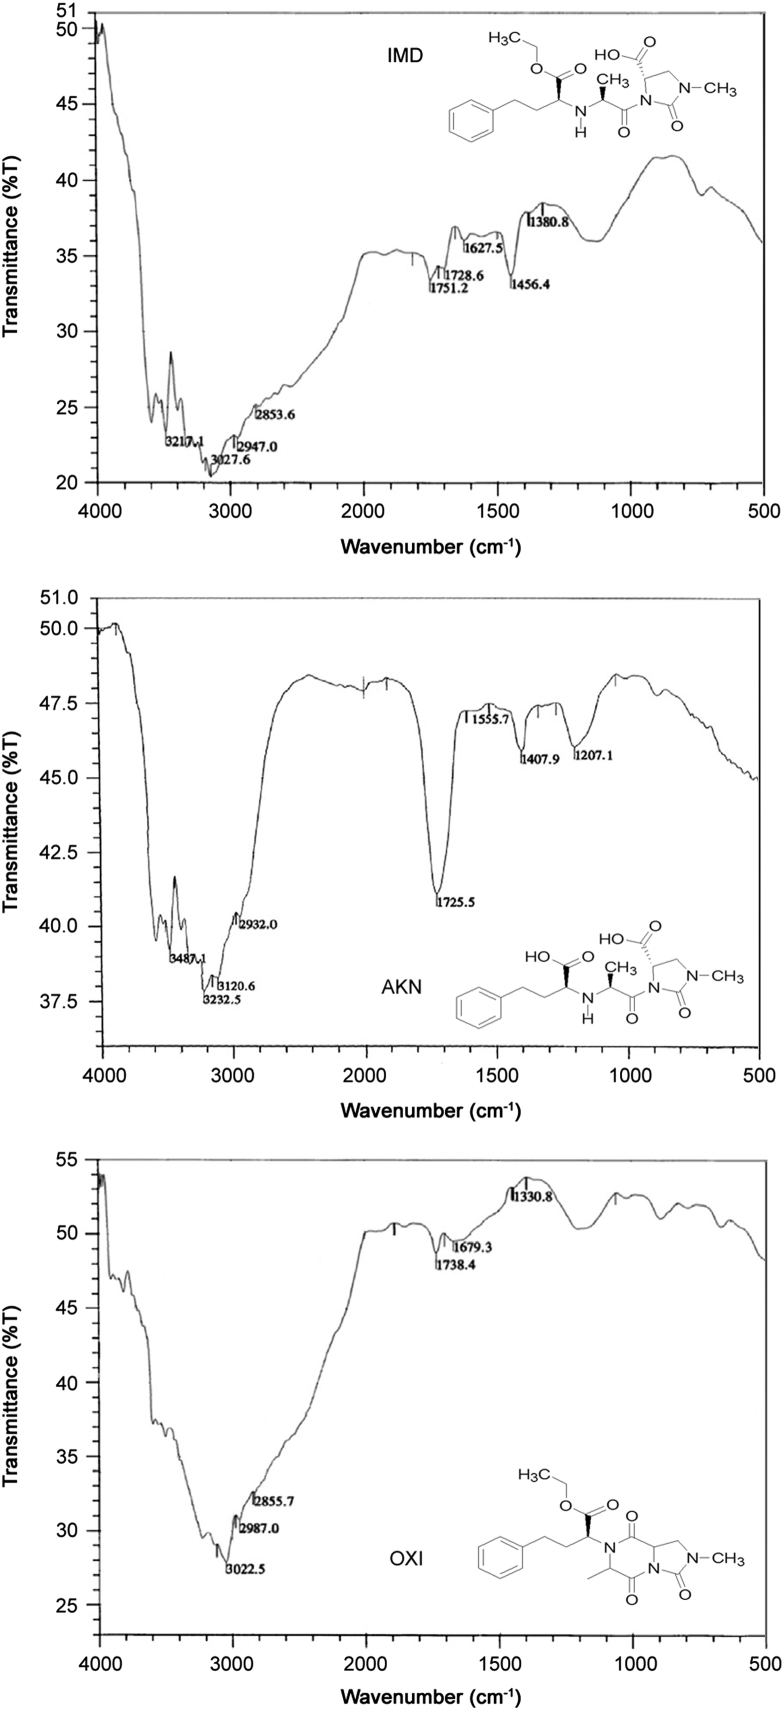
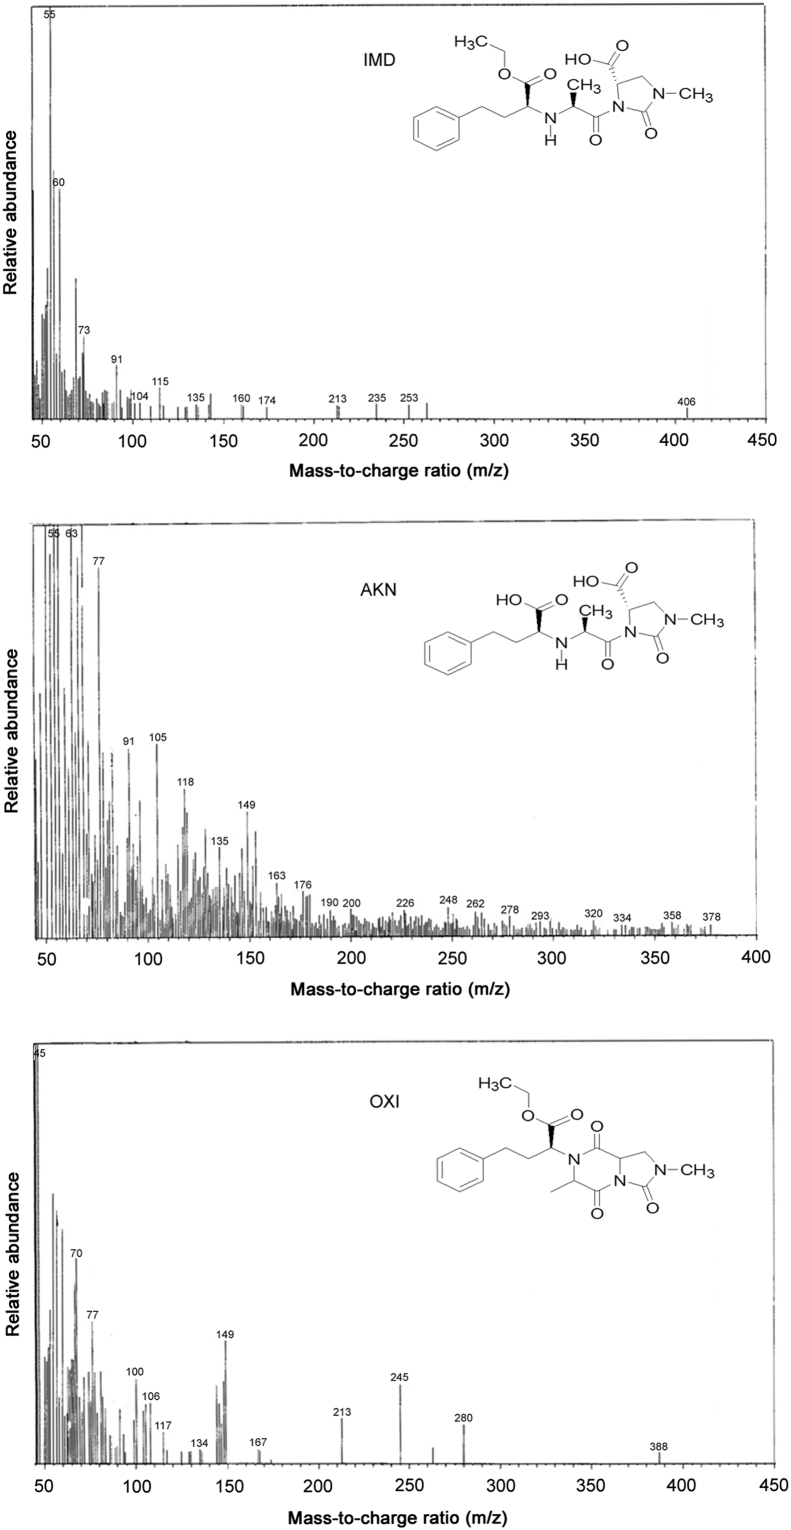
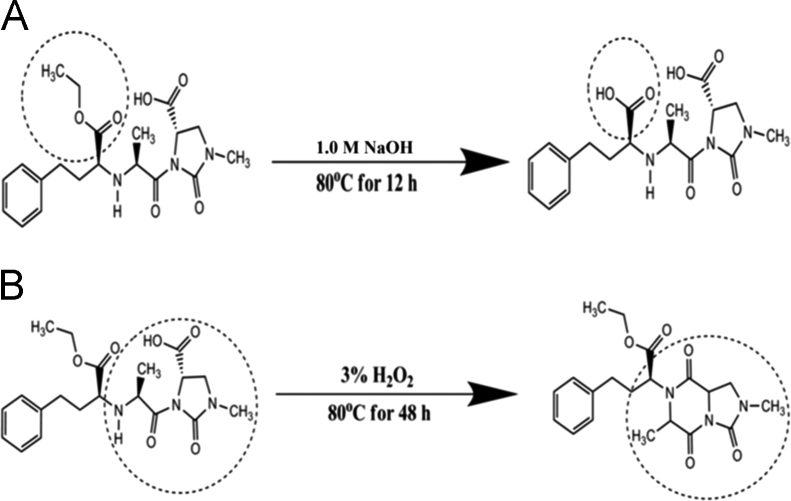
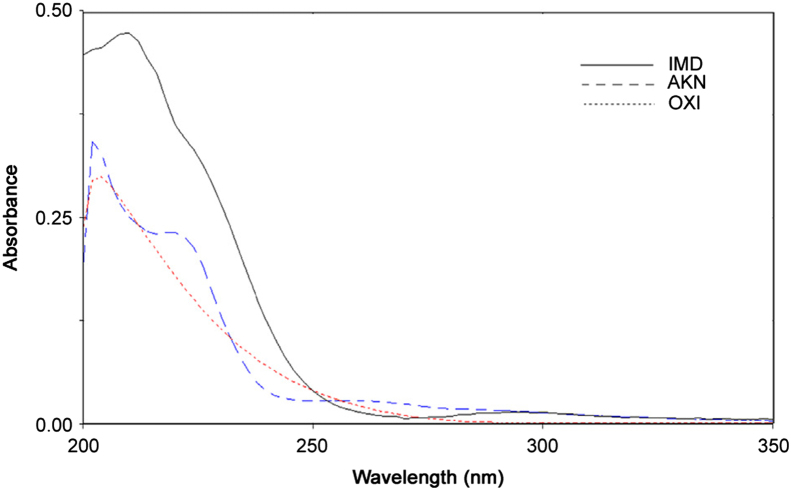
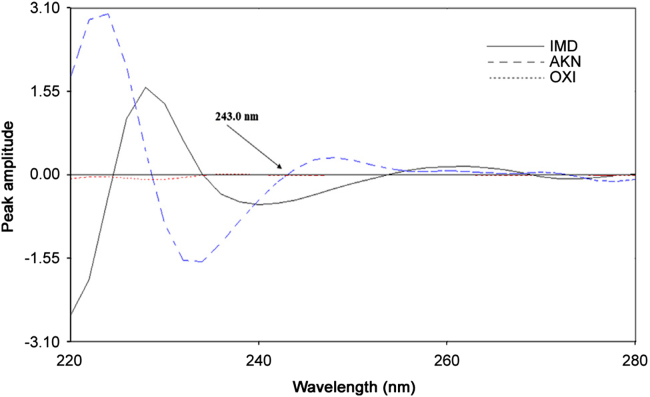
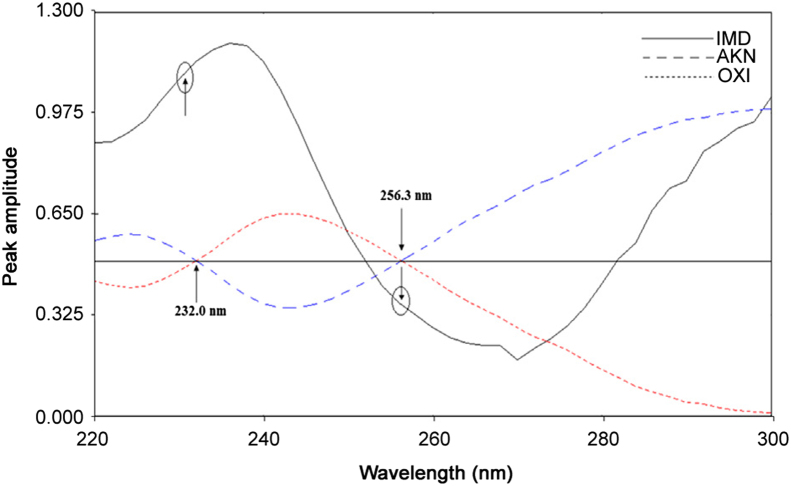
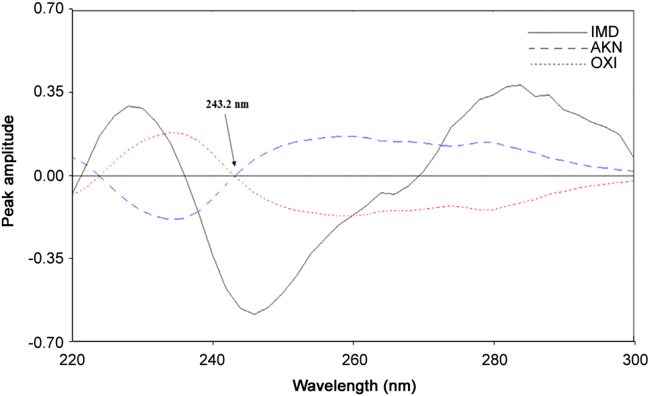
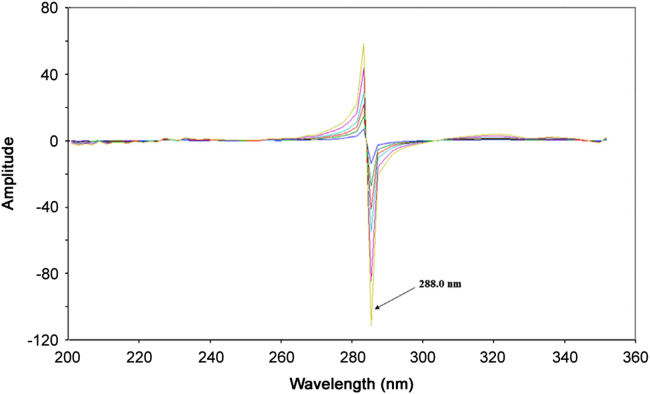
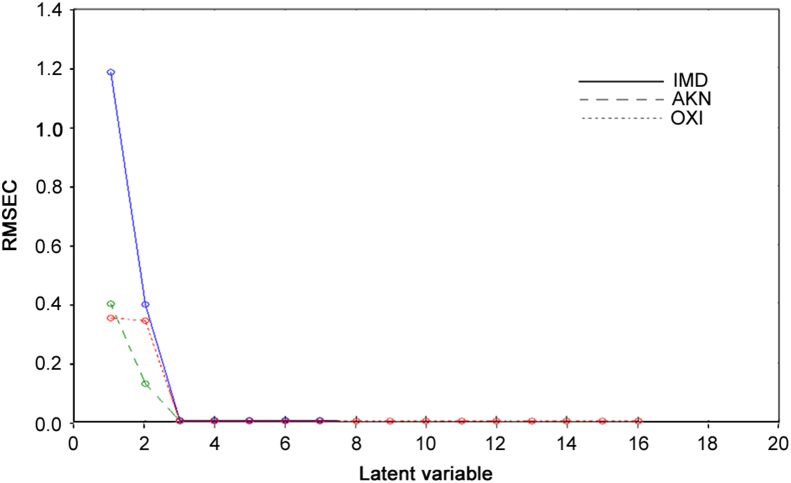
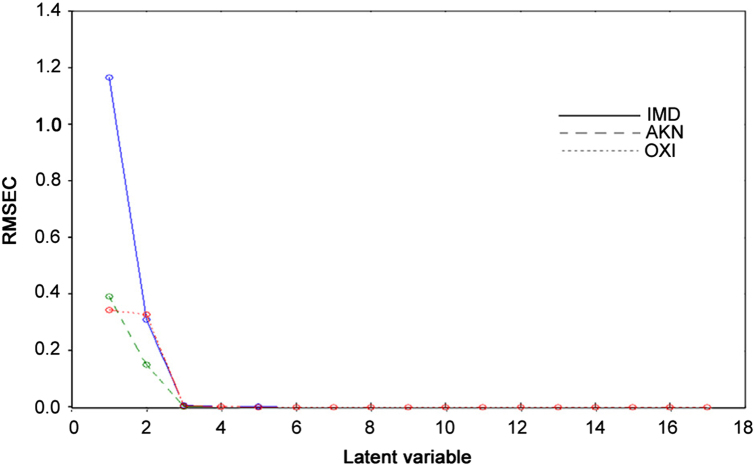
Simple, accurate, sensitive and validated UV spectrophotometric and chemometric methods were developed for the determination of imidapril hydrochloride (IMD) in the presence of both its alkaline (AKN) and oxidative (OXI) degradation products and in its pharmaceutical formulation. Method A is the fourth derivative spectra (D4) which allows the determination of IMD in the presence of both AKN and OXD, in pure form and in tablets by measuring the peak amplitude at 243.0 nm. Methods B, C and D, manipulating ratio spectra, were also developed. Method B is the double divisor-ratio difference spectrophotometric one (DD-RD) by computing the difference between the amplitudes of IMD ratio spectra at 232 and 256.3 nm. Method C is the double divisor-first derivative of ratio spectra method (DD-DR1) at 243.2 nm, while method D is the mean centering of ratio spectra (MCR) at 288.0 nm. Methods A, B, C and D could successfully determine IMD in a concentration range of 4.0-32.0 µg/mL. Methods E and F are principal component regression (PCR) and partial least-squares (PLS), respectively, for the simultaneous determination of IMD in the presence of both AKN and OXI, in pure form and in its tablets. The developed methods have the advantage of simultaneous determination of the cited components without any pre-treatment. The accuracy, precision and linearity ranges of the developed methods were determined. The results obtained were statistically compared with those of a reported HPLC method, and there was no significant difference between the proposed methods and the reported method regarding both accuracy and precision.
Keywords: Chemometry; Double divisor–ratio derivative; Double divisor–ratio difference; Imidapril hydrochloride; Mean centering of ratio spectra.
Figures

Similar articles
-
Spectrophotometric determination of isopropamide iodide and trifluoperazine hydrochloride in presence of trifluoperazine oxidative degradate.Drug Test Anal. 2010 Apr;2(4):168-81. doi: 10.1002/dta.113. Drug Test Anal. 2010. PMID: 20376832
-
Resolution of overlapped spectra for the determination of ternary mixture using different and modified spectrophotometric methods.Spectrochim Acta A Mol Biomol Spectrosc. 2016 Aug 5;165:127-137. doi: 10.1016/j.saa.2016.04.003. Epub 2016 Apr 7. Spectrochim Acta A Mol Biomol Spectrosc. 2016. PMID: 27128521
-
Investigation of different spectrophotometric and chemometric methods for determination of entacapone, levodopa and carbidopa in ternary mixture.Spectrochim Acta A Mol Biomol Spectrosc. 2017 Jan 15;171:236-245. doi: 10.1016/j.saa.2016.07.053. Epub 2016 Aug 2. Spectrochim Acta A Mol Biomol Spectrosc. 2017. PMID: 27541796
-
Quantitative determination of oxybutynin hydrochloride by spectrophotometry, chemometry and HPTLC in presence of its degradation product and additives in different pharmaceutical dosage forms.Talanta. 2010 Mar 15;80(5):2007-15. doi: 10.1016/j.talanta.2009.11.002. Epub 2009 Nov 10. Talanta. 2010. PMID: 20152446
-
Evaluating the efficiency of spectral resolution of univariate methods manipulating ratio spectra and comparing to multivariate methods: an application to ternary mixture in common cold preparation.Spectrochim Acta A Mol Biomol Spectrosc. 2015 Feb 25;137:1363-73. doi: 10.1016/j.saa.2014.09.055. Epub 2014 Sep 28. Spectrochim Acta A Mol Biomol Spectrosc. 2015. PMID: 25306132
Cited by
-
Different applications of isosbestic points, normalized spectra and dual wavelength as powerful tools for resolution of multicomponent mixtures with severely overlapping spectra.Chem Cent J. 2017 May 25;11(1):43. doi: 10.1186/s13065-017-0270-8. Chem Cent J. 2017. PMID: 29086829 Free PMC article.
-
Chemometrics Approaches in Forced Degradation Studies of Pharmaceutical Drugs.Molecules. 2019 Oct 22;24(20):3804. doi: 10.3390/molecules24203804. Molecules. 2019. PMID: 31652589 Free PMC article. Review.
-
Univariate versus multivariate spectrophotometric data analysis of triamterene and xipamide; a quantitative and qualitative greenly profiled comparative study.BMC Chem. 2023 May 13;17(1):47. doi: 10.1186/s13065-023-00956-9. BMC Chem. 2023. PMID: 37179391 Free PMC article.
References
-
- Wyszomirska E., Czerwinska K., Mazurek A.P. Identification and determination of antihypertonics from the group of angiotensin-convertase inhibitors by densitometric method in comparison with HPLC method. Acta Pol. Pharm.—Drug Res. 2010;67:137–143. - PubMed
-
- Nishi H., Yamasaki K., Kokusenya Y. Optical resolution of imidapril hydrochloride by high performance liquid chromatography and application to the optical purity testing of drugs. J. Chromatogr. A. 1994;672:125–133.
-
- Mabuchi M., Kano Y., Fukuyama T. Determination of imidapril and imidaprilat in human plasma by high-performance liquid chromatography–electrospray ionization tandem mass spectrometry. J. Chromatogr. B: Biomed. Sci. Appl. 1999;734:145–153. - PubMed
-
- Horimoto S., Mabuchi M., Banno K. Rapid determination of a new angiotensin-converting enzyme inhibitor, imidapril, and its active metabolite in human plasma by negative-ion desorption chemical ionization-tandem mass spectrometry (MS/MS) Chem. Pharm. Bull. 1993;41:699. - PubMed
-
- Yun J., Myung J., Kim H. LC–MS determination and bioavailability study of imidapril hydrochloride after the oral administration of imidapril tablets in human volunteers. Arch. Pharm. Res. 2005;28:463–468. - PubMed
LinkOut - more resources
Full Text Sources
Other Literature Sources
Miscellaneous
