. 2018 Jan 31:6:e4327.
doi: 10.7717/peerj.4327. eCollection 2018.

Evidence for widespread dysregulation of circadian clock progression in human cancer

Affiliations

Evidence for widespread dysregulation of circadian clock progression in human cancer

Jarrod Shilts et al. PeerJ. .

Abstract

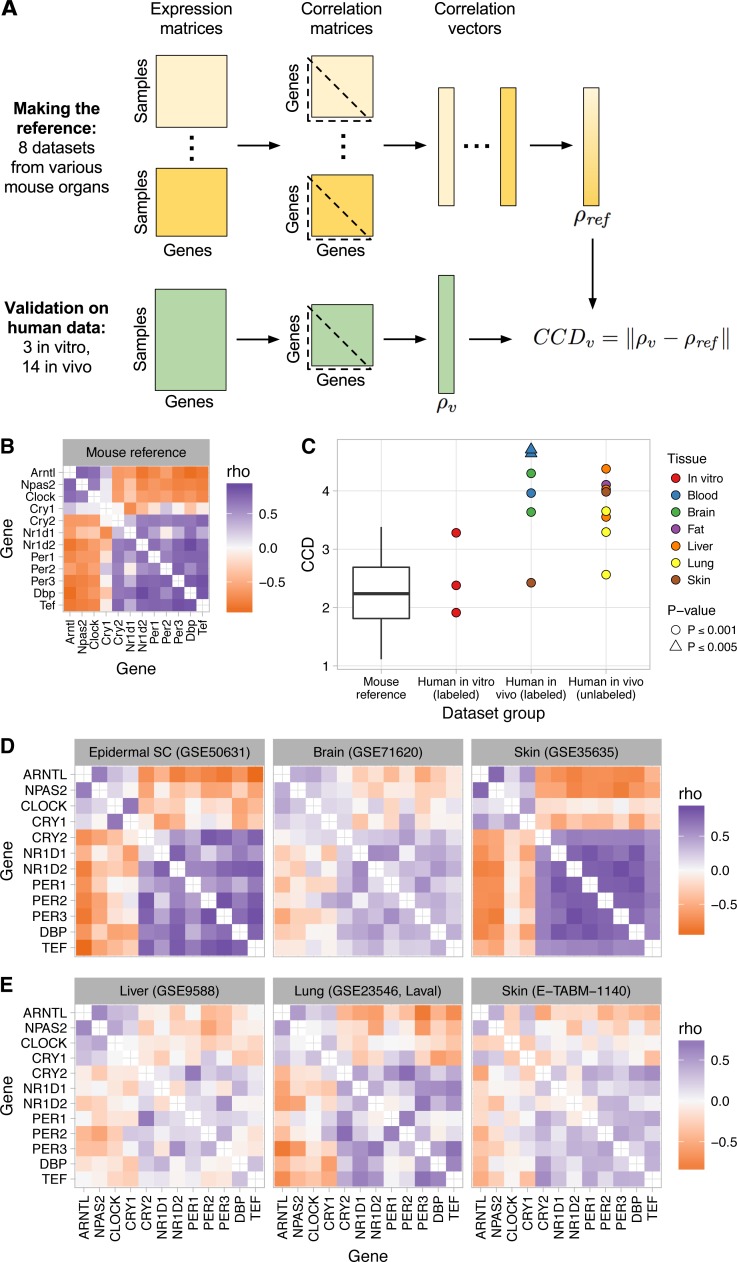
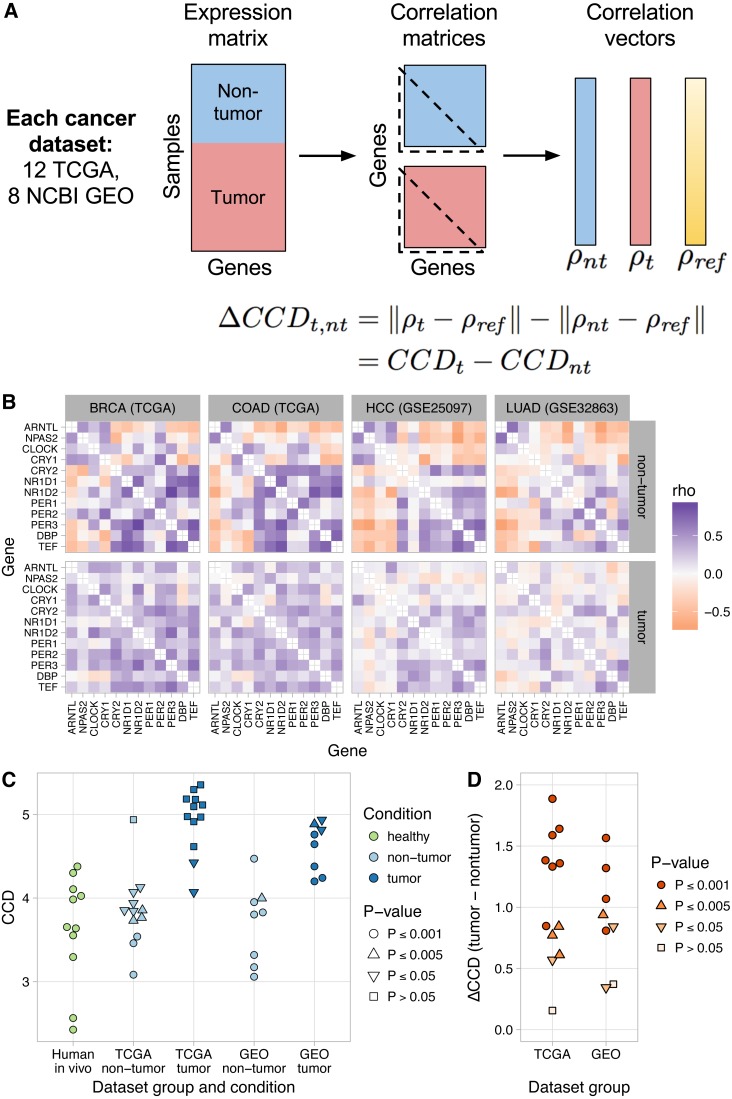
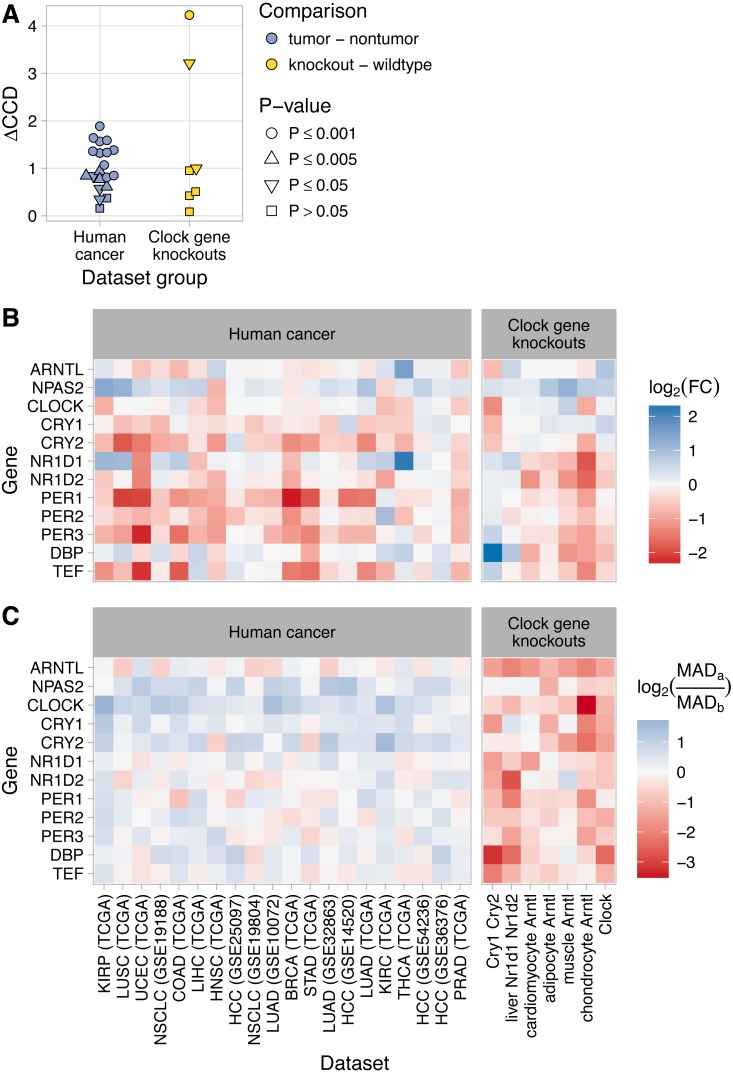
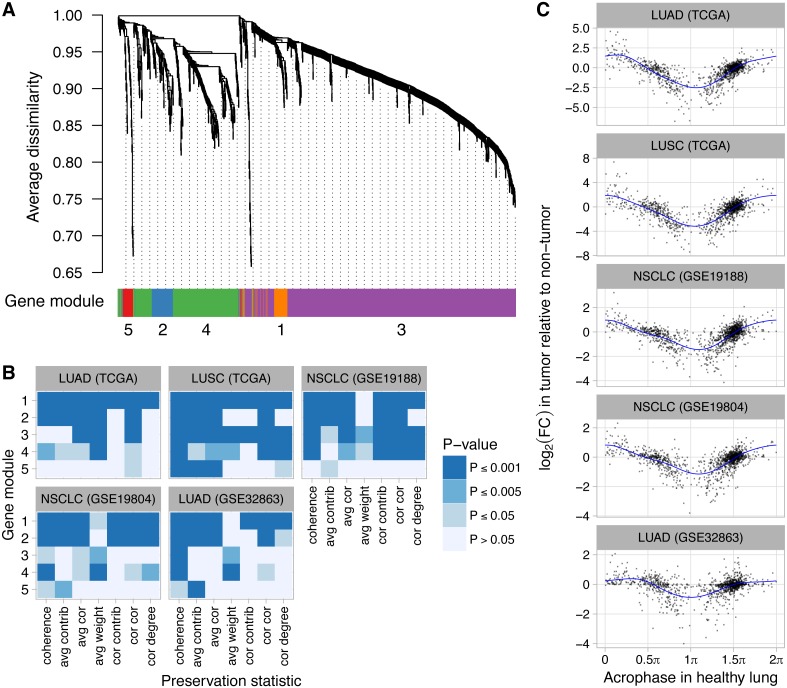
The ubiquitous daily rhythms in mammalian physiology are guided by progression of the circadian clock. In mice, systemic disruption of the clock can promote tumor growth. In vitro, multiple oncogenes can disrupt the clock. However, due to the difficulties of studying circadian rhythms in solid tissues in humans, whether the clock is disrupted within human tumors has remained unknown. We sought to determine the state of the circadian clock in human cancer using publicly available transcriptome data. We developed a method, called the clock correlation distance (CCD), to infer circadian clock progression in a group of samples based on the co-expression of 12 clock genes. Our method can be applied to modestly sized datasets in which samples are not labeled with time of day and coverage of the circadian cycle is incomplete. We used the method to define a signature of clock gene co-expression in healthy mouse organs, then validated the signature in healthy human tissues. By then comparing human tumor and non-tumor samples from twenty datasets of a range of cancer types, we discovered that clock gene co-expression in tumors is consistently perturbed. Subsequent analysis of data from clock gene knockouts in mice suggested that perturbed clock gene co-expression in human cancer is not caused solely by the inactivation of clock genes. Furthermore, focusing on lung cancer, we found that human lung tumors showed systematic changes in expression in a large set of genes previously inferred to be rhythmic in healthy lung. Our findings suggest that clock progression is dysregulated in many solid human cancers and that this dysregulation could have broad effects on circadian physiology within tumors. In addition, our approach opens the door to using publicly available data to infer circadian clock progression in a multitude of human phenotypes.

Keywords: Cancer; Circadian clock; Gene co-expression; Transcriptome.


Conflict of interest statement

The authors declare there are no competing interests.

Figures

Figure 1
Figure 1. Consistent patterns of clock gene co-expression in mice and humans.
(A) Schematic of procedure for constructing a reference pattern of clock gene co-expression from healthy mouse organs and for comparing clock gene co-expression in an independent dataset to the mouse reference using the clock correlation distance (CCD). (B) Heatmap of Spearman correlation (rho) between clock genes for the mouse reference, based on a fixed-effects meta-analysis as described in the Materials and Methods. (C) Clock correlation distance (CCD) for mouse and human datasets. For the boxplot corresponding to the mouse reference, distances were calculated between each pair of datasets (8 datasets give 28 unique pairs; Fig. S3). For human datasets, the CCD was calculated relative to the mouse reference. Example human (labeled) datasets are shown in (D), and example human (unlabeled) datasets are shown in (E). P-value corresponds to the probability that 12 randomly selected genes (instead of the 12 clock genes) could produce a CCD less than or equal to the one observed. (D) Heatmaps of Spearman correlation in three human datasets for which samples are labeled with time of day (or time since synchronization, for GSE50631). (E) Heatmaps for three datasets not designed to study circadian rhythms and for which samples are not labeled with time of day. Heatmaps not shown here are shown in Fig. S6. All heatmaps of clock gene co-expression in Figs. 1 and 2, and the supplemental figures have the same mapping of correlation value to color, so they are directly visually comparable.
Figure 2
Figure 2. Loss of normal clock gene co-expression in human tumor samples from various cancer types.
(A) Schematic of procedure for comparing clock gene co-expression, relative to the mouse reference, between non-tumor and tumor samples from human cancer datasets. (B) Heatmaps of Spearman correlation between clock genes for non-tumor and tumor samples from two TCGA cancer types and two NCBI GEO datasets. Abbreviations: breast invasive cell carcinoma (BRCA), colon adenocarcinoma (COAD), hepatocellular carcinoma (HCC), lung adenocarcinoma (LUAD). Heatmaps for the other 16 human cancer datasets are shown in Fig. S9. (C) Clock correlation distance (CCD) for non-tumor and tumor samples relative to the mouse reference. Each point corresponds to one condition in one dataset. “Human in vivo” corresponds to the human in vivo datasets shown in Fig. 1C (labeled and unlabeled), minus the human blood datasets. P-value corresponds to the probability that 12 randomly selected genes (instead of the 12 clock genes) could produce a CCD less than or equal to the one observed. (D) Delta clock correlation distance ( ΔCCD) between non-tumor and tumor samples in 12 TCGA cancer types and 8 datasets from NCBI GEO. Each point corresponds to one dataset. Positive ΔCCD indicates perturbed clock gene co-expression in tumor samples relative to non-tumor samples. P-value corresponds to the probability that a random permutation of the samples’ condition labels could produce a ΔCCD greater than or equal to the one observed.
Figure 3
Figure 3. Changes in clock gene expression in human cancer are distinct from those caused by knockout of the clock genes in mice.
(A) Delta clock correlation distance (ΔCCD) for human cancer datasets (TCGA and GEO) and for clock gene knockout datasets from mice. (B) Heatmaps of the estimated log2 fold-change in expression between tumor and non-tumor samples or between knockout and wild-type samples. A positive value indicates higher expression in tumor samples or knockout samples, respectively. (C) Heatmaps of the log2 ratio of the median absolute deviation (MAD) of expression in tumor compared to non-tumor samples and knockout compared to wild-type samples. In the legend, MADa refers to tumor or knockout samples, MADb refers to non-tumor or wild-type samples. A positive value indicates that the variation in expression of that gene is greater in tumor (or knockout) samples than in non-tumor (or wild-type) samples. For RNA-seq data (TCGA and chondrocyte Arntl KO), expression values were based on log2 (TPM + 1), where TPM is transcripts per million. For microarray data, expression values were based on log-transformed, normalized intensity. Within each dataset group, datasets are ordered by descending ΔCCD.
Figure 4
Figure 4. Perturbed expression of normally rhythmic genes in human lung cancer.
(A) Hierarchical clustering of 1,292 genes inferred to have a circadian rhythm in healthy human lung. Gene modules were defined by following the procedure recommended by WGCNA. The number of genes in modules 1–5 are 62, 75, 828, 291, and 36. (B) Statistical significance of differential module preservation between non-tumor and tumor samples for seven preservation statistics for each module in each dataset. One-sided p-values are based on 1,000 permutations of the sample labels in the respective test dataset. Abbreviations: lung adenocarcinoma (LUAD), lung squamous cell carcinoma (LUSC), non-small cell lung cancer (NSCLC). (C) Scatterplots of log2 fold-change in each lung cancer dataset vs. the phase of peak expression (acrophase, in radians) in healthy lung. Acrophase π is defined to be the circular mean of the acrophases of the circadian clock-driven PAR bZip transcription factors DBP, TEF, and HLF. Each point corresponds to one of the 1,292 genes. Each blue curve indicates a fit to a periodic smoothing spline. The circular mean of the trough of the spline fits is 1.06π.

Similar articles

Cited by

References

    1. Altman BJ, Hsieh AL, Sengupta A, Krishnanaiah SY, Stine ZE, Walton ZE, Gouw AM, Venkataraman A, Li B, Goraksha-Hicks P, Diskin SJ, Bellovin DI, Simon MC, Rathmell JC, Lazar MA, Maris JM, Felsher DW, Hogenesch JB, Weljie AM, Dang CV. MYC disrupts the circadian clock and metabolism in cancer cells. Cell Metabolism. 2015;22:1009–1019. doi: 10.1016/j.cmet.2015.09.003. - DOI - PMC - PubMed
    1. Anafi RC, Francey LJ, Hogenesch JB, Kim J. CYCLOPS reveals human transcriptional rhythms in health and disease. Proceedings of the National Academy of Sciences of the United States of America. 2017;114:5312–5317. doi: 10.1073/pnas.1619320114. - DOI - PMC - PubMed
    1. Anglani R, Creanza TM, Liuzzi VC, Piepoli A, Panza A, Andriulli A, Ancona N. Loss of connectivity in cancer co-expression networks. PLOS ONE. 2014;9:e87075. doi: 10.1371/journal.pone.0087075. - DOI - PMC - PubMed
    1. Aran D, Sirota M, Butte AJ. Systematic pan-cancer analysis of tumour purity. Nature Communications. 2015;6 doi: 10.1038/ncomms9971. Article 8971. - DOI - PMC - PubMed
    1. Archer SN, Laing EE, Möller-Levet CS, Van der Veen DR, Bucca G, Lazar AS, Santhi N, Slak A, Kabiljo R, Von Schantz M, Smith CP, Dijk D-J. Mistimed sleep disrupts circadian regulation of the human transcriptome. Proceedings of the National Academy of Sciences of the United States of America. 2014;111:E682–E691. doi: 10.1073/pnas.1316335111. - DOI - PMC - PubMed

LinkOut - more resources