. 2018 Feb 2;5(1):ENEURO.0350-17.2018.
doi: 10.1523/ENEURO.0350-17.2018. eCollection 2018 Jan-Feb.

An Essential Postdevelopmental Role for Lis1 in Mice

Affiliations

An Essential Postdevelopmental Role for Lis1 in Mice

Timothy J Hines et al. eNeuro. .

Abstract

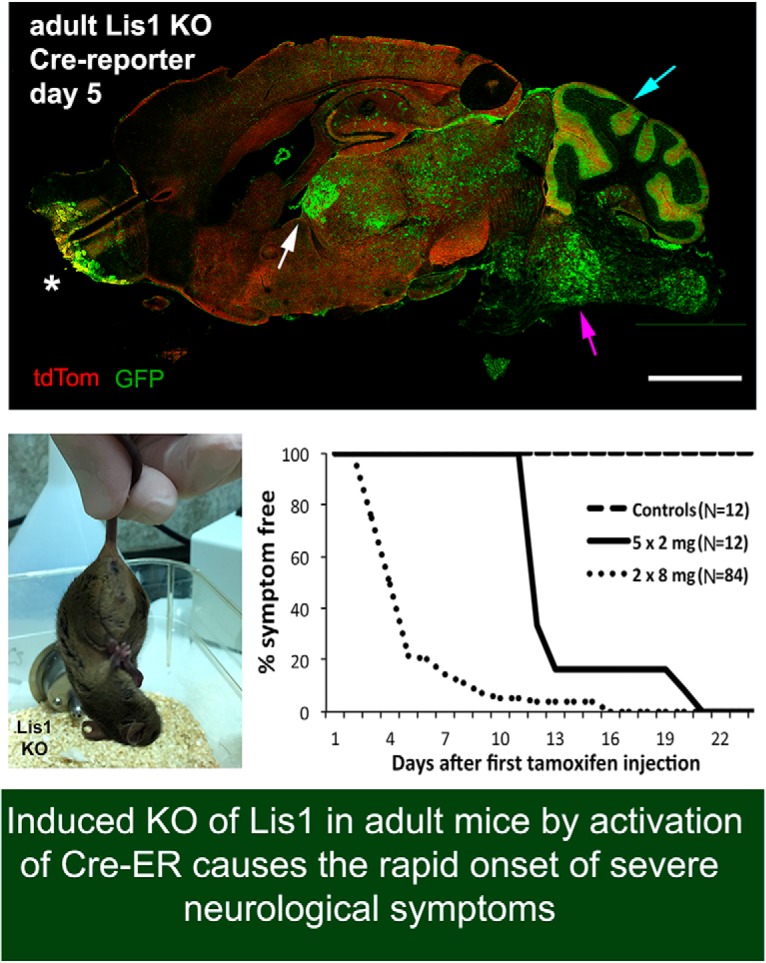
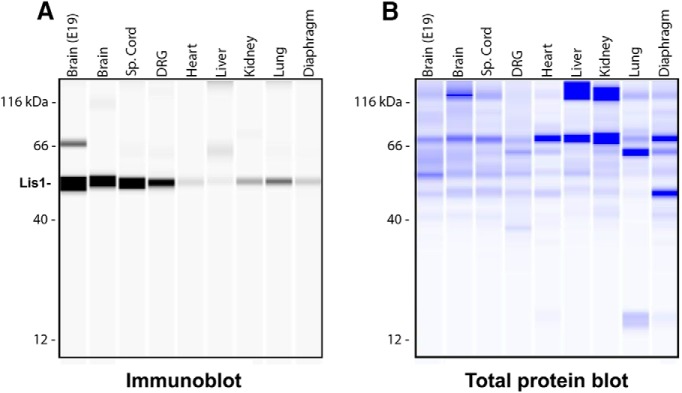
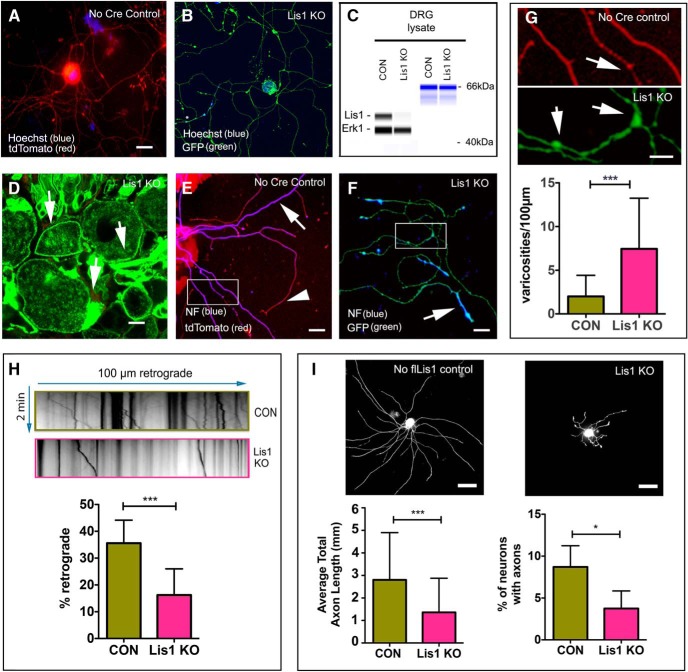
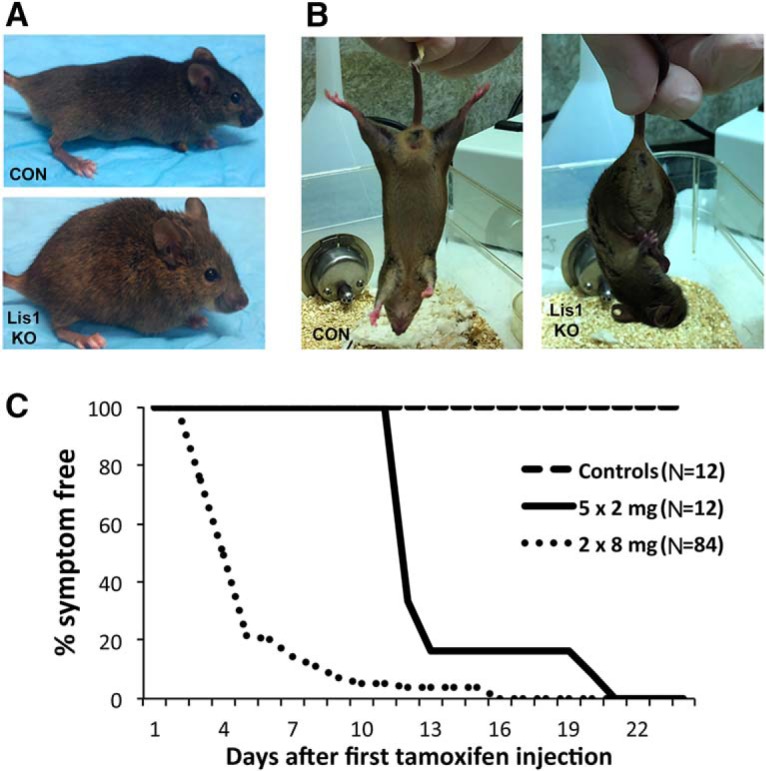
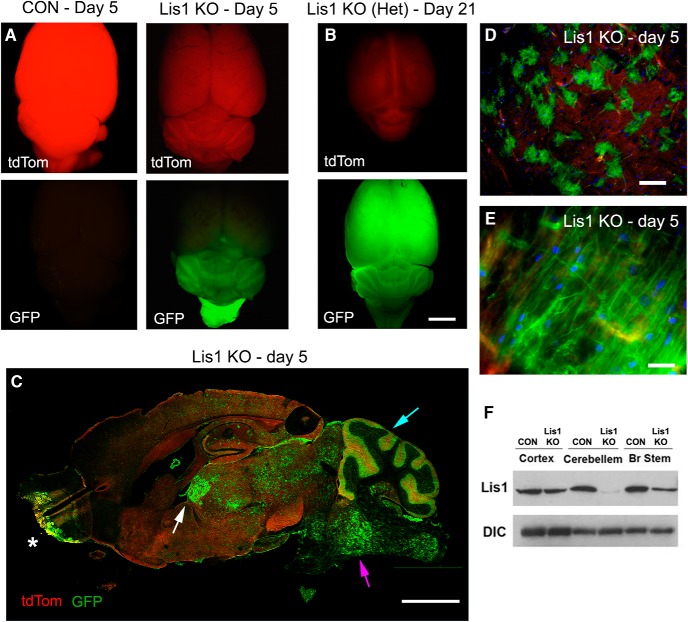
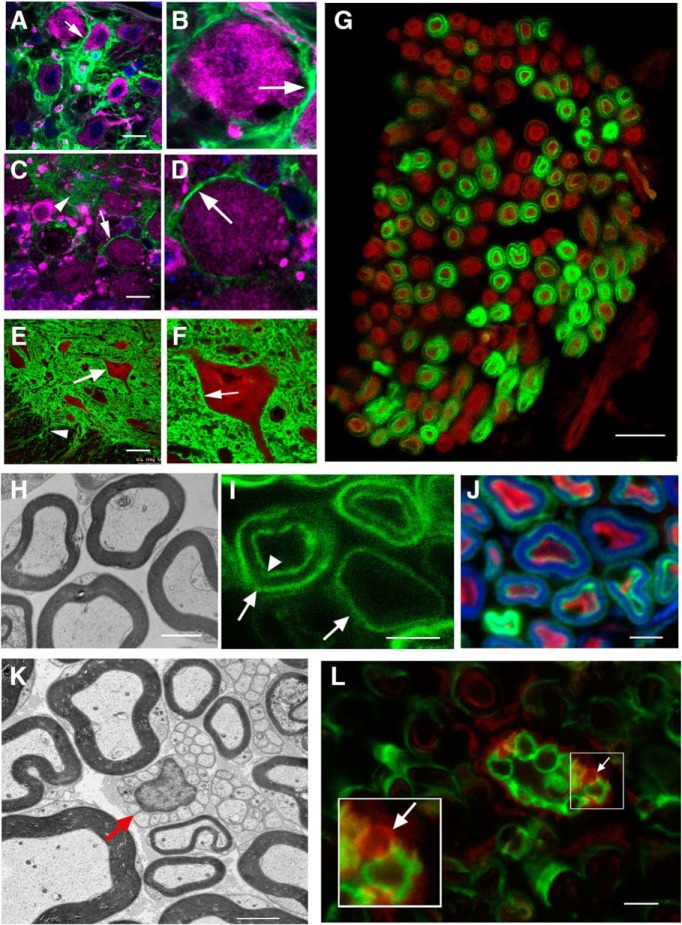
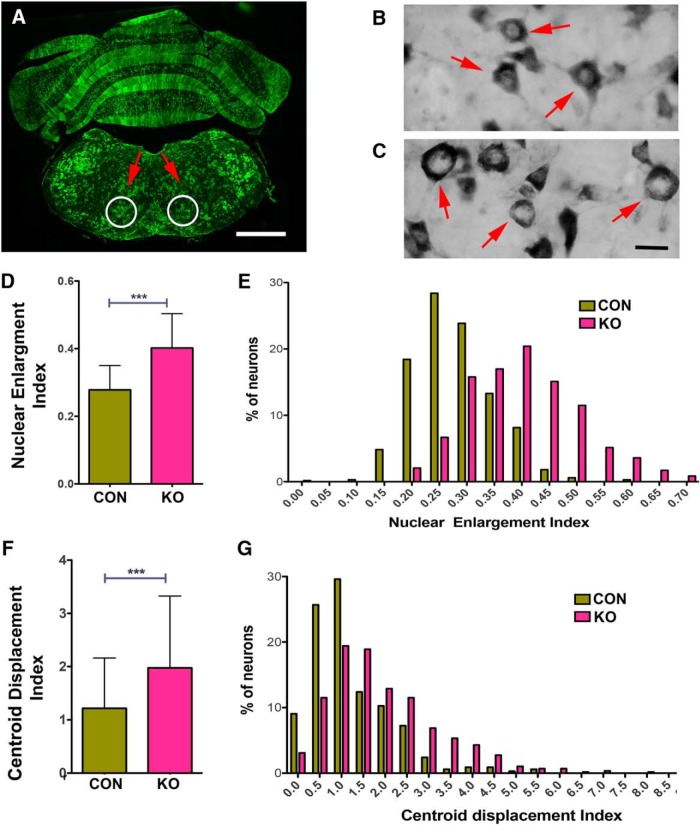
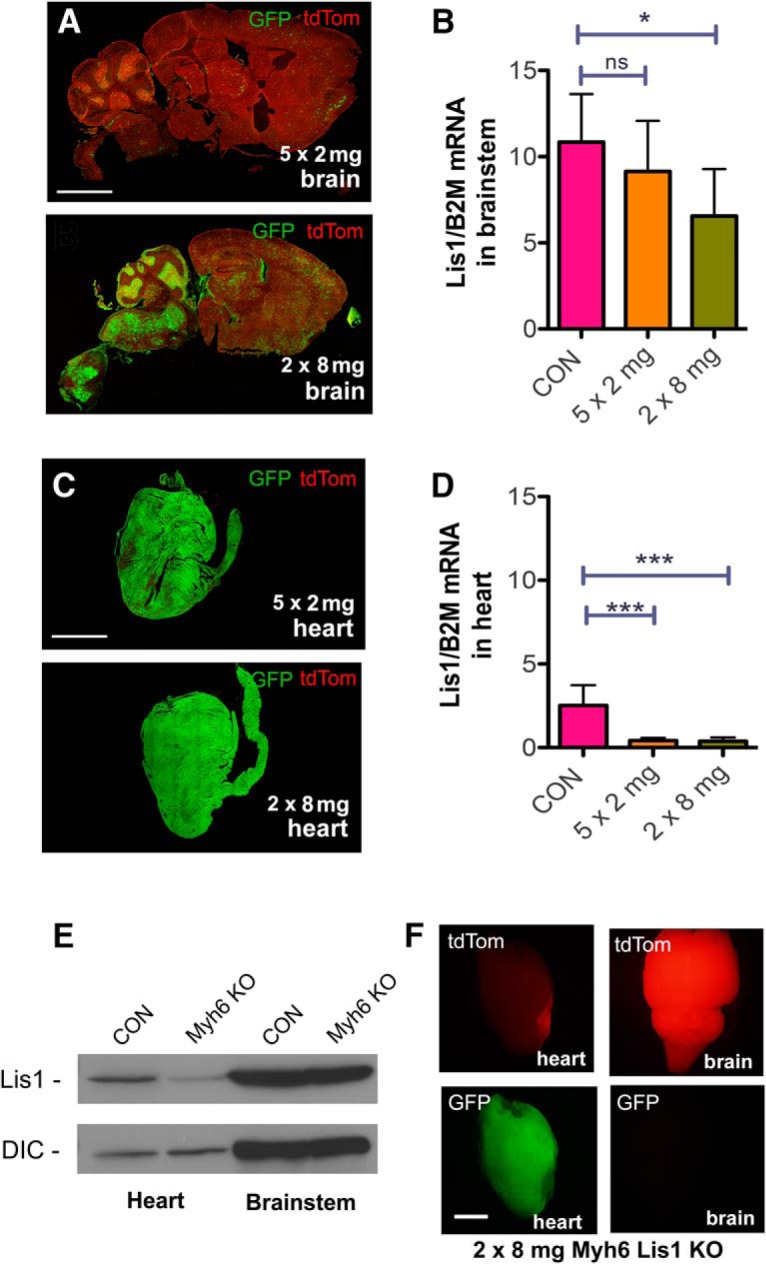
LIS1 mutations cause lissencephaly (LIS), a severe developmental brain malformation. Much less is known about its role in the mature nervous system. LIS1 regulates the microtubule motor cytoplasmic dynein 1 (dynein), and as LIS1 and dynein are both expressed in the adult nervous system, Lis1 could potentially regulate dynein-dependent processes such as axonal transport. We therefore knocked out Lis1 in adult mice using tamoxifen-induced, Cre-ER-mediated recombination. When an actin promoter was used to drive Cre-ER expression (Act-Cre-ER), heterozygous Lis1 knockout (KO) caused no obvious change in viability or behavior, despite evidence of widespread recombination by a Cre reporter three weeks after tamoxifen exposure. In contrast, homozygous Lis1 KO caused the rapid onset of neurological symptoms in both male and female mice. One tamoxifen-dosing regimen caused prominent recombination in the midbrain/hindbrain, PNS, and cardiac/skeletal muscle within a week; these mice developed severe symptoms in that time frame and were killed. A different tamoxifen regimen resulted in delayed recombination in midbrain/hindbrain, but not in other tissues, and also delayed the onset of symptoms. This indicates that Lis1 loss in the midbrain/hindbrain causes the severe phenotype. In support of this, brainstem regions known to house cardiorespiratory centers showed signs of axonal dysfunction in KO animals. Transport defects, neurofilament (NF) alterations, and varicosities were observed in axons in cultured DRG neurons from KO animals. Because no symptoms were observed when a cardiac specific Cre-ER promoter was used, we propose a vital role for Lis1 in autonomic neurons and implicate defective axonal transport in the KO phenotype.

Keywords: Lis1; axonal transport; brainstem; cytoplasmic dynein; knockout mouse; neurological disease.


Figures

None
Graphical abstract
Figure 1.
Figure 1.
Lis1 protein is expressed in adult mouse tissues. A total of 1 µg of tissue lysates was analyzed using the Wes Simple Western System. Brain extracts from E19 were loaded as a positive control. All other extracts are from two-month-old animals. The size-based separation is processed by Compass software and displayed as virtual blots/gels. A, Immune detection of Lis1 in protein samples, depicted in a virtual immunoblot generated by the system. B, Total protein detection, visualized by a virtual Coomassie gel generated by the system. These blots are representative of three experimental repeats (N = 3).
Figure 2.
Figure 2.
Lis1 KO impacts axonal function in adult mouse DRG neurons. A, Cultured DRG neurons from no Cre control exposed to 4-OH tamoxifen for 5 d expressed only tdTomato (red) showing no signs of recombination. B, In contrast, Lis1 KO neurons had strong GFP expression (green) demonstrating recombination. C, 4-OH tamoxifen reduced Lis1 protein levels in Lis1 KO neurons relative to no Cre control neurons (CON). D, Intraperitoneal injection of 2 × 8 mg tamoxifen in Lis1 KO mice resulted in GFP expression in intact DRGs after 4 d. Arrows point to DRG plasma membranes. E, Cultured DRG neurons prepared from intraperitoneally injected, no Cre control animals expressed only tdTomato (red). NF (blue) was prominent along axon shafts (white arrow) but less prominent in axon terminals (arrowhead). F, DRG neurons prepared from intraperitoneally injected Lis1 KO mice continued to express GFP (green) in culture, and NF (blue) was most prominent in distal axons and enriched in in varicosities (arrow). G, Insets from E, F have been digitally enlarged to show axonal varicosities (arrows). The bar graph in G shows the average number of varicosities per 100 µm of axon from N = 3 CON (45 mm total axon length) and three Lis1 KO (27 mm total axon length) mice. H, Kymographs were generated from time-lapse movies of LysoTracker labeled organelles in GFP-positive axons. The bar graph shows the percentage moving retrogradely in Lis1 KO and no flLis1 control cultures (CON). A total of 27 100 µm axon segments were analyzed from N = 2 CON and N = 2 Lis1 KO mice. A total of n = 521 control and n = 699 KO organelles were analyzed. I, Cultured DRG neurons prepared from intraperitoneally injected, no flLis1 control and Lis1 KO mice were immunostained with neuron-specific antibodies, and the percentage of neurons with growing axons was determined from N = 4 CON and N = 5 Lis1 KO mice. A total of n = 2219 control neurons and n = 2410 Lis1 KO neurons were analyzed. Bars in G-I indicate mean ± SD. Significance determined by Mann–Whitney test (G), Student’s t test (H, I), *p < 0.05, ***p < 0.001 (see Table 2 for details). Scale bars: 20 µm (A, D, E), 5 µm (B), and 50 µm (I).
Figure 3.
Figure 3.
Lis1 KO via intraperitoneal tamoxifen injection in adult mice results in a severe phenotype. Lis1 KO mice exposed to tamoxifen invariably displayed spinal kyphosis (A, lower panel) and hind leg clasping (B, right panel). Neither was observed in control animals (CON) at any time. This includes the no Cre, no flLis1, Lis1 KO het, or mock-injected Lis1 KO animals. Both Lis1 KO and control mice were killed as soon as kyphosis and leg clasping became apparent in the KO animals. Phenotypes arose with latencies depending on the specific tamoxifen-dosing regimen (see Materials and Methods). C, Symptom-free survival curves show that the latency is shorter for the 2 × 8 mg regimen (N = 84) compared to the 5 × 2 mg regimen (N = 12). Control mice were killed at the same time as the Lis1 KO mice for recombination and expression studies. However, six no Cre control mice and six no flLis1 control mice receiving the 2 × 8 mg dosing regimen survived symptom free for three weeks before they were killed (total N = 12).
Figure 4.
Figure 4.
Cre-dependent recombination in the brain after tamoxifen injection. All data in this figure are representative of observations from a minimum of N = 4 animals of each genotype. A, On day 5 after the 2 × 8 mg tamoxifen regimen, no Cre control brains (CON, day 5) had bright dtTomato fluorescence (top left panel), but no GFP fluorescence indicative of recombination (lower left panel). Lis1 KO mice (Lis1 KO, day 5) showed reduced dtTomato fluorescence (top right panel) and expressed EGFP primarily in the hindbrain, indicating that Cre activity was pronounced in this brain region (lower right panel). B, Lis1 KO het mice [Lis1 KO (Het), day 21], which showed no sign of neurologic problems through day 21 after the injection had substantial GFP expression throughout the brain at that time. C, A sagittal section of a Lis1 KO brain on day 5 (Lis1 KO, day 5) shows mosaic recombination in midbrain (white arrow), hindbrain (magenta arrow), and cerebellum (blue arrow), with widely scattered GFP-positive cells in cortex and hippocampus. Recombination also occurs in olfactory bulb (asterisk). D, Using higher magnification, GFP-positive cells in the midbrain can be seen interspersed with cells that have not yet undergone recombination. E, Fibers labeled with GFP are clearly visible in the brainstem. F, Lis1 expression is reduced in extracts from brainstem and cerebellum of Lis1 KO mice compared to no Cre controls. Scale bars: 5 mm (A–C), 100 µm (D), and 20 µm (E).
Figure 5.
Figure 5.
Both neurons and glia show evidence Cre-dependent recombination. All data in this figure are representative of observations from a minimum of N = 4 animals of each genotype. A, GFP-positive neuropil surrounds MAP2-positive neurons (magenta) in a brainstem region thought to be the nucleus ambiguous in a mouse exposed to the 2 × 8 mg tamoxifen regimen. B, The neuron indicated in A has been digitally enlarged to show details. The arrow points to possible neuronal plasma membrane. C, Purkinje cells in the cerebellum stained with MAP2 (magenta) also have GFP-positive plasma membranes (white arrow) indicating that recombination occurred in these neurons. Neuropil in the molecular layer is also GFP-positive (arrowhead). D, The neuron in C has been digitally enlarged to show detail. E, GFP-positive neuropil surrounds a motor neuron (white arrow) labeled with ChAT (red) in the anterior horn of the thoracic spinal cord. GFP-positive fibers (arrowhead) can be seen coursing toward the ventral root. F, The motor neuron indicated in E is digitally enlarged to show detail. The white arrow points to apparent neuronal plasma membrane. G, A cross section through the phrenic nerve shows concentric rings of GFP around approximately half of the NF-positive axons (red). H, EM of a cross section through a WT mouse nerve showing myelinated axons. I, GFP can be observed as two concentric rings or single rings (arrows, outer ring, arrowhead, inner ring). J, The area between concentric rings is positive for myelin basic protein (blue), while the inside of the inner ring is positive for NF (red). K, EM of a cross section of WT mouse sciatic nerve showing Remak bundles of unmyelinated axons surrounded by a single glial cell (red arrow). L, Cross section of sciatic nerve from Lis1 KO mouse with a Remak bundle containing some GFP-encircled axons, and some without encircling GFP (arrow, positive for tdTomato only). Inset is digitally enlarged to show an axon without recombination (red, arrow) alongside recombined axons (green). Scale bars: 10 µm (A, C, G), 30 µm (E), and 2 µm (H–L).
Figure 6.
Figure 6.
Brainstem neurons in Lis1 KO mice exhibit signs of chromatolysis. A, A coronal section through the hindbrain on day 4 after the 2 × 8 mg tamoxifen regimen shows extensive recombination in the ventral brainstem containing cardiorespiratory centers. White circles indicate the region used in the analyses of chromatolysis. B, C, Sections were stained with toluidine blue to determine the size and position of the nucleus in neurons in the indicated regions. The neurons in B are from a no flLis1 control mouse. The neurons in C are from a Lis1 KO animal. D, A nuclear enlargement index (see Materials and Methods) was used to compare nuclear enlargement in no flLis1 controls (CON) and Lis1 KO (KO). E, The histogram shows the distribution of this index in CON and Lis1 KO neurons. F, The position of the nucleus within the soma was also determined using the centroid displacement index (see Materials and Methods). This involves determining the centroid position of both the nucleus and soma and calculating the total displacement distance (µm) of the nuclear centroid from the somal centroid. G, Histogram showing the distribution of CDI found in CON and KO neurons. Bars indicate mean ± SD. Brainstem sections from three no flLis1 control and four Lis1 KO mice were used in the chromatolysis study. This includes analysis of 331 control neurons and 583 Lis1 KO neurons. Significance determined by Student’s t test (D), or Mann–Whitney test (F); ***p < 0.001 (see Table 2 for details). Scale bars: 1 mm (A) and 10 µm (B, C).
Figure 7.
Figure 7.
Comparing the effect of Lis1 KO in brainstem and heart. A, Sagittal brain sections of Lis1 KO mice 5 d after the initial injection of either five injections of 2 mg tamoxifen (top) or two injections of 8 mg tamoxifen (bottom). The 2 × 8 mg treatment resulted in much higher GFP expression than the 5 × 2 mg treatment, particularly in the brainstem and cerebellum. B, Lis1 mRNA levels normalized to B2M mRNA levels from brainstem of no Cre control mice injected with 2 × 8 mg tamoxifen (CON), and Lis1 KO mice injected with either 5 × 2 or 2 × 8 mg tamoxifen. Lis1 mRNA levels were significantly decreased in brainstem of 2 × 8 mg animals, but not 5 × 2 mg animals, relative to no Cre controls, 5 d after initial injection. C, Sections of heart from 5 × 2 mg (top)- and 2 × 8 mg (bottom)-treated Lis1 KO mice. Both the 2 × 8 and 5 × 2 mg treatments resulted in similar levels of GFP expression in heart. D, Lis1 mRNA levels normalized to B2M mRNA levels from heart of 2 × 8 mg-injected no Cre control (CON)-, 5 × 2 mg-, and 2 × 8 mg-treated mice. Lis1 mRNA levels were reduced significantly in both the 5 × 2 mg- and 2 × 8 mg-treated mice relative to the no Cre control but were not significantly different from each other. E, Western blotting of brainstem and heart lysates from cardiomyocyte-specific Myh6 KO mice show reduced levels of Lis1 protein in heart, but not brainstem compared to no Cre control mice (CON). Dynein intermediate chain (DIC) was used as a loading control. F, Whole mount brain (right) and heart (left) from Myh6 KO mouse show recombination (GFP) in heart but not brain. Data in A, C, E, F are representative images from N = 3 mice for each genotype. The RNA quantification in B, D represent mean of data from N = 3 animals of each treatment and genotype ± SD. Significance in B, D determined by one-way ANOVA; *p < 0.05, ***p < 0.001 (see Table 2 for details). Scale bars: 5 mm (A, C) and 2 mm (F).

References

    1. Ahmad FJ, He Y, Myers KA, Hasaka TP, Francis F, Black MM, Baas PW (2006) Effects of dynactin disruption and dynein depletion on axonal microtubules. Traffic 7:524–537. 10.1111/j.1600-0854.2006.00403.x - DOI - PubMed
    1. Ayloo S, Guedes-Dias P, Ghiretti AE, Holzbaur ELF (2017) Dynein efficiently navigates the dendritic cytoskeleton to drive the retrograde trafficking of BDNF/TrkB signaling endosomes. Mol Biol Cell 28:2543–2554. - PMC - PubMed
    1. Baumbach J, Murthy A, McClintock MA, Dix CI, Zalyte R, Hoang HT, Bullock SL (2017) Lissencephaly-1 is a context-dependent regulator of the human dynein complex. Elife 6 10.7554/eLife.21768 - DOI - PMC - PubMed
    1. Ben-Yaakov K, Dagan SY, Segal-Ruder Y, Shalem O, Vuppalanchi D, Willis DE, Yudin D, Rishal I, Rother F, Bader M, Blesch A, Pilpel Y, Twiss JL, Fainzilber M (2012) Axonal transcription factors signal retrogradely in lesioned peripheral nerve. EMBO J 31:1350–1363. 10.1038/emboj.2011.494 - DOI - PMC - PubMed
    1. Cragg BG (1970) What is the signal for chromatolysis? Brain Res 23:1–21. - PubMed

Publication types

MeSH terms

Substances

LinkOut - more resources