. 2018 Jan 18;2(2):211-222.
doi: 10.1002/hep4.1135. eCollection 2018 Feb.

Acute decompensation boosts hepatic collagen type III deposition and deteriorates experimental and human cirrhosis

Affiliations

Acute decompensation boosts hepatic collagen type III deposition and deteriorates experimental and human cirrhosis

Michael Praktiknjo et al. Hepatol Commun. .

Abstract

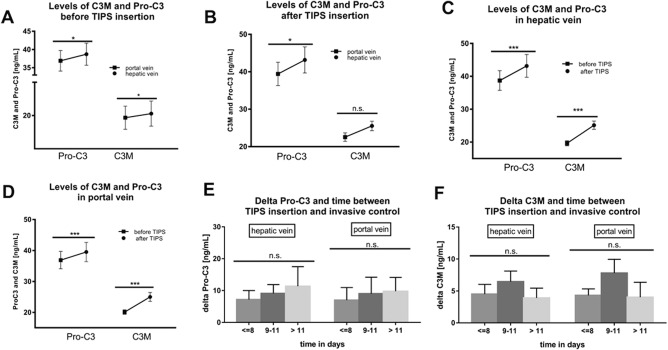
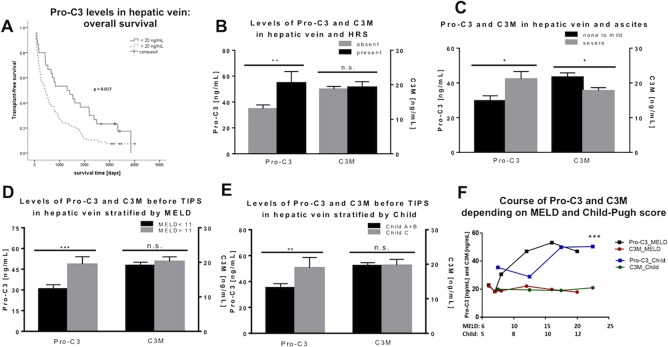
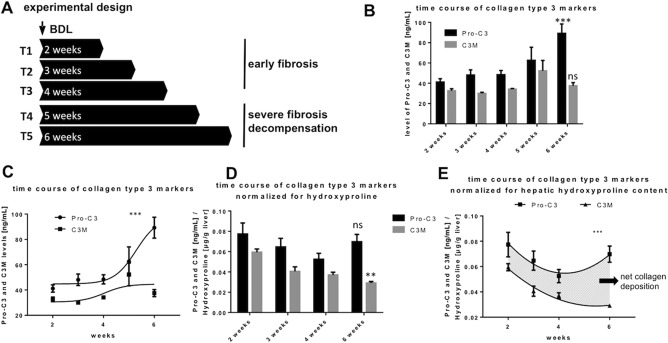
Patients with end-stage liver disease develop acute decompensation (AD) episodes, which become more frequent and might develop into acute-on-chronic liver failure (ACLF). However, it remains unknown how AD induces acceleration of liver disease. We hypothesized that remodeling of collagen type III plays a role in the acceleration of liver cirrhosis after AD and analyzed its formation (Pro-C3) and degradation (matrix metalloproteinase-degraded type III collagen [C3M]) markers in animal models and human disease. Bile duct ligation induced different stages of liver fibrosis in rats. Fibrosis development (hydroxyprolin content, sirius red staining, α-smooth muscle actin immunohistochemistry, messenger RNA of profibrotic cytokines), necroinflammation (aminotransferases levels), fibrolysis (matrix metalloproteinase 2 expression and activity, C1M, C4M), and Pro-C3 and C3M were analyzed 2, 3, 4, 5, and 6 weeks after bile duct ligation (n = 5 each group). In 110 patients with decompensated liver cirrhosis who underwent a transjugular intrahepatic portosystemic shunt procedure for AD, clinical and laboratory parameters as well as Pro-C3 and C3M were measured in blood samples from portal and hepatic veins and were collected just before the transjugular intrahepatic portosystemic shunt placement and 1-3 weeks later. Animal studies showed increased markers of collagen type III deposition with fibrosis, necroinflammation, and decompensation of liver cirrhosis, defined as ascites development. Higher Pro-C3 levels were associated with injury, disease severity scores (Model for End-Stage Liver Disease, Child-Pugh, chronic liver failure-C AD), ACLF development, and mortality. C3M decreased with AD and the chronic liver failure-C AD score. Collagen type III deposition ratio increased with the risk of ACLF development and mortality. Conclusion: We show for the first time that AD boosts collagen type III deposition in experimental and human cirrhosis, possibly contributing to the worsened outcome in patients with decompensated cirrhosis. (Hepatology Communications 2018;2:211-222).


Figures

Figure 1
Figure 1
Evolution of levels of Pro‐C3 and C3M before and after TIPS. (A) Before the TIPS procedure, levels of Pro‐C3 and C3M were significantly higher in the hepatic vein compared to the portal vein (P < 0.05). (B) After TIPS, Pro‐C3 levels were significantly higher in the hepatic vein compared to the portal vein (P < 0.05), while the difference for C3M did not reach statistical significance. A significant increase in Pro‐C3 and C3M levels after the TIPS procedure was demonstrated in (C) for the hepatic vein and (D) for the portal vein (P < 0.001). (E) C3M and (F) Pro‐C3 levels over time after TIPS (<8, 9‐11, and >11 days) as they did not change significantly (P > 0.05). *P < 0.05, **P < 0.01, ***P < 0.001; data represent mean ± SEM. Abbreviation: n.s., not significant.
Figure 2
Figure 2
Pro‐C3 and C3M levels in the hepatic vein and their relationship with severity of human cirrhosis. (A) Kaplan‐Meier stratified for Pro‐C3 levels at a threshold of 20 ng/mL in the hepatic vein. (B) Pro‐C3 and C3M levels in the hepatic vein in patients with and without previous episodes of HRS. (C‐E) Higher Pro‐C3 levels in the hepatic vein and lower levels of C3M in patients with (C) severe ascites. Higher Pro‐C3 levels in patients with (D) higher MELD score (<11) and (E) Child‐Pugh C score, while C3M levels did not change significantly. (F) Distribution of Pro‐C3 and C3M levels according to MELD and Child‐Pugh scores. A significant divergence of Pro‐C3 and C3M curves is demonstrated. *P < 0.05, **P < 0.01, ***P < 0.001; data represent mean ± SEM. Abbreviation: n.s., not significant.
Figure 3
Figure 3
Levels of Pro‐C3 and C3M with severity of experimental fibrosis in BDL‐rats. (A) Experimental design of the rodent studies with sacrifice at 5 different time points, T1‐3 representing early stages of fibrosis, T4‐5 representing decompensated fibrosis of the liver. (B) Levels of Pro‐C3 and C3M at different time points of sacrifice. Pro‐C3 increased significantly in severe stages of fibrosis. C3M did not change significantly. (C) Significant divergence of levels of Pro‐C3 and C3M with increasing severity of fibrosis. (D) Levels of Pro‐C3 and C3M at different time points of sacrifice normalized for hydroxyproline content per gram of liver tissue. C3M decreased significantly in severe stages of fibrosis. Pro‐C3 did not change significantly. (E) Significant divergence of levels of Pro‐C3 and C3M with increasing severity of fibrosis. The area between the curves represents net collagen type III deposition in the liver (shaded area). *P < 0.05, **P < 0.01, ***P < 0.001; data represent mean ± SEM. Abbreviation: ns, not significant.
Figure 4
Figure 4
Pro‐C3/C3M ratio and disease severity in TIPS patients. (A) Significantly higher Pro‐C3/C3M ratio in patients with HRS. (B) Significantly higher Pro‐C3/C3M ratio in patients with severe ascites. (C) Patients with MELD score >11 and Child‐Pugh C show a significantly higher Pro‐C3/C3M ratio. (D) Significantly higher Pro‐C3/C3M ratio in patients with CLIF‐C AD score >49.5, and patients with Pro‐C3‐/C3M ratio >1.5 show significantly higher CLIF‐C AD scores. (E) Significant correlation of Pro‐C3/C3M ratio with ACLF. (F) Kaplan‐Meier stratified for Pro‐C3/C3M ratio at a threshold of 1.5 in the hepatic vein. *P < 0.05, **P < 0.01, ***P < 0.001; data represent mean ± SEM.

References

    1. Chirapongsathorn S, Talwalkar JA, Kamath PS. Readmission in cirrhosis: a growing problem. Curr Treat Options Gastroenterol 2016;14:236‐246. - PubMed
    1. Friedman SL. Mechanisms of hepatic fibrogenesis. Gastroenterology 2008;134:1655‐1669. - PMC - PubMed
    1. Bataller R, Brenner DA. Liver fibrosis. J Clin Invest 2005;115:209‐218. - PMC - PubMed
    1. Jansen C, Leeming DJ, Mandorfer M, Byrjalsen I, Schierwagen R, Schwabl P, et al. PRO‐C3‐levels in patients with HIV/HCV‐Co‐infection reflect fibrosis stage and degree of portal hypertension. PloS One 2014;9:e108544. - PMC - PubMed
    1. Leeming DJ, Anadol E, Schierwagen R, Karsdal MA, Byrjalsen I, Nielsen MJ, et al. Combined antiretroviral therapy attenuates hepatic extracellular matrix remodeling in HIV patients assessed by novel protein fingerprint markers. AIDS 2014. 10;28:2081‐2090. - PubMed