. 2018 Feb 14;17(2):127-179.
doi: 10.1039/c7pp90043k.

Environmental effects of ozone depletion, UV radiation and interactions with climate change: UNEP Environmental Effects Assessment Panel, update 2017

Affiliations

Environmental effects of ozone depletion, UV radiation and interactions with climate change: UNEP Environmental Effects Assessment Panel, update 2017

A F Bais et al. Photochem Photobiol Sci. .

Abstract

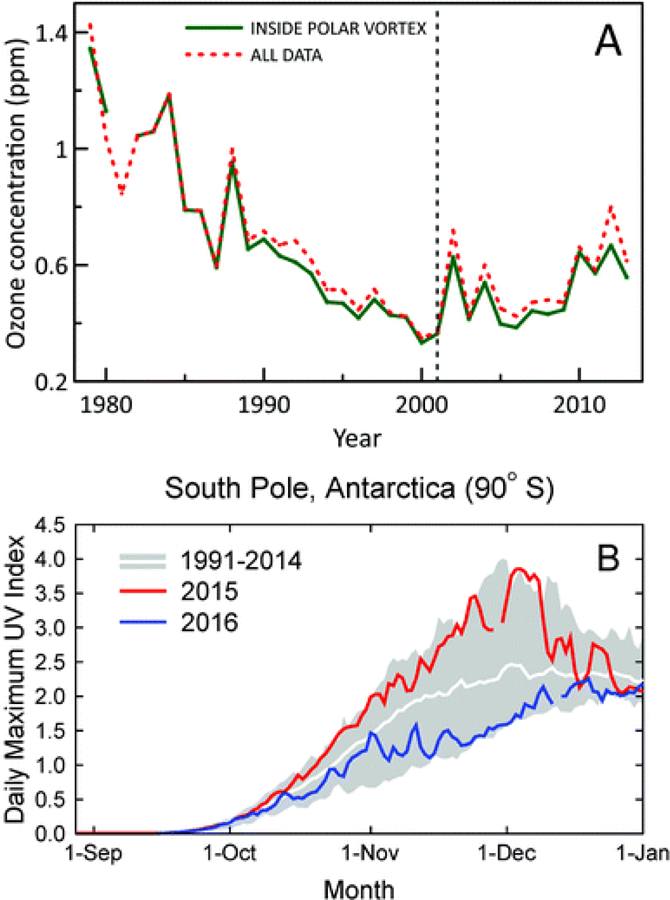
The Environmental Effects Assessment Panel (EEAP) is one of three Panels of experts that inform the Parties to the Montreal Protocol. The EEAP focuses on the effects of UV radiation on human health, terrestrial and aquatic ecosystems, air quality, and materials, as well as on the interactive effects of UV radiation and global climate change. When considering the effects of climate change, it has become clear that processes resulting in changes in stratospheric ozone are more complex than previously held. Because of the Montreal Protocol, there are now indications of the beginnings of a recovery of stratospheric ozone, although the time required to reach levels like those before the 1960s is still uncertain, particularly as the effects of stratospheric ozone on climate change and vice versa, are not yet fully understood. Some regions will likely receive enhanced levels of UV radiation, while other areas will likely experience a reduction in UV radiation as ozone- and climate-driven changes affect the amounts of UV radiation reaching the Earth's surface. Like the other Panels, the EEAP produces detailed Quadrennial Reports every four years; the most recent was published as a series of seven papers in 2015 (Photochem. Photobiol. Sci., 2015, 14, 1-184). In the years in between, the EEAP produces less detailed and shorter Update Reports of recent and relevant scientific findings. The most recent of these was for 2016 (Photochem. Photobiol. Sci., 2017, 16, 107-145). The present 2017 Update Report assesses some of the highlights and new insights about the interactive nature of the direct and indirect effects of UV radiation, atmospheric processes, and climate change. A full 2018 Quadrennial Assessment, will be made available in 2018/2019.


Conflict of interest statement

Conflicts of interest

The opinions expressed in this report are those of the authors alone. Richard Zepp notes that this Perspective article has been reviewed in accordance with the U.S. Environmental Protection Agency’s (U.S. EPA) peer and administrative review policies and approved for publication. Mention of trade names or commercial products does not constitute an endorsement or recommendation for use by the U.S. EPA.

Figures

Fig. 1
Fig. 1
(A) Time evolution of October, November, and December average concentrations of ozone in the lower stratosphere (about 10–20 km) over Antarctica derived from ozonesonde measurements at 11 stations (red-dashed line). Average concentrations derived from measurements inside the polar vortex are shown separately (green-solid line). Figure redrawn from ref. . (B) Daily maximum UV Index measured at the South Pole in 2015 (red line) and 2016 (blue line) compared with the average (white line) and the lowest and highest values (grey shading) of observations performed between 1990 and 2014. Measurements between mid-October and mid-December of 2015 and 2016 were, respectively, close to the upper and lower limits of historical observations. The figure is adapted from ref. and updated with data from 2016.
Fig. 2
Fig. 2
Spectral dependence of effects of clouds on solar UV radiation in terms of the cloud modification factor (CMF, defined as the ratio of measured irradiance to calculated clear-sky irradiance). The figure shows the relationship between CMF in the UV-B and UV-B regions derived from many measurements at Mauna Loa Observatory, Hawaii. Events of attenuation by clouds correspond to CMF < 1 (lower left), while events of enhancement by clouds correspond to CMF > 1 (upper right). Updated from ref. .
Fig. 3
Fig. 3
Estimates of the incidence (new diagnoses) of cutaneous malignant melanoma for selected locations, from the Global Burden of Disease Study, 2016 (note that these estimates are not adjusted for the differing age distributions of the populations).
Fig. 4
Fig. 4
The graph shows the effectiveness of sunscreen of different sun protection factors (SPF) for preventing sunburn. The dose of UV radiation (x-axis) is presented in units of the dose that will cause minimal erythema (MED) of the skin. The y-axis is the percentage of a sunburning dose (1 MED) that will be received by the skin, using sunscreens of different SPF. With no sunscreen (SPF = 1) a dose of UV radiation of 1 MED results in 100% of the dose required to cause sunburn. With successively higher SPF sunscreens, the dose of UV radiation required to reach 1 MED (100% of a sunburning dose) increases. Adapted from ref. .
Fig. 5
Fig. 5
The figure shows the skin coverage following application of sunscreen. Body areas covered in sunscreen appear dark, while the red colour shows skin surfaces not covered by sunscreen. The photographs were taken using standardised UV photography (UVP) that is sensitive only to the UV-A part of the spectrum. The sunscreen used absorbs incoming UV-A radiation. Therefore, body areas covered with these UV-A filters appear dark in UVP images. (Photograph from ref. reproduced with permission).
Fig. 6
Fig. 6
The Antarctic ozone ‘hole’ (A) and its impact on Southern Hemisphere atmospheric and oceanic circulation. Stratospheric ozone depletion and resultant cooling over Antarctica have pulled the polar jet stream towards the South (B). The speed of the jet has also increased (see ref. for details). The polar shift in the jet and its increased strength have changed atmospheric and oceanic circulation throughout the Southern Hemisphere (B). These changes are manifest in a mode of variability called the Southern Annular Mode (SAM). The atmosphere can be envisioned as balancing on a seesaw that is shifting up and down between the polar latitudes (south of 60°S) and a latitude band between 40–55°S. The seesaw moves up and down with changes in mean sea level pressure (MSLP). As it pivots, the large cells that drive the winds and precipitation move towards or away from Antarctica. When MSLP around Antarctica falls, the westerlies are strong, and SAM is in its positive mode; when MSLP rises over those same regions, the westerlies weaken, and SAM is in its negative mode. Over the past century, increasing greenhouse gases and depletion of ozone have pushed the SAM towards its more positive phase (black arrow in B). The main effects of the ozone ‘hole’-induced positive phase of the SAM on the Southern Ocean are shown in C. The strengthening of the polar jet enhances the Antarctic Circumpolar Current and the associated overturning circulation (large blue-edged arrows). This drives increased upwelling of deep carbon-rich water and reduces the ability of the Southern Ocean to act as a sink for CO2. South of the polar jet stream, temperatures have decreased (blue), while to the North, temperatures have increased (red). The mean SAM index is now at its highest level for at least 1000 years. As a result, precipitation at high latitudes has increased and the mid-latitude dry-zone has moved south (see ref. and 163). Clouds indicate areas with increased precipitation (over the equator and at the pole). (A. and B. were redrawn from ref. and with the ozone ‘hole’ over Antarctica in September 2017 reproduced from NASA Ozone Watch. C. was reproduced from ref. 162).
Fig. 7
Fig. 7
Plants growing in high elevation tropical alpine locations, such as Mauna Kea, Hawaii (A), experience some of the highest natural levels of solar UV radiation at the Earth’s surface. These environments therefore provide excellent field sites for experiments designed to test the effects of extreme UV radiation conditions on plants (B). Shown here is an experiment using plastic film to reduce UV radiation to examine how these elevated levels of UV radiation influence plant growth and UV-screening. As plants migrate to higher elevations in response to climate change, they become exposed to higher levels of solar UV radiation as well as changes in several other abiotic and biotic factors. Understanding how plants will respond to UV radiation in the context of multiple environmental changes during migration is critical to assess how UV radiation and climate change will interact to modify the diversity and function of terrestrial ecosystems (Photographs by S. Flint).
Fig. 8
Fig. 8
Diagram to illustrate the processes by which various human activities affect exposure to UV radiation and other related aspects of the structure and function of marine and freshwater ecosystems. Anthropogenic drivers are leading to a suite of global changes, which in turn alter aquatic ecosystems and their primary producers, consumers, and higher-level predators. While marine systems are generally becoming more acidic due to anthropogenic CO2 production, freshwater systems, on the other hand, are making extensive recoveries from previous anthropogenic acid deposition (acid rain) related to clean air act legislation in North America and Europe initiated in the early 1990s. However, this recovery from acidification is combining with increased precipitation to increase the concentrations of dissolved organic matter in some inland and coastal waters. Increased dissolved organic matter reduces the transparency of water to UV radiation (section 4.2), which, in turn, increases the survival of parasites and pathogens of humans and wildlife.
Fig. 9
Fig. 9
Reactive oxygen species (ROS) provide an important pathway for UV radiation to indirectly damage biological systems. Examples of ROS are singlet oxygen, hydroxyl radicals, superoxide radicals, ozone, and hydrogen peroxide (listed near the bottom of Fig. 9, respectively). Their induction by UV radiation occurs when a photosensitiser (S in reaction 1), absorbs UV radiation. Some of this absorbed energy puts the molecules into excited states (red colour in diagram), leading to reactions with oxygen molecules to produce ROS. These ROS can then oxidise molecules in the environment or in cells in living organisms (C. in reaction 2), hence damaging living cells and tissues and creating oxidised products.
Fig. 10
Fig. 10
Actual and projected future ice-free area in the Antarctic continent. New Antarctic ice-free area (km2) predicted to emerge between 2014 and 2098 under climate forcing scenario RCP8.5 (Representative Concentration Pathway). Bar colours represent map locations of bioregions. Reprinted by permission from Macmillan Publishers Ltd.: J. R. Lee, B. Raymond, T. J. Bracegirdle, I. Chadès, R. A. Fuller, J. D. Shaw and A. Terauds, Nature, 2017, 547, 49–54, ©2017 (ref. 377).
Fig. 11
Fig. 11
Trends in global methane concentrations (Ed. Dlugokensky, https://www.esrl.noaa.gov/gmd/ccgg/trends_ch4/, downloaded 30th October 2017).
Fig. 12
Fig. 12
An Aerosol particle collected in the atmosphere of Mexico City. Soot spherules, shown in black, are about 20 nm in diameter, and are emitted directly from combustion sources. The (false) colours show a coating of sulfate (red) and oxygenated organics (blue), produced by UV-initiated, ˙OH-driven oxidation of sulphur dioxide and hydrocarbons (from ref. 435).
Fig. 13
Fig. 13
Disability-adjusted lost years of life (DALYs) for 2016 from two sources. (A) Shows the distribution of DALYs for ambient particulates and (B) shows that for ozone. (Institute for Health Metrics and Evaluation (IHME), GBD Compare Data Visualization, IHME, University of Washington, Seattle, WA, 2016). Available from http://vizhub.healthdata.org/gbd-compare. (Accessed 23rd October 2017).

References

    1. Chipperfield MP, Bekki S, Dhomse S, Harris NRP, Hassler B, Hossaini R, Steinbrecht W, Thiéblemont R and Weber M, Detecting recovery of the stratospheric ozone layer, Nature, 2017, 549, 211–218. - PubMed
    1. Kuttippurath J and Nair PJ, The signs of Antarctic ozone hole recovery, Sci. Rep, 2017, 7, 585 . - PMC - PubMed
    1. Hu L, Montzka SA, Lehman SJ, Godwin DS, Miller BR, Andrews AE, Thoning K, Miller JB, Sweeney C, Siso C, Elkins JW, Hall BD, Mondeel DJ, Nance D, Nehrkorn T, Mountain M, Fischer ML, Biraud SC, Chen H and Tans PP, Considerable contribution of the Montreal Protocol to declining greenhouse gas emissions from the United States,Geophys. Res. Lett, 2017, 44, 8075–8083.
    1. Hurwitz MM, Fleming EL, Newman PA, Li F and Liang Q, Early action on HFCs mitigates future atmospheric change, Environ. Res. Lett, 2016, 11, 114019.
    1. Xu Y, Zaelke D, Velders GJM and Ramanathan V, The role of HFCs in mitigating 21st century climate change, Atmos. Chem. Phys, 2013, 13, 6083–6089.

LinkOut - more resources