

doi: 10.1186/s13613-017-0345-7.
Proceedings of Réanimation 2018, the French Intensive Care Society International Congress
- PMID: 29404789
- PMCID: PMC5799093
- DOI: 10.1186/s13613-017-0345-7
Item in Clipboard
Proceedings of Réanimation 2018, the French Intensive Care Society International Congress
Ann Intensive Care.
.
Erratum in
-
Correction to: P-42 Distribution and antifungal susceptibility of Candida isolates in a Tunisian burn unit.Ann Intensive Care. 2019 Jul 4;9(1):80. doi: 10.1186/s13613-019-0555-2. Ann Intensive Care. 2019. PMID: 31273559 Free PMC article.
No abstract available
Figures
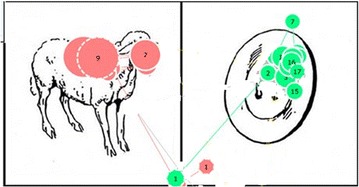
The figure presents 2 patients’ ocular fixation (each color corresponds to one patient). Green patient answered successfully and the total fixation duration was the most important for the area of interest “button”. Pink patient ocular fixation answered not successfully
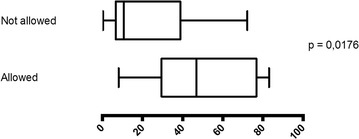
Traceability of prescriptions according to the nurse transcription right
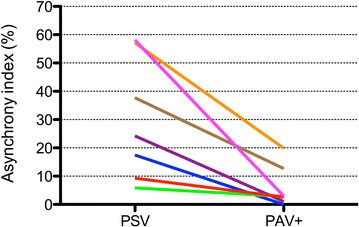
Asynchrony index during PSV and PAV+
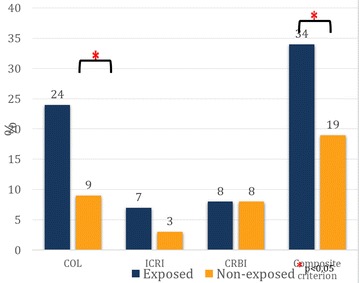
Incidence of colonization (COL), intravascular catheter-related infection (ICRI), catheter-related bloodstream infection (CRBI) and composite criterion (COL ± ICRI ± CRBI)
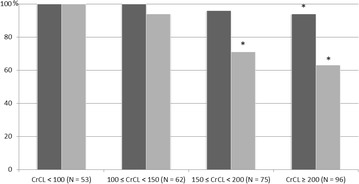
Percentages of samplings which attained the PK PD targets for various CrCL
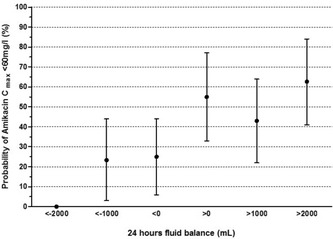
24-h fluid balance and probability of Amikacin Cmax < 60 mg L−1 in ECMO-treated patients. Error bars indicate 95% confidence interval
Low-flow extracorporeal CO2 removal
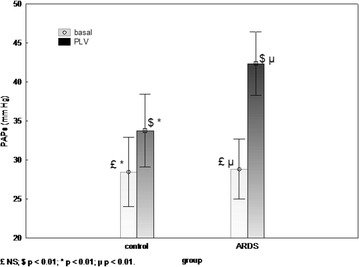
Systolic pulmonary artery pressure (PAPs) during PLV. ARDS and control group
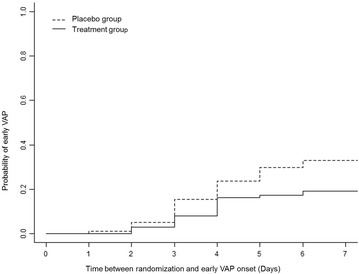
Time between randomization and early VAP onset
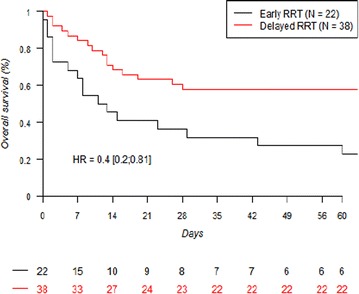
60-day survival in patients with early- and delayed-RRT
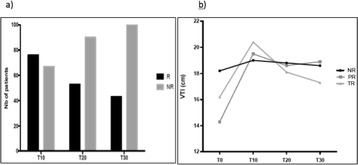
a Proposition of R and NR at the end (T10), 10 min (T20) and 20 min (T30) after the FC. b VTI time course during FC (T0 to T10) and during the 20 min after the FC (T10 to T30). R responders, NR non-responders, PR persistent responders, TR transient responders
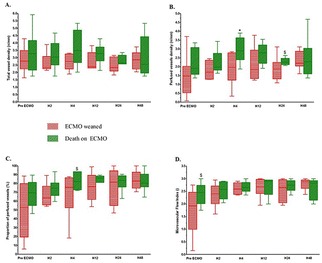
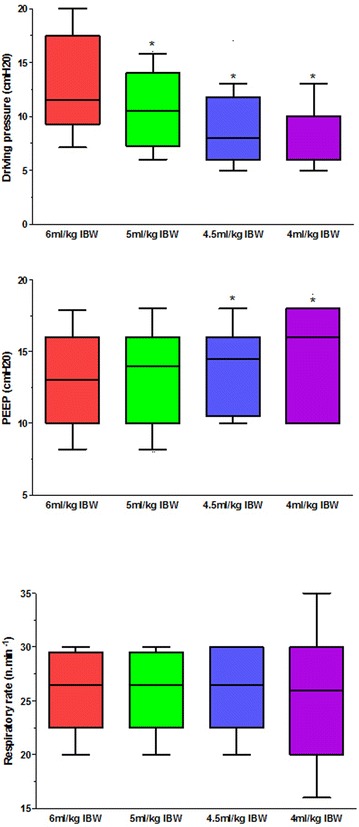
Horizontal line inside the box plot is the median; lower and upper box limis are 25th percentile to 78th percentile. T-bars represent the 10th and 90th percentiles. *p < 0.05; $p < 0.1
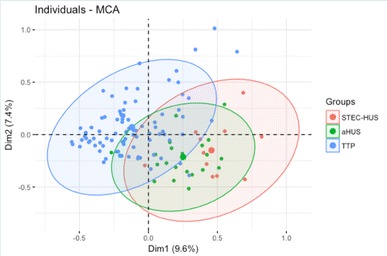
Multiple correspondence analysis of STEC-HUS, aHUS and TTP individuals
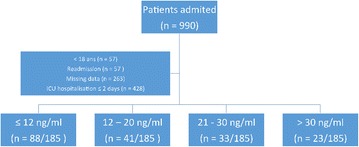
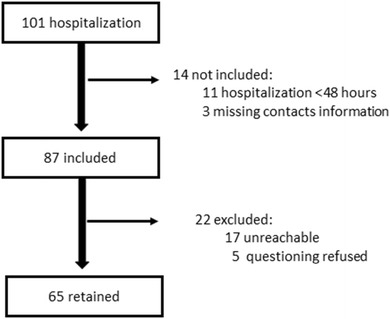
Flow chart of the study
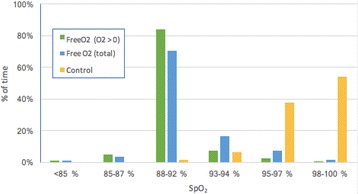
Percentage of time in different saturation ranges per period
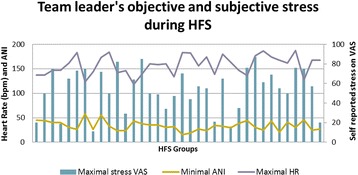
Team leader’s objective (heart rate and ANI) and subjective stress (declared VAS stress)
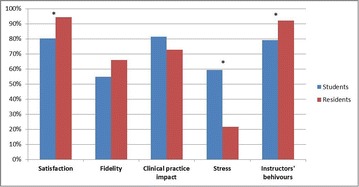
Comparison of perceptions between students and residents
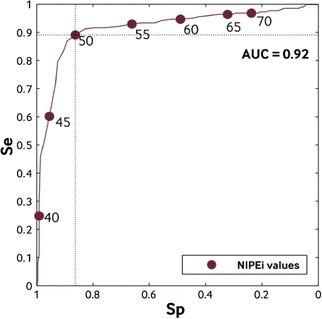
NIPEi ROC curve. NIPEi instantaneous Newborn Parasympathetic Evaluation index, Sp Specificity, Se Sensibility. Area under the curve (AUC): 0.92
Questionnaire results
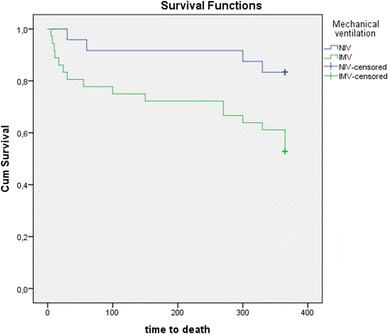
One-year long-term survivals according to ventilation mode (NIV, blue line vs IMV, green line) in ICU survivals from AE/COPD
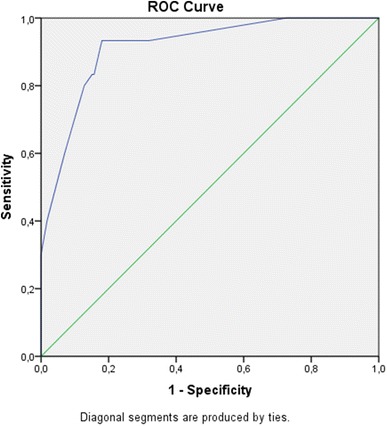
Receiver operator characteristic curve of ICU discharge triage model to identify patients at risk of 30-day post ICU mortality. (AUC, 0.914; 95% CI [0.86–0.96])
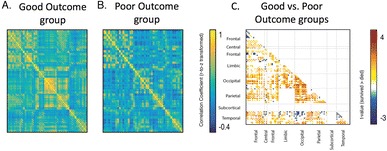
Outcomes of post-anoxic comatose patients early after CA, using rs-fMRI
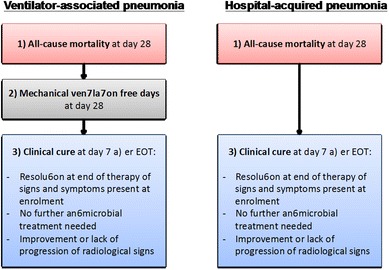
Clinically significant endpoints of hospital-acquired (HAP) and ventilator-associated pneumonia (VAP)
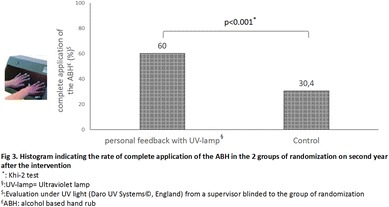
Histogram indicating the complete application of the ABH in the 2 groups
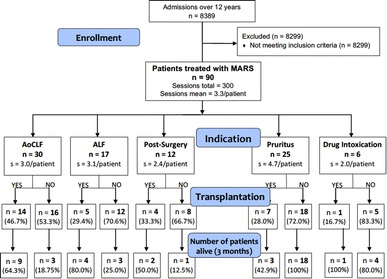
Admissions over 12 years
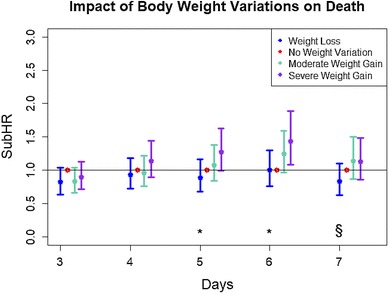
Impact of body weight variations on death
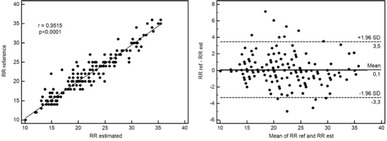
Results from photoplethysmographic determination of the respiratory rate (RR)
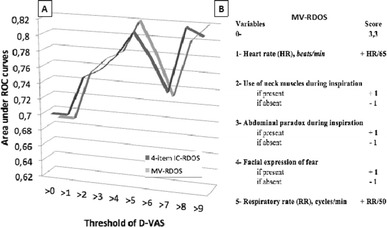
a Comparison of the areas under the receiver operating characteristic (ROC) curves between the 4-items intensive care—respiratory distress observation scale (IC-RDOS 4, former IC-RDOS [1] without respiratory rate) and the mechanical ventilation—respiratory distress observation scale (MV-RDOS) according to the dyspnea visual analog scale (D-VAS) thresholds. b Calculation of the MV-RDOS
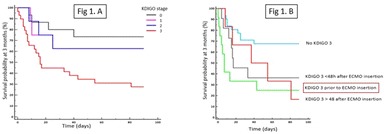
Impact of onset time of acute kidney injury on outcomes in patients
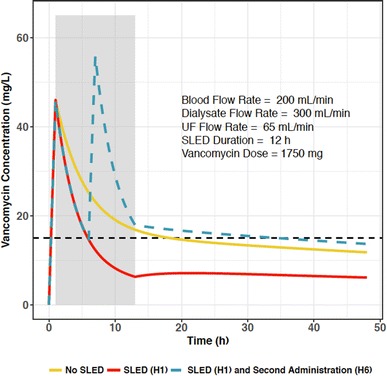
Vancomycin PK during SLED
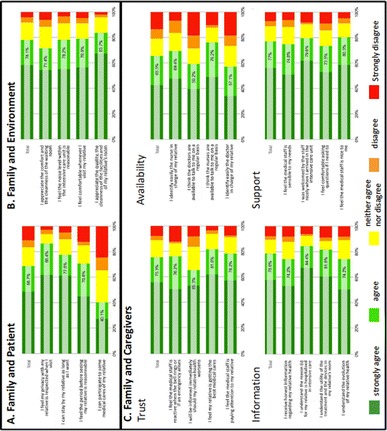
Questionnaire results
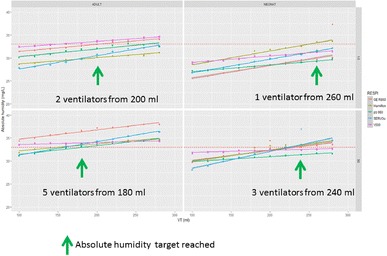
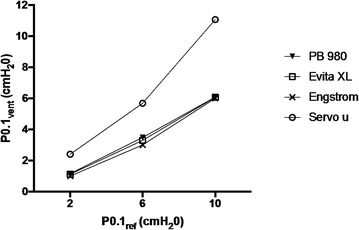
Differences across ICU ventilators
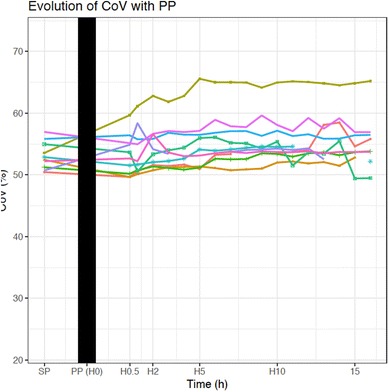
Evolution of CoV with PP
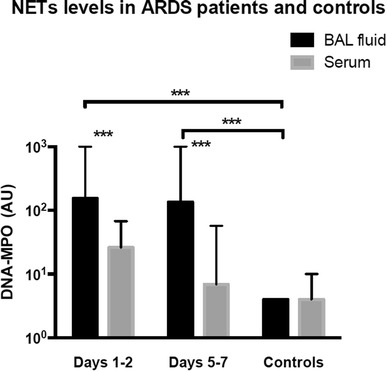
NETs levels in ARDS patients and controls
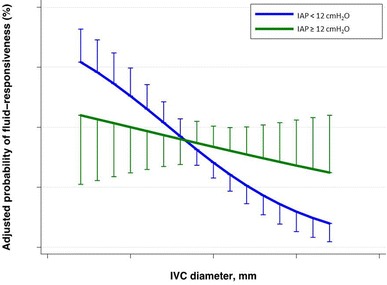
IVC size as a static parameter to predict fluid responsiveness in ventilated patients with circulatory failure
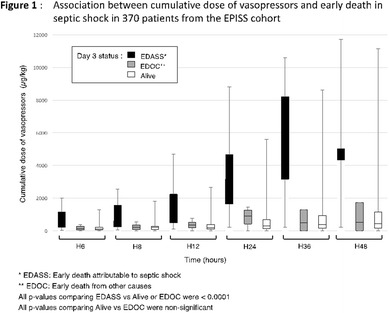
Association between cumulative dose of vasopressors and early death in septic shock
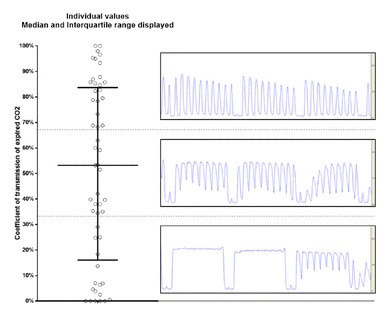
CO2 interpretation during cardiopulmonary resuscitation
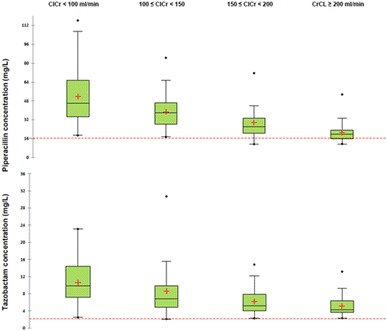
24-hour creatinine clearance (CrCL) measurements and therapeutic drug monitoring
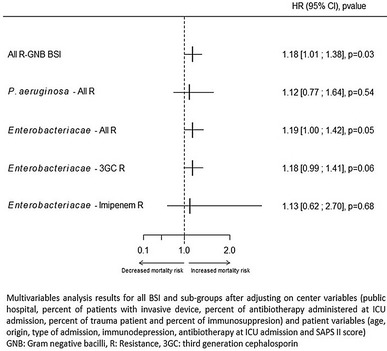
Multivariate analysis results for all BSI and sub-groups
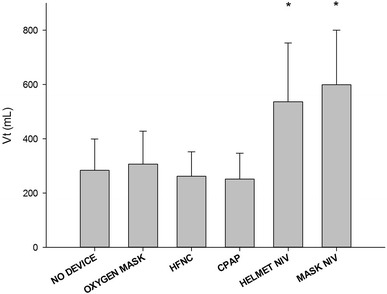
Tidal volume (Vt) per non-invasive respiratory support device
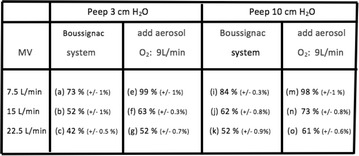
FiO2 differences between two peep values and with arid without add aerosol (supplied with O2 flow at 9 L/min). Means are expressed with SD
Breg levels in septic patients
Analysis of ReaSTOC database
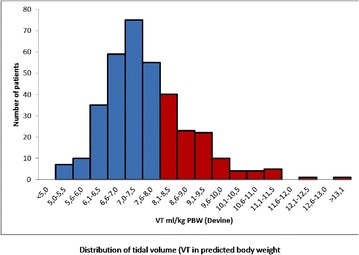
Distribution of tidal volume (VT) in predicted body weight
Analysis of ventilator measurements
FiO2’s obtained for an O2 of 4.5 L/min. Means are expressed with SD
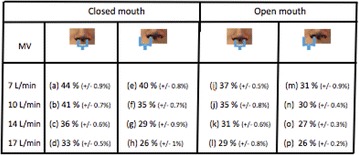
FiO2 differences between closed mouth and open mouth when the prongs are overlapping one nostril (O2 flow 4 L/min). Means are expressed with SD
Diaphragmatic ultrasonography results
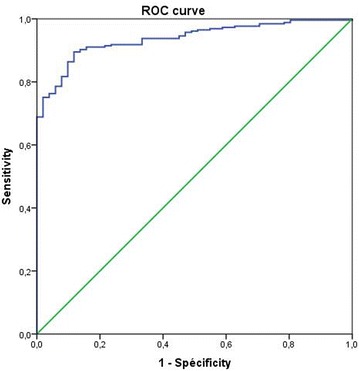
ROC curve
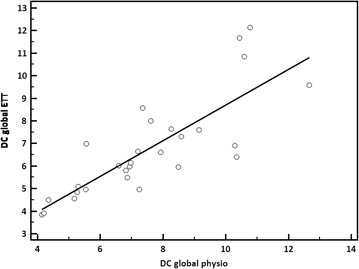
Cardiac output
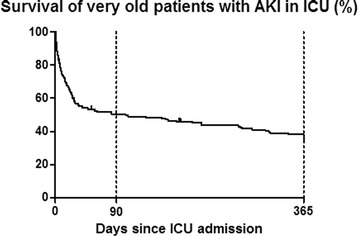
Survival of very old patients with AKI in ICU (%)
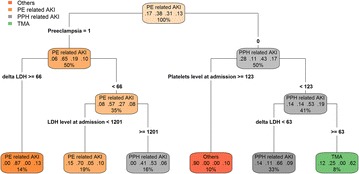
Analysis of post-partum AKI cases
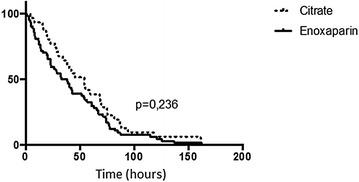
Filter’s lifespan
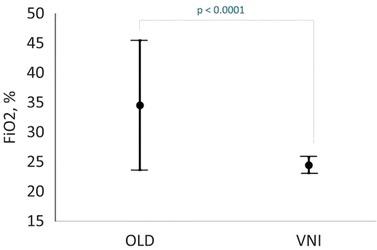
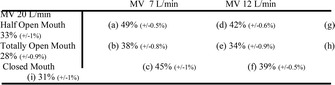
Comparison of FiO2 (%) with oxygen standard or noninvasive ventilation
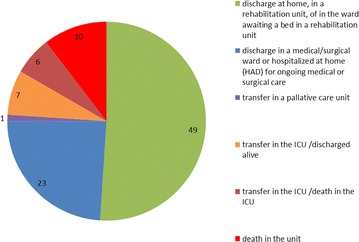
Outcome of patients
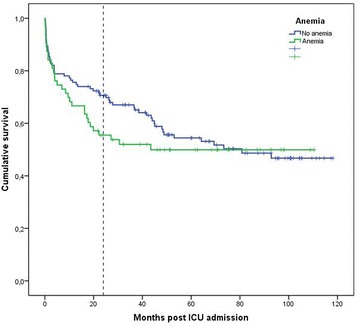
Kaplan Meier curves showing survival of COPD patients with anemia (green) or not (blue).
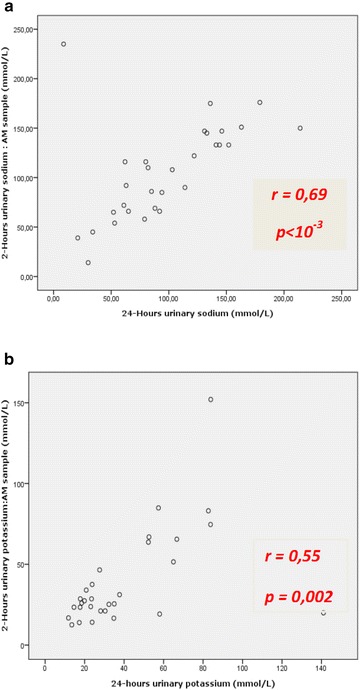
Correlation between 24-hour urine excretion and 2-hour urine excretion for sodium (a) and potassium (b)
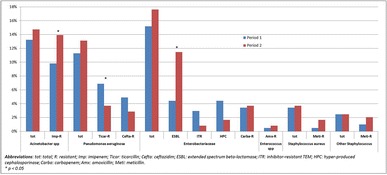
Patterns of bacterial ecology and resistance in our ICU before and after transfer to new buildings
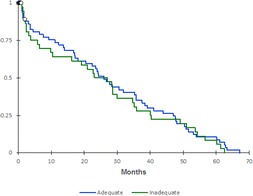
Kaplan–Meier survival between admission and 28-day according to adequate empirical antibiotic therapy guidelines (log rank, p = 0.53)
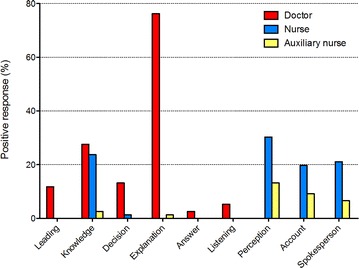
Positive responses according to medical function from doctors (red), nurses (blue) or auxiliary nurse (yellow)
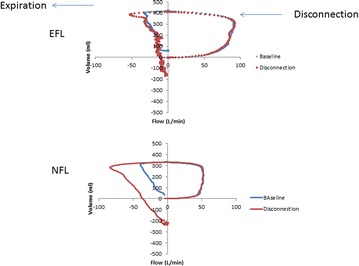
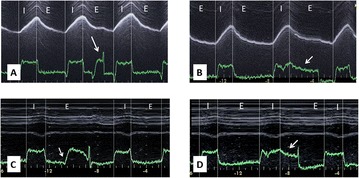
The flow signal during disconnection in case of expiratory flow limitation (at the top) or no expiratory flow limitation (at the bottom)
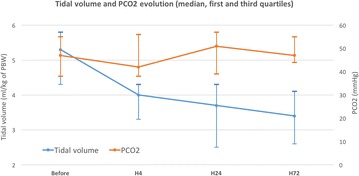
Evolution of tidal volume (blue line) and PaCO2 (orange line) over the time
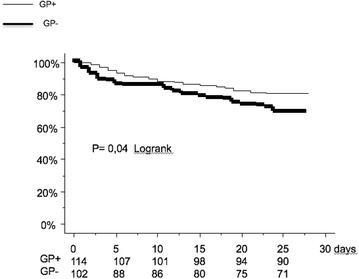
Kaplan–Meier survival analysis of 28-day survival according to whether or not ARDS patients visited a GP before ICU admission. p = 0.04, log-rank test
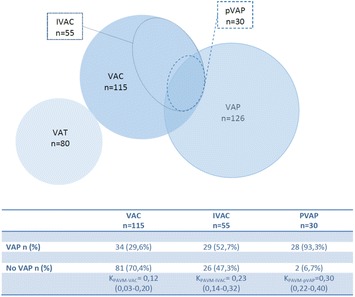
Agreement between VAE and LRTI diagnostic
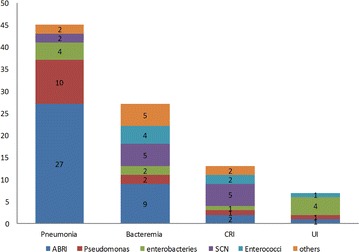
Pathogens distribution according to localization of nosocomial infection
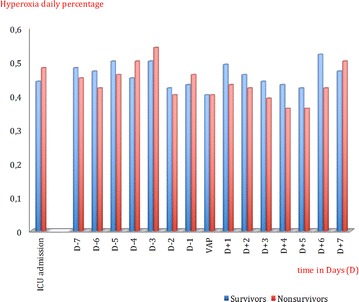
Duration of hyperoxia (in %) over the time in survivors (blue bars) and in non-survivors (red bars)
LinkOut - more resources
Full Text Sources
Other Literature Sources
