. 2018 Mar 6;52(5):3125-3135.
doi: 10.1021/acs.est.7b04781. Epub 2018 Feb 26.

Suspect Screening Analysis of Chemicals in Consumer Products

Affiliations

Suspect Screening Analysis of Chemicals in Consumer Products

Katherine A Phillips et al. Environ Sci Technol. .

Abstract

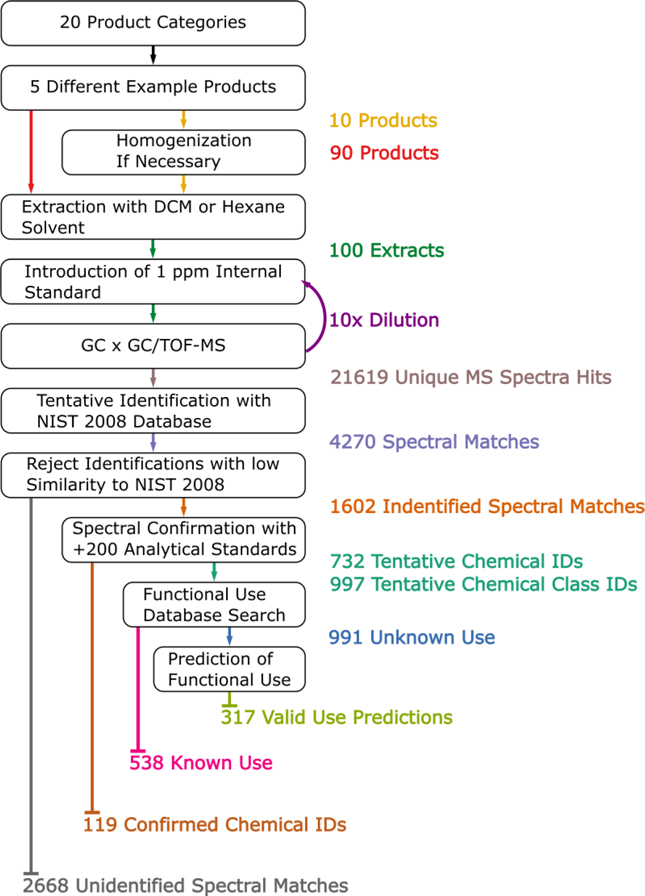
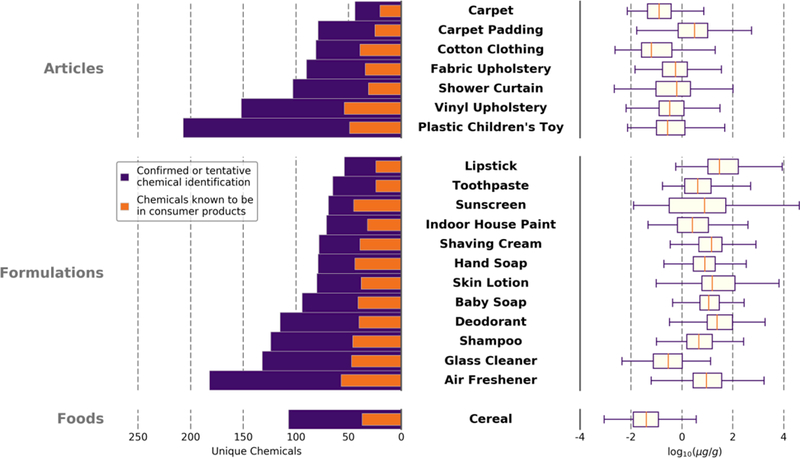
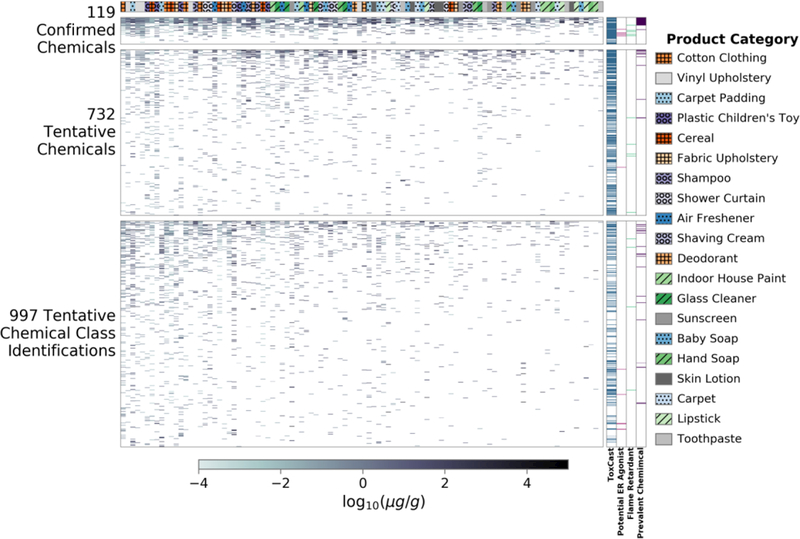
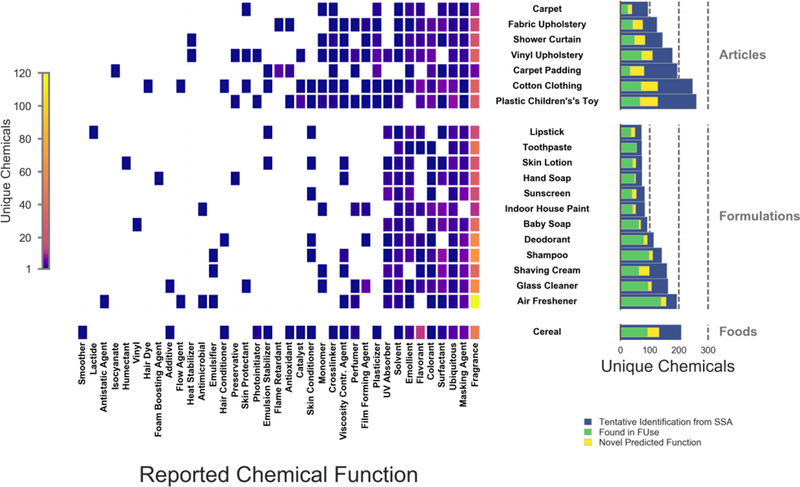
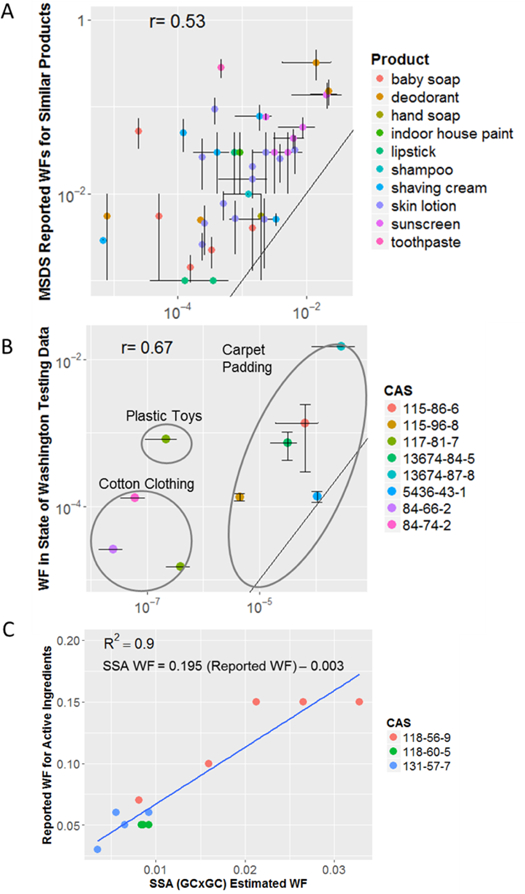
A two-dimensional gas chromatography-time-of-flight/mass spectrometry (GC×GC-TOF/MS) suspect screening analysis method was used to rapidly characterize chemicals in 100 consumer products-which included formulations (e.g., shampoos, paints), articles (e.g., upholsteries, shower curtains), and foods (cereals)-and therefore supports broader efforts to prioritize chemicals based on potential human health risks. Analyses yielded 4270 unique chemical signatures across the products, with 1602 signatures tentatively identified using the National Institute of Standards and Technology 2008 spectral database. Chemical standards confirmed the presence of 119 compounds. Of the 1602 tentatively identified chemicals, 1404 were not present in a public database of known consumer product chemicals. Reported data and model predictions of chemical functional use were applied to evaluate the tentative chemical identifications. Estimated chemical concentrations were compared to manufacturer-reported values and other measured data. Chemical presence and concentration data can now be used to improve estimates of chemical exposure, and refine estimates of risk posed to human health and the environment.


Figures

Figure 1.
Figure 1.
Workflow of suspect screening analysis for 100 consumer products. The color of the text on the right hand side of the figure corresponds to the arrows in the workflow. Samples were homogenized (if necessary) and extracted. Chemical standards were added at 1 µg/g and then GC×GC/TOF-MS was used to characterize the chemicals in the samples via their mass spectra. The spectra were matched, if possible, using the NIST 08 database, and a subset were confirmed using analytical standards. Reported and predicted functional uses of chemicals were used as additional support of chemical identification.
Figure 2.
Figure 2.
The number of unique chemicals within each category is shown by the bar chart (left). The total number of confirmed or tentative chemical identifications are compared to the number of those chemicals already known to be in consumer products (i.e., CPCPdb). The range of estimated concentrations are shown by the box plot (right) for all confirmed or tentative identifications for each product category. The upper pane represents articles, the middle represents formulations, and the lower pane represents foods.
Figure 3.
Figure 3.
Estimated concentration of chemicals in the tested products. Each one of the product samples is a column of the heat map, while there are 1848 rows corresponding to all identified spectral matches from the SSA. Some chemicals could be confirmed (by analytical standards) in some samples, but only tentatively identified (by spectral match) in others. The bars to the right of the heat maps show if a spectral match appeared in the ToxCast library, was a potential ER agonist, was a known flame retardant, or was prevalent (i.e., identified in 25 or more products) in the products examined in this SSA. The bar to the top of the heat map shows the product category in which a spectral match was identified. Spectral matches in each heat map are sorted such that those occurring in the most products are at the top. Products are sorted such that products with the most spectral matches are on the left. The Product Category legend is ordered by occurrence of a category from left to right. White spaces indicate that the spectral match was not identified in a particular product. Markings (line or circle) of product categories have been added only to aid in distinguishing product types.
Figure 4.
Figure 4.
Previously reported (FUse) functional use information for unconfirmed chemicals (tentative chemical or tentative chemical class identifications). Left shows the number of these identifications that were reported to have a given function in each of the product categories. Right shows the number of tentative chemical and chemical class identifications (blue) in each product category, the number of identifications in that category that had a reported functional use (green), as well as the number of identifications with a novel predicted functional use (yellow). The upper pane represents articles, the middle represents formulations, and the lower pane represents foods.
Figure 5.
Figure 5.
Comparison of SSA estimated product weight fractions (WF) to other sources of weight fraction information. Black lines give the “perfect predictor” identity line. A) Mean estimated WF in products (bars indicate SD across samples) versus mean midrange WF reported on MSDSs for similar products (bars indicate means of reported bounds), and B) Mean estimated WF in products (bars indicate SD across samples) versus mean values reported for similar products in the State of Washington Product Testing Database. C) Estimated WF versus label-reported values for active ingredients in sunscreens (blue line is fitted model; note that the linear regression equation has been algebraically rearrange to be consistent with the regression coefficient provided in the Results and Discussion).

References

    1. Little JC; Weschler CJ; Nazaroff WW; Liu Z; Cohen Hubal EA, Rapid methods to estimate potential exposure to semivolatile organic compounds in the indoor environment. Environ. Sci. Technol 2012, 46 (20), 11171–11178. - PubMed
    1. Isaacs KK; Glen WG; Egeghy P; Goldsmith M-R; Smith L; Vallero D; Brooks R; Grulke CM; Özkaynak H, SHEDS-HT: an integrated probabilistic exposure model for prioritizing exposures to chemicals with near-field and dietary sources. Environ. Sci. Technol 2014, 48 (21), 12750–12759. - PubMed
    1. Wambaugh JF; Wang A; Dionisio KL; Frame A; Egeghy P; Judson R; Setzer RW, High throughput heuristics for prioritizing human exposure to environmental chemicals. Environ. Sci. Technol 2014, 48 (21), 12760–12767. - PubMed
    1. Isaacs KK; Goldsmith M-R; Egeghy P; Phillips K; Brooks R; Hong T; Wambaugh JF, Characterization and prediction of chemical functions and weight fractions in consumer products. Toxicol. Rep 2016, 3, 723–732. - PMC - PubMed
    1. Rager JE; Strynar MJ; Liang S; McMahen RL; Richard AM; Grulke CM; Wambaugh JF; Isaacs KK; Judson R; Williams AJ; Sobus JR, Linking high resolution mass spectrometry data with exposure and toxicity forecasts to advance high-throughput environmental monitoring. Environ. Int 2016, 88, 269–280. - PubMed

Publication types