. 2018 Feb;6(3):e13598.
doi: 10.14814/phy2.13598.

Increased central common drive to ankle plantar flexor and dorsiflexor muscles during visually guided gait

Affiliations

Increased central common drive to ankle plantar flexor and dorsiflexor muscles during visually guided gait

Peter Jensen et al. Physiol Rep. 2018 Feb.

Abstract

When we walk in a challenging environment, we use visual information to modify our gait and place our feet carefully on the ground. Here, we explored how central common drive to ankle muscles changes in relation to visually guided foot placement. Sixteen healthy adults aged 23 ± 5 years participated in the study. Electromyography (EMG) from the Soleus (Sol), medial Gastrocnemius (MG), and the distal and proximal ends of the Tibialis anterior (TA) muscles and electroencephalography (EEG) from Cz were recorded while subjects walked on a motorized treadmill. A visually guided walking task, where subjects received visual feedback of their foot placement on a screen in real-time and were required to place their feet within narrow preset target areas, was compared to normal walking. There was a significant increase in the central common drive estimated by TA-TA and Sol-MG EMG-EMG coherence in beta and gamma frequencies during the visually guided walking compared to normal walking. EEG-TA EMG coherence also increased, but the group average did not reach statistical significance. The results indicate that the corticospinal tract is involved in modifying gait when visually guided placement of the foot is required. These findings are important for our basic understanding of the central control of human bipedal gait and for the design of rehabilitation interventions for gait function following central motor lesions.

Keywords: EMG; coherence; locomotion; visually guided walking.


Figures

Figure 1
Figure 1
The visually guided walking task. (A) Subjects were instructed to adjust their step length to hit virtual visual targets while walking on a motorized treadmill. Stepping targets and foot position were projected on a screen in front of the treadmill. The position of the foot of the swing leg was displayed as an 8 cm diameter blue circle and the targets were shown as 16 cm x 16 cm open red squares on the screen. (B–F) EEG and EMG traces from one representable subject during normal (black) and visually guided gait (red). The vertical dashed line represents the time of heel strike. The gray‐shaded areas show the time‐periods used for coherence analyses. EMG, electromyography; EEG, electroencephalography.
Figure 2
Figure 2
Time‐frequency plot of corticomuscular (Cz‐TA) and intramuscular coherence (TATA) from a single subject during normal and visually guided walking. (A–B) During normal walking, significant estimates of TATA coherence was observed in the beta frequency band (15–35 Hz; see red circle in B). (C–D) During visually guided walking, significant estimates of both Cz‐TA and TATA coherence was observed in the beta (15–35 Hz) and gamma frequency bands (35–60 Hz) for offset values between −700 and −50 ms (see red circles in C and D). The very high and significant coherence observed at frequencies below 10 Hz is assumed to be produced, in part, by the common envelope of the EMG activity during swing (Halliday et al. 2003). EMG, electromyography; TA, Tibialis anterior.
Figure 3
Figure 3
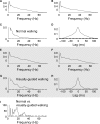
Pooled intramuscular TATA coherence during normal and visually guided walking. Autospectra (0–75 Hz) of the proximal and distal TA electrodes during normal (A and B) and visually guided walking (E and F). Coherence at frequencies between 1 and 75 Hz calculated between TA rectified EMGs during normal (C) and visually guided walking (G). Cumulant densities (range ± 125 ms) associated with the coherence during normal (D) and visually guided walking (H). χ 2 analysis of the difference in TATA coherence in the two walking tasks (I). The dashed horizontal lines denote the upper 95% confidence limit based on the assumption of independence. Note that there is significantly more TATA coherence in both the beta and gamma range during visually guided walking. EMG, electromyography; TA, Tibialis anterior.
Figure 4
Figure 4
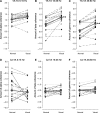
Intramuscular (TATA) and corticomuscular (Cz‐TA) coherence during normal and visually guided walking. A‐C shows the amount of alpha (A), beta (B), and gamma (C) intramuscular coherence between TATA during normal and visually guided gait for each subject. D–F shows the amount of alpha (D), beta (E), and gamma (F) corticomuscular coherence between Cz‐TA during normal and visually guided gait. The thick gray line shows the average amount of coherence in each task. **Significant difference (< 0.01) in the amount of coherence during normal and visually guided gait. TA, Tibialis anterior.
Figure 5
Figure 5
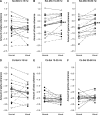
Intermuscular (Sol‐MG) and corticomuscular (Cz‐Sol) coherence during normal and visually guided walking. (A–C) Shows the amount of alpha (A), beta (B), and gamma (C) intermuscular coherence between Sol‐MG during normal and visually guided gait for each subject. (D–F) Shows the amount of alpha (D), beta (E), and gamma (F) corticomuscular coherence between Cz‐Sol during normal and visually guided gait. The thick gray line shows the average amount of coherence in each task. **Significant difference (< 0.01) in the amount of coherence during normal and visually guided gait. MG, medial Gastrocnemius; Sol, Soleus.
Figure 6
Figure 6
Coherence in early and late swing. Amount of TATA alpha (black), beta (light gray), and gamma coherence (dark gray) in the early (−650 to −350 ms) and late part of the swing phase (−350 to −50 ms) during normal and visually guided walking. Note that beta and gamma coherence was increased during visually guided walking in both early and late swing. TA, Tibialis anterior.

References

    1. Amjad, A. M. , Halliday D. M., Rosenberg J. R., and Conway B. A.. 1997. An extended difference of coherence test for comparing and combining several independent coherence estimates: theory and application to the study of motor units and physiological tremor. J. Neurosci. Methods 73:69–79. - PubMed
    1. Amos, A. , Armstrong D. M., and Marple‐Horvat D. E.. 1990. Changes in the discharge patterns of motor cortical neurones associated with volitional changes in stepping in the cat. Neurosci. Lett. 109:107–112. - PubMed
    1. Barthelemy, D. , Willerslev‐Olsen M., Lundell H., Conway B. A., Knudsen H., Biering‐Sørensen F., et al. 2010. Impaired transmission in the corticospinal tract and gait disability in spinal cord injured persons. J. Neurophysiol. 104:1167–1176. - PubMed
    1. Choi, J. T. , Jensen P., and Nielsen J. B.. 2016. Locomotor sequence learning in visually guided walking. J. Neurophysiol. 115:2014–2020. - PMC - PubMed
    1. Christensen, L. O. , Johannsen P., Sinkjaer T., Petersen N., Pyndt H. S., and Nielsen J. B.. 2000. Cerebral activation during bicycle movements in man. Exp. Brain Res. 135:66–72. - PubMed

Publication types

LinkOut - more resources