. 2018 May:86:28-40.
doi: 10.1016/j.ultras.2018.01.013. Epub 2018 Jan 31.

Lebedev scheme for ultrasound simulation in composites

Affiliations

Lebedev scheme for ultrasound simulation in composites

Francisco Hernando Quintanilla et al. Ultrasonics. 2018 May.

Abstract

The growing use of composite materials for aerospace applications has resulted in a need for quantitative nondestructive evaluation (NDE) methods appropriate for characterizing damage in composite components. NDE simulation tools, such as ultrasound models, can aid in enabling optimized inspection methods and establishing confidence in inspection capabilities. In this paper a mathematical approach using the Lebedev Finite Difference (LFD) method is presented for ultrasonic wave simulation in composites. Boundary condition equations for implementing stress-free boundaries (necessary for simulation of NDE scenarios) are also presented. Quantitative comparisons between LFD guided wave ultrasound simulation results, experimental guided wave data, and dispersion curves are described. Additionally, stability tests are performed to establish the LFD code behavior in the presence of stress-free boundaries and low-symmetry anisotropy. Results show that LFD is an appropriate approach for simulating ultrasound in anisotropic composite materials and that the method is stable in the presence of low-symmetry anisotropy and stress-free boundaries. Studies presented in this paper include guided wave simulation in hexagonal, monoclinic, triclinic and layered composite laminates.

Keywords: Composite; Guided wave; Lebedev method; Simulation.


Figures

Figure 1:
Figure 1:
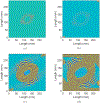
Wavefield images showing snapshots in time of EFIT simulation results for a monoclinic CFRP laminate (vz at the plate surface is shown) : (a) A0 mode propagation at a time before numerical instabilities begin, (b) A0 mode propagation at a time after numerical instabilities have started at the simulation edges/corners (visible as large amplitude features emerging from corners), (c) image at the same point in time shown in (b) but with the colorscale saturated to show S0, SH0, and A0 modes, (d) a later point in time showing numerical instabilities overtaking the simulation space.
Figure 2:
Figure 2:
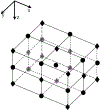
A single grid cell in the LFD scheme, where diamonds represent velocity locations and circles show the location of stresses.
Figure 3:
Figure 3:
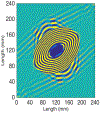
Wavefield plots for the transversely isotropic plate case, showing out-of-plane velocity, vz, at a single point in time for simulated and measured wavefields.
Figure 4:
Figure 4:
Wavenumber plots at the center excitation frequency for the transversely isotropic plate case, showing (kx, ky) for simulated and measured wavefields. Simulation results are shown for vx, vy, vz. Experimental results are shown for vz
Figure 5:
Figure 5:
Monoclinic case with fibers in all plies running in the 30-degree direction.
Figure 6:
Figure 6:
Wavefield plots for the monoclinic plate case, showing out-of-plane velocity, vz, at a single point in time for simulated and measured wavefields.
Figure 7:
Figure 7:
Wavefield plots of simulated vz for the monoclinic case for snapshots in time showing edge scattering. Note that the colormap in (a) is saturated to show S0 and SH0 modes. The colormap in (b)-(d) is chosen to show A0 mode scattering.
Figure 8:
Figure 8:
Wavenumber plots at the center excitation frequency for the monoclinic plate case, showing (kx, ky) for simulated and measured wavefields. Simulation results are shown for (a) vx, (b) vy, (c) vz. Experimental results are shown in (d) for vz.
Figure 9:
Figure 9:
Diagram showing rotations corresponding to matrices (20) and (21).
Figure 10:
Figure 10:
Wavefield plot of vz for the stiffness matrix corresponding to (20). Compare to figure 7(a).
Figure 11:
Figure 11:
Wavefield plots of vx, vy, and vz for the simulated triclinic case for snapshots in time showing edge scattering. The stress-free boundary scattering shows numerically stable behavior.
Figure 12:
Figure 12:
Wavefield plots for the quasi-isotropic plate case, showing out-of-plane velocity from simulation, vz, at two points in time. The figure on the right shows stability under stress-free boundary edge scattering.
Figure 13:
Figure 13:
Wavenumber plots at the center excitation frequency for the quasi-isotropic plate case, showing (kx, ky) for simulated and measured wavefields. Simulation results are shown for vx, vy, vz. Experimental results are shown for vz

References

    1. Leckey C, Seebo J, Guided wave energy trapping to detect hidden multilayer delamination damage, Rev Progr Quant Nondestr AIP Publishing, 1650 (2015) 1162–1169.
    1. Fellinger F, Langenberg KJ, Numerical techniques for elastic wave propagation and scattering, Proc IUTAM Sym (1990) 81–86.
    1. Marklein R, The finite integration technique as a general tool to compute acoustic, electromagnetic, elastodynamic, and coupled wave fields, Rev Radio Sci: 1999-2002 URSI, edited by Stone W, IEEE Press and John Wiley and Sons, New York, pp. 201–244 (2002).
    1. Schubert F, Peiffer A, Kohler B, Sanderson T, The elastodynamic finite integration technique for waves in cylindrical geometries, J Acoust Soc Am 104 (1998) 2604–2614.
    1. Halkjaer S, Elastic wave propagation in anisotropic inhomogeneous materials, Ph.D. dissertation, Technical University of Denmark, Lyngby Denmark: (available from http://www2.imm.dtu.dk/documents/ftp/phdliste/phd74.abstract.html, date last viewed: 5/17/2012) (2000).