

Efficacy of microbial sampling recommendations and practices in sub-Saharan Africa
- PMID: 29407645
- PMCID: PMC5842043
- DOI: 10.1016/j.watres.2018.01.054
Efficacy of microbial sampling recommendations and practices in sub-Saharan Africa
Abstract
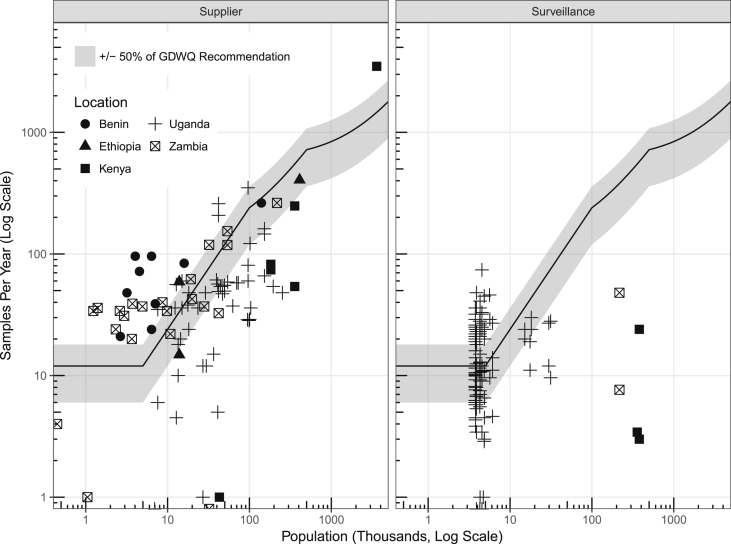
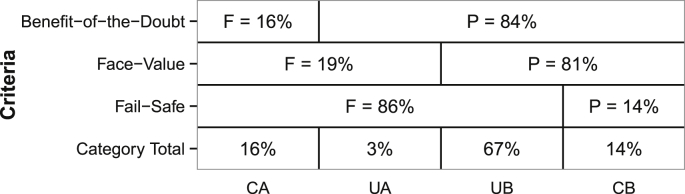
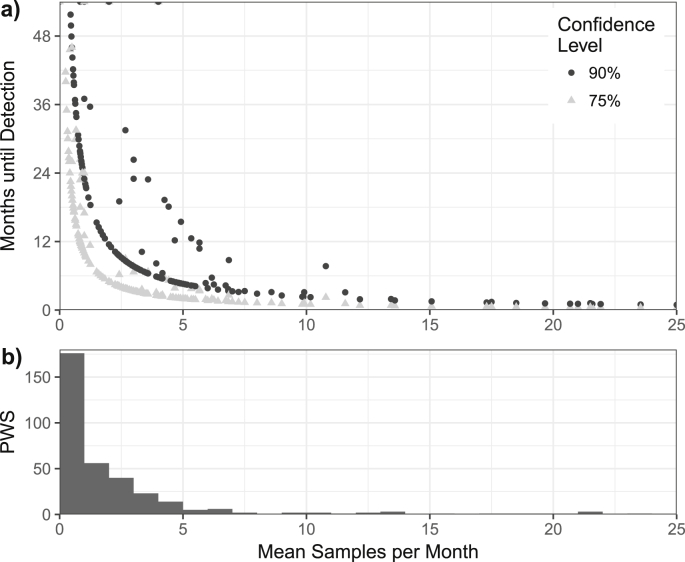
Current guidelines for testing drinking water quality recommend that the sampling rate, which is the number of samples tested for fecal indicator bacteria (FIB) per year, increases as the population served by the drinking water system increases. However, in low-resource settings, prevalence of contamination tends to be higher, potentially requiring higher sampling rates and different statistical methods not addressed by current sampling recommendations. We analyzed 27,930 tests for FIB collected from 351 piped water systems in eight countries in sub-Saharan Africa to assess current sampling rates, observed contamination prevalences, and the ability of monitoring agencies to complete two common objectives of sampling programs: determine regulatory compliance and detect a change over time. Although FIB were never detected in samples from 75% of piped water systems, only 14% were sampled often enough to conclude with 90% confidence that the true contamination prevalence met an example guideline (≤5% chance of any sample positive for FIB). Similarly, after observing a ten percentage point increase in contaminated samples, 43% of PWS would still require more than a year before their monitoring agency could be confident that contamination had actually increased. We conclude that current sampling practices in these settings may provide insufficient information because they collect too few samples. We also conclude that current guidelines could be improved by specifying how to increase sampling after contamination has been detected. Our results suggest that future recommendations should explicitly consider the regulatory limit and desired confidence in results, and adapt when FIB is detected.
Keywords: Guidelines for drinking water quality; Microbial water quality; Sampling programs; Statistical uncertainty; Sub-saharan Africa; Water quality regulations.
Copyright © 2018 The Author(s). Published by Elsevier Ltd.. All rights reserved.
Figures


Similar articles
-
To What Extent is Drinking Water Tested in Sub-Saharan Africa? A Comparative Analysis of Regulated Water Quality Monitoring.Int J Environ Res Public Health. 2016 Mar 2;13(3):275. doi: 10.3390/ijerph13030275. Int J Environ Res Public Health. 2016. PMID: 26950135 Free PMC article.
-
Assessing Drinking Water Quality and Water Safety Management in Sub-Saharan Africa Using Regulated Monitoring Data.Environ Sci Technol. 2016 Oct 18;50(20):10869-10876. doi: 10.1021/acs.est.6b02707. Epub 2016 Sep 28. Environ Sci Technol. 2016. PMID: 27559754
-
Fecal Indicator Bacteria Data to Characterize Drinking Water Quality in Low-Resource Settings: Summary of Current Practices and Recommendations for Improving Validity.Int J Environ Res Public Health. 2021 Feb 28;18(5):2353. doi: 10.3390/ijerph18052353. Int J Environ Res Public Health. 2021. PMID: 33670869 Free PMC article.
-
High levels of faecal contamination in drinking groundwater and recreational water due to poor sanitation, in the sub-rural neighbourhoods of Kinshasa, Democratic Republic of the Congo.Int J Hyg Environ Health. 2018 Apr;221(3):400-408. doi: 10.1016/j.ijheh.2018.01.003. Epub 2018 Jan 10. Int J Hyg Environ Health. 2018. PMID: 29396027
-
Association of Supply Type with Fecal Contamination of Source Water and Household Stored Drinking Water in Developing Countries: A Bivariate Meta-analysis.Environ Health Perspect. 2015 Dec;123(12):1222-31. doi: 10.1289/ehp.1409002. Epub 2015 May 8. Environ Health Perspect. 2015. PMID: 25956006 Free PMC article.
Cited by
-
Centralized or Onsite Testing? Examining the Costs of Water Quality Monitoring in Rural Africa.Environ Sci Technol. 2024 Jul 2;58(26):11236-11246. doi: 10.1021/acs.est.4c01916. Epub 2024 Jun 14. Environ Sci Technol. 2024. PMID: 38872464 Free PMC article.
-
Modeling Exposure to Fecal Contamination in Drinking Water due to Multiple Water Source Use.Environ Sci Technol. 2022 Mar 15;56(6):3419-3429. doi: 10.1021/acs.est.1c05683. Epub 2022 Mar 3. Environ Sci Technol. 2022. PMID: 35239319 Free PMC article.
-
How Much Will It Cost To Monitor Microbial Drinking Water Quality in Sub-Saharan Africa?Environ Sci Technol. 2017 Jun 6;51(11):5869-5878. doi: 10.1021/acs.est.6b06442. Epub 2017 May 12. Environ Sci Technol. 2017. PMID: 28459563 Free PMC article.
-
Evaluation of the different methods to detect Salmonella in poultry feces samples.Arch Microbiol. 2022 Apr 20;204(5):269. doi: 10.1007/s00203-022-02840-x. Arch Microbiol. 2022. PMID: 35441892
-
Microbiological identification of pathogens in water from educational centers in Norte de Santander.Rev Cuid. 2025 Apr 30;16(1):e4052. doi: 10.15649/cuidarte.4052. eCollection 2025 Jan-Apr. Rev Cuid. 2025. PMID: 40529955 Free PMC article.
References
-
- Bartram J., Corrales L., Davison A., Deere D., Drury D., Gordon B., Howard G., Rinehold A., Stevens M. World Health Organization; Geneva: 2009. Water Safety Plan Manual: Step-by-step Risk Management for Drinking-water Suppliers.
-
- Commonwealth of Australia . Natural Resource Management Ministerial Council; Canberra: 2011. Australian Drinking Water Guidelines 6 Version 3.3 Updated November 2016, National Water Quality Management Strategy.
-
- Cook C., Prystajecky N., Ngueng Feze I., Joly Y., Dunn G., Kirby E., Özdemir V., Isaac-Renton J. A comparison of the regulatory frameworks governing microbial testing of drinking water in three canadian provinces. Can. Water Resour. J. 2013;38(3):185–195.
Publication types
MeSH terms
Substances
LinkOut - more resources
Full Text Sources
Other Literature Sources
Medical
Miscellaneous
