. 2018 May:303:1-11.
doi: 10.1016/j.expneurol.2018.01.019. Epub 2018 Feb 3.

Dissipation of transmembrane potassium gradient is the main cause of cerebral ischemia-induced depolarization in astrocytes and neurons

Affiliations

Dissipation of transmembrane potassium gradient is the main cause of cerebral ischemia-induced depolarization in astrocytes and neurons

Yixing Du et al. Exp Neurol. 2018 May.

Abstract

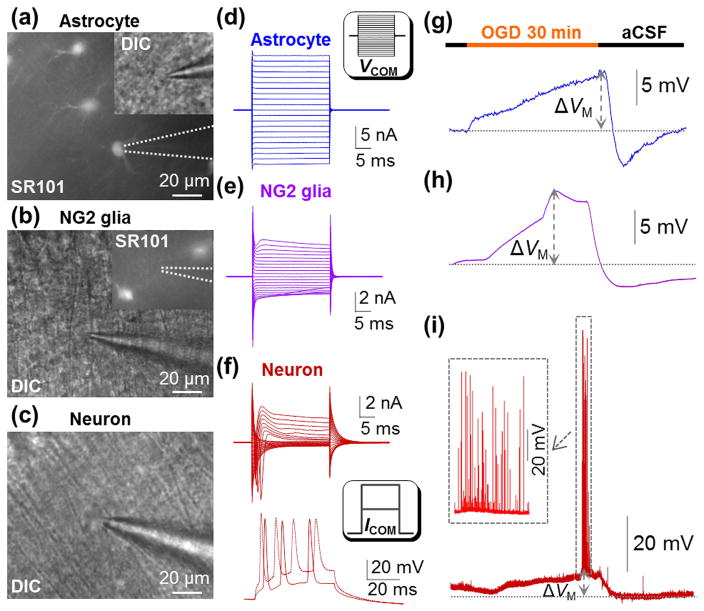
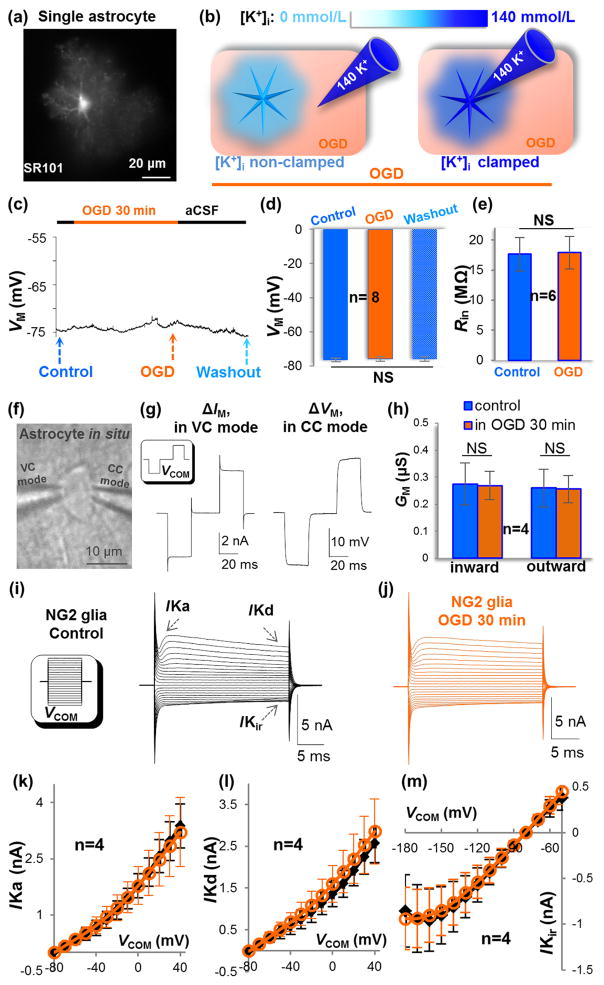
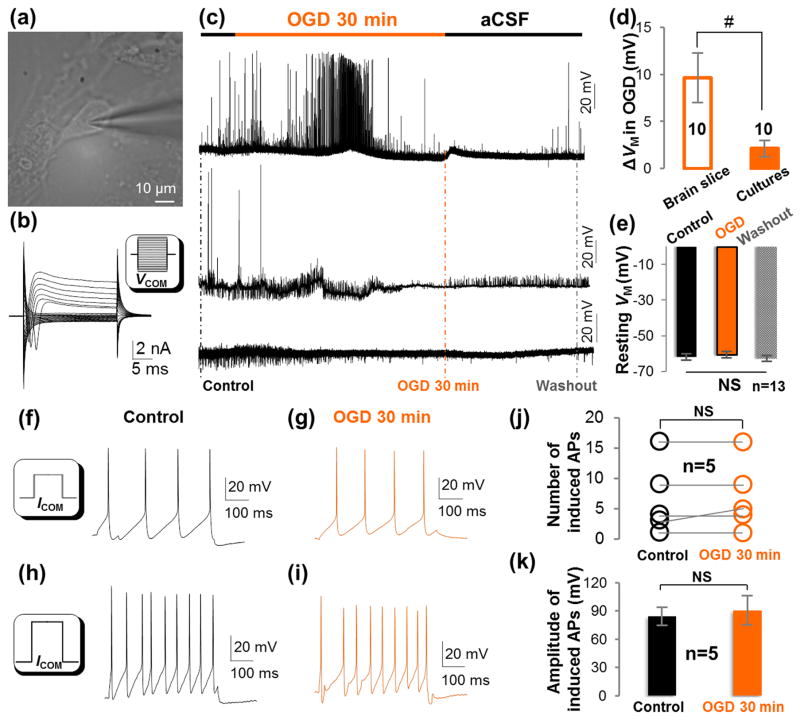
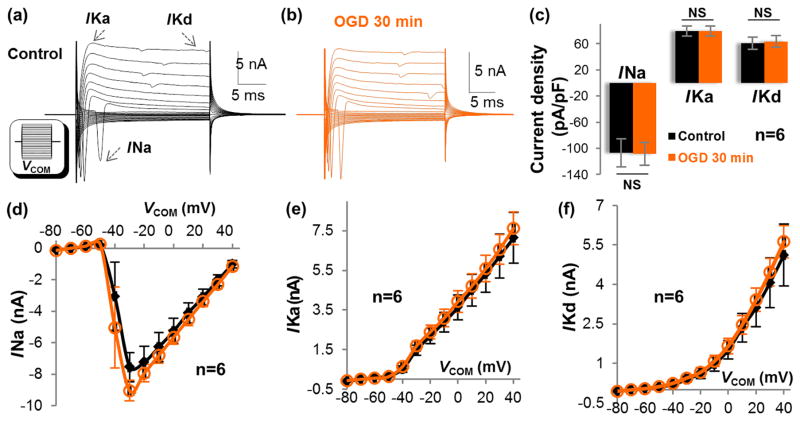
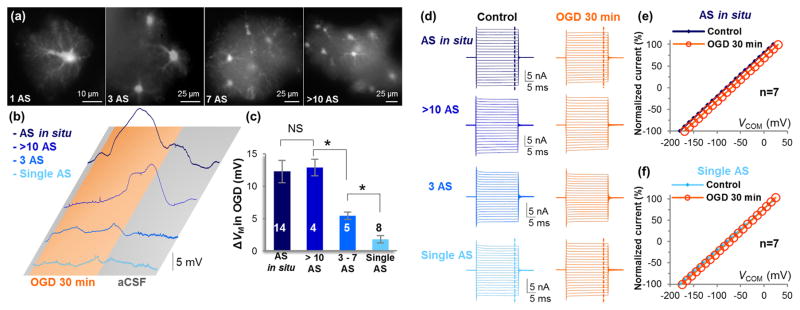
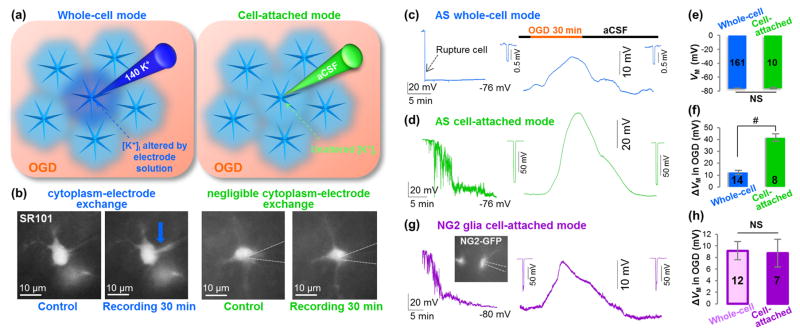
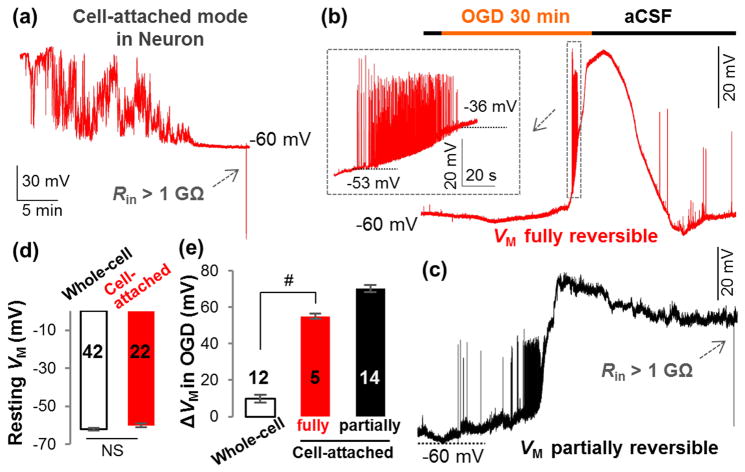
Membrane potential (VM) depolarization occurs immediately following cerebral ischemia and is devastating for the astrocyte homeostasis and neuronal signaling. Previously, an excessive release of extracellular K+ and glutamate has been shown to underlie an ischemia-induced VM depolarization. Ischemic insults should impair membrane ion channels and disrupt the physiological ion gradients. However, their respective contribution to ischemia-induced neuronal and glial depolarization and loss of neuronal excitability are unanswered questions. A short-term oxygen-glucose deprivation (OGD) was used for the purpose of examining the acute effect of ischemic conditions on ion channel activity and physiological K+ gradient in neurons and glial cells. We show that a 30 min OGD treatment exerted no measurable damage to the function of membrane ion channels in neurons, astrocytes, and NG2 glia. As a result of the resilience of membrane ion channels, neuronal spikes last twice as long as our previously reported 15 min time window. In the electrophysiological analysis, a 30 min OGD-induced dissipation of transmembrane K+ gradient contributed differently in brain cell depolarization: severe in astrocytes and neurons, and undetectable in NG2 glia. The discrete cellular responses to OGD corresponded to a total loss of 69% of the intracellular K+ contents in hippocampal slices as measured by Inductively Coupled Plasma Mass Spectrometry (ICP-MS). A major brain cell depolarization mechanism identified here is important for our understanding of cerebral ischemia pathology. Additionally, further understanding of the resilient response of NG2 glia to ischemia-induced intracellular K+ loss and depolarization should facilitate the development of future stroke therapy.

Keywords: Astrocytes; Brain ischemia; Ion channel; NG2 glia; Neurons.


Conflict of interest statement

Conflicting interests

None.

Figures

Figure 1
Figure 1. Electrophysiological responses of hippocampal astrocyte, NG2 glia and pyramidal neuron to OGD
(a-c) An astrocyte identified by SR101 staining, an NG2 glia devoid of SR101 staining, and a pyramidal neuron in CA1 region. (d-f) Representative whole-cell current profiles of an astrocyte, an NG2 glia, and a pyramidal neuron. Inset in (d), voltage steps (VCOM) were from -180 mV to +20 mV in 10 mV increments. The bottom panel in (f), action potentials induced by 100–200 pA/50 ms current pulses (ICOM). (g-i) A 30 min OGD-induced VM response of three cell types. Inset in (i), the neuronal action potentials occurred and vanished during OGD-induced depolarization.
Figure 2
Figure 2. OGD induces no detectable damage to astrocytic and NG2 glial membrane ion channels
(a) A single freshly dissociated astrocyte stained with SR101. (b) Schematic illustration of OGD-induced K+ gradient dissipation (left, “[K+]i non-clamped”), and masked this [K+]i loss due to dialysis of the cell by electrode solution (right, “[K+]i clamped”). (c-d) Under [K+]i clamped condition, OGD-induced depolarization was eliminated. NS: no significant difference (P>0.05, ANOVA). (e) Unchanged Rin in astrocyte during recording (P>0.05, paired sample t-test). (f-g) Dual patch single astrocyte recording for analysis of membrane conductance (GM). In VC mode (left electrode), the cell was held at -80 mV. The delivered command voltages (VCOM) were ±50 mV/25 ms separated by 30 ms intervals. The VCOM-induced membrane current (ΔIM) was recorded using the same electrode. The CC mode (right electrode) was set in I=0 mode to record the VCOM-induced change in membrane voltage (ΔVM). (g) Shows the recorded ΔVM and ΔIM. (h) The summary shows no OGD-induced change in astrocyte GM (P>0.05, paired sample t-test). (i-j) Unaltered current profile of NG2 glia in control and OGD. Inset in (i), VCOM ranging from -180 mV to +40 mV in 10 mV increments. (k-m) The I-V plots of NG2 glial IKa, IKd, and IKir before and 30 min in OGD. Current at each step was compared between control and OGD and no significant change was found in these ion channels (P>0.05, paired sample t-test).
Figure 3
Figure 3. A short-term OGD does not alter the activity of voltage-gated ion channels or the excitability of cultured hippocampal neurons
(a-b) DIC image and a representative whole-cell current profile of a cultured hippocampal neuron. The cultured hippocampal neuron expressed voltage-gated Na+ and K+ current conductance as neurons in hippocampal slices. Inset in (b), VCOM ranging from -180 mV to +40 mV in 10 mV increments. (c) Three different patterns of neuronal spontaneous firing response to OGD. (d) In 10/23 cultured neurons, OGD induced a small depolarization compared to a large neuronal depolarization in slice (#, P<0.01, t-test). (e) In 13/23 cultured neurons, OGD induced no detectable depolarization (NS, P>0.05, ANOVA). (f-i) Representative induced action potentials in control and OGD. ICOM in insets: 100 pA/500 ms in (f); 200 pA/500 ms in (h). (j-k) The number and amplitude of induced action potentials were not altered after 30 min OGD (P>0.05, paired sample t-test).
Figure 4
Figure 4. OGD does not alter the activity of neuronal membrane ion channels
(a-b) Representative current profiles of a cultured hippocampal neuron in control and OGD. Inset in (a), VCOM ranging from -180 mV to +40 mV in 10 mV increments. (c) A 30 min OGD induced no change in the current density of voltage-gated ion channels: INa at VCOM -30~-40 mV; IKa and IKd both at VCOM +40 mV (P>0.05, paired sample t-test). (d-f) The I-V plots of INa, IKa, and IKd. Current at each step was compared between control and OGD and no significant change was found in these ion channels (P>0.05, paired sample t-test).
Figure 5
Figure 5. OGD-induced depolarization increases with more astrocytes coupling into a syncytium
(a) SR101 staining of a single freshly dissociated astrocyte, and three “miniature syncytia” with a varied number of astrocytes as indicated. AS: astrocyte. (b) OGD-induced VM depolarization increases with the number of coupled astrocytes. (c) Quantification of OGD-induced ΔVM in (b) (NS, P>0.05; *, P<0.05, ANOVA). (d) Representative astrocyte whole-cell currents recorded before and at the end of 30 min OGD under uncoupled and varied coupling syncytial sizes. (e) Normalized I-V plots show an OGD-induced positive shift in I-V plot (depolarization), but no suppression of passive conductance change in astrocyte in situ. (f) OGD induced neither a shift in I-V plot nor reduction in passive conductance in single astrocytes.
Figure 6
Figure 6. K+ gradient dissipation contributes significantly to OGD-induced astrocyte depolarization
(a) Schematic diagram of conventional whole-cell mode (left), and cell-attached mode (right) for VM recording in syncytial-coupled astrocytes. (b) SR101 fluorescence in recording electrode shows cytoplasm-electrode exchange in whole-cell mode (blue arrow), but not in cell-attached mode. (c-d) Representative VM recording in whole-cell mode (c) and in cell-attached mode (d) of astrocytes in situ. Insets show unchanged Rin. (e) Quantification of VM shows no significant difference of the VM recorded in whole-cell and cell-attached modes (P>0.05, t-test). (f) The OGD-induced astrocytes ΔVM is significantly greater in cell-attached mode than in whole-cell mode (P<0.01, t-test). (g) Representative VM recording of NG2 glia in cell-attached mode. Insets show unchanged Rin. (h) The OGD-induced NG2 glia ΔVM is comparable in cell-attached mode and in whole-cell mode (P>0.05, t-test).
Figure 7
Figure 7. K+ gradient dissipation contributes significantly to OGD-induced neuronal depolarization
(a) Cell-attached VM recording from a hippocampal pyramidal neuron in situ. Two types of VM responses to OGD are shown in (b) (fully reversible) and (c) (partially reversible). Inset in (b), the neuronal action potentials occurred and vanished during OGD-induced depolarization. (d) The resting VM recorded in cell-attached (a) and conventional whole-cell modes are comparable in pyramidal neurons (P>0.05, t-test). (e) For the neurons with fully reversible VM, OGD-induced depolarization (ΔVM) was significantly greater in cell-attached mode than that of whole-cell mode (P<0.01, t-test). The OGD-induced depolarization from neurons with partially reversible VM is shown in a separate column in (e) but was not included in the statistical comparison.

Similar articles

Cited by

References

    1. Muller M, Somjen GG. Na(+) and K(+) concentrations, extra- and intracellular voltages, and the effect of TTX in hypoxic rat hippocampal slices. Journal of neurophysiology. 2000;83:735–45. - PubMed
    1. Leblond J, Krnjevic K. Hypoxic changes in hippocampal neurons. Journal of neurophysiology. 1989;62:1–14. - PubMed
    1. Kimelberg HK, Goderie SK, Higman S, Pang S, Waniewski RA. Swelling-induced release of glutamate, aspartate, and taurine from astrocyte cultures. J Neurosci. 1990;10:1583–91. - PMC - PubMed
    1. Rossi DJ, Oshima T, Attwell D. Glutamate release in severe brain ischaemia is mainly by reversed uptake. Nature. 2000;403:316–21. - PubMed
    1. Fleidervish IA, Gebhardt C, Astman N, Gutnick MJ, Heinemann U. Enhanced spontaneous transmitter release is the earliest consequence of neocortical hypoxia that can explain the disruption of normal circuit function. J Neurosci. 2001;21:4600–8. - PMC - PubMed

Publication types

MeSH terms