Meta-Analysis
. 2018 Apr:87:106-117.
doi: 10.1016/j.neubiorev.2018.01.008. Epub 2018 Feb 20.

Meta-analysis and systematic review of the literature characterizing auditory mismatch negativity in individuals with autism

Affiliations
Meta-Analysis

Meta-analysis and systematic review of the literature characterizing auditory mismatch negativity in individuals with autism

Sophie Schwartz et al. Neurosci Biobehav Rev. 2018 Apr.

Abstract

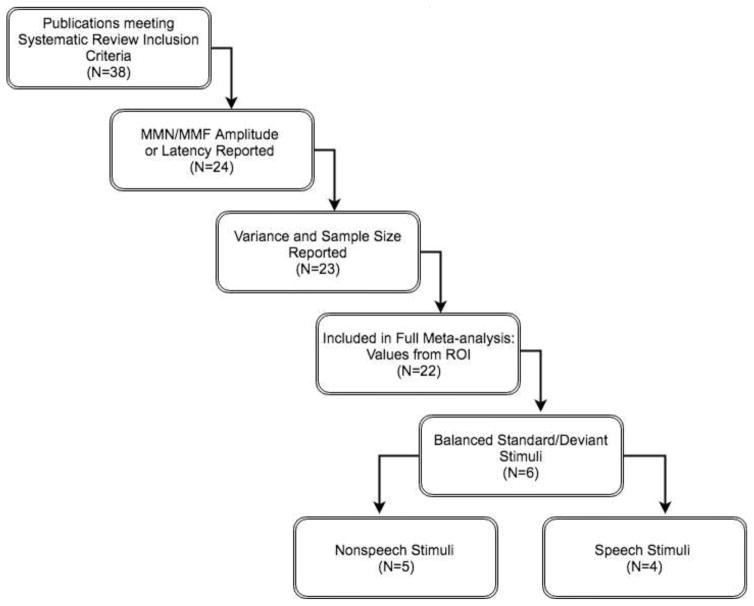
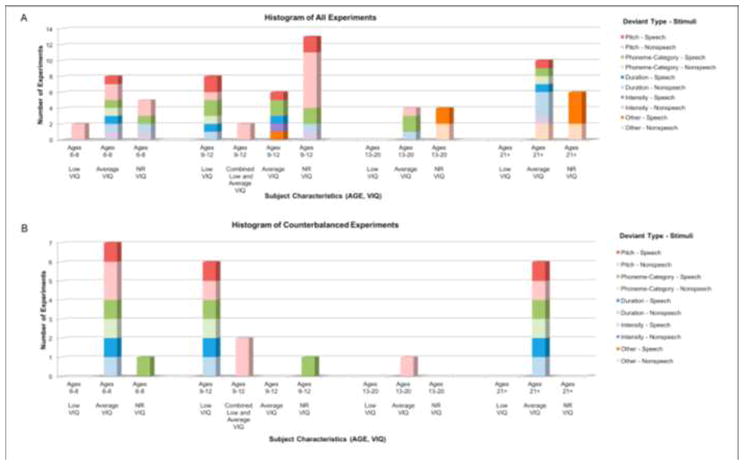
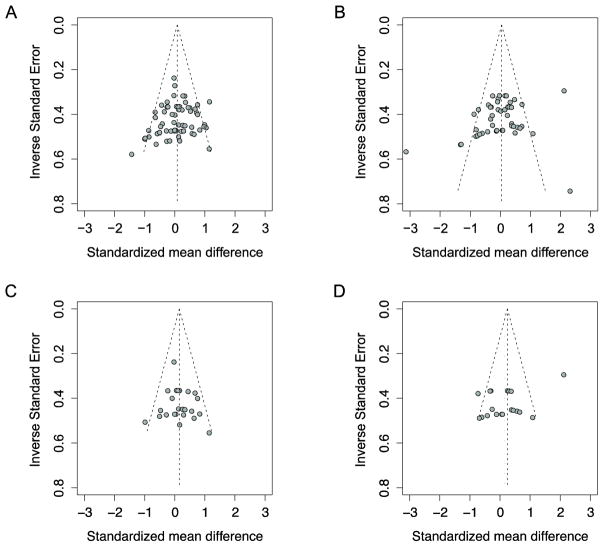
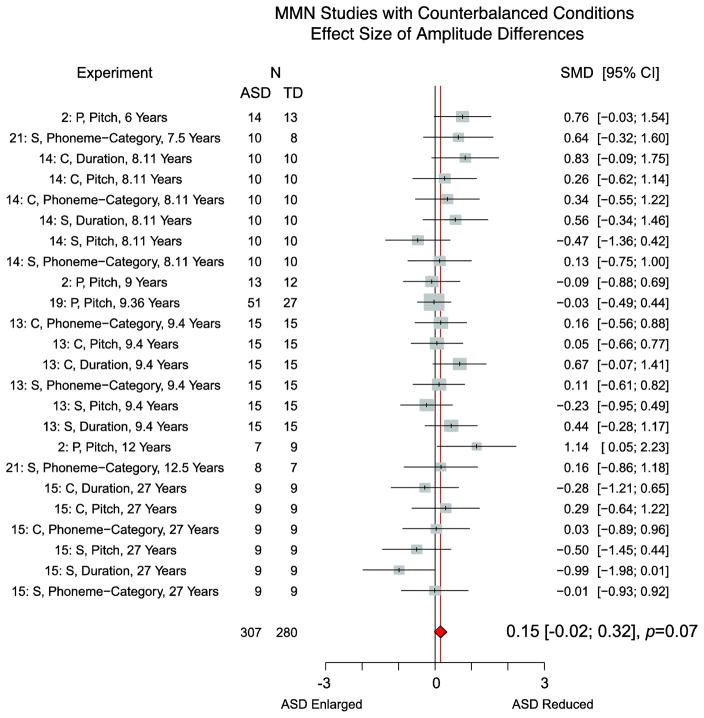
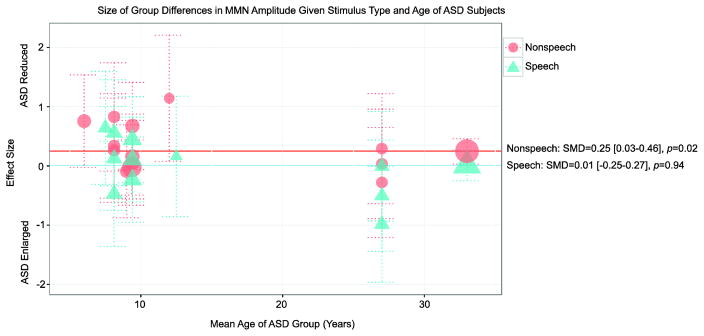
A number of past studies have used mismatch negativity (MMN) to identify auditory processing deficits in individuals with autism spectrum disorder (ASD). Our meta-analysis compared MMN responses for individuals with ASD and typically developing controls (TD). We analyzed 67 experiments across 22 publications that employed passive, auditory-based MMN paradigms with ASD and TD participants. Most studies lacked design characteristics that would lead to an accurate description of the MMN. Variability between experiments measuring MMN amplitude was smaller when limited to studies that counterbalanced stimuli. Reduced MMN amplitude was found among young children with ASD compared to controls and in experiments that used nonspeech sounds. Still, few studies included adolescents or those with below-average verbal IQ. Most studies suffered from small sample sizes, and aggregating these data did not reveal significant group differences. This analysis points to a need for research focused specifically on understudied ASD samples using carefully designed MMN experiments. Study of individual differences in MMN may provide further insights into distinct subgroups within the heterogeneous ASD population.

Keywords: Auditory processing; Autism; Event-related potential; MMF; MMN; Meta-analysis; Mismatch field; Mismatch negativity; Oddball; Systematic review.


Figures

Figure 1
Figure 1. Flow Chart of Selection for Meta-analysis
N values represent total number of publications in which experiments were reported. Values were considered as from regions of interest (ROI) when EEG data was collected from mid-frontal electrodes and MEG data was source localized to supratemporal generators.
Figure 2
Figure 2. Histogram of (A) all 67 experiments included in this meta-analysis and (B) 24 counterbalanced experiments
Experiments are classified by average age and verbal intelligence standard score of ASD participants. Average or above-average verbal intelligence (“Average VIQ”) is defined by average standard scores of 90 or above. Below average verbal IQ (“Low VIQ”) is defined by average standard scores below 80. Samples that fall between average standard scores of 80 and 90, around the cutoff score for disability (85) are considered as “Combined Low and Average” VIQ samples. Experiments are also classified based on the auditory feature which is deviating (“Deviant Type”) and the nature of the stimuli (“Speech” or “Nonspeech”). The “Other” category includes experiments that deviated stimuli based on “emotional content” (e.g., cheerful, angry, commanding, or sad), gap, or location.
Figure 3
Figure 3. Symmetrical funnel plots suggest no evidence of publication bias based on amplitude effect sizes from (A) the full sample and (C) the counterbalanced sample. In contrast, some evidence of publication bias based on latency effect sizes from (B) the full sample and (D) the counterbalanced sample
Egger’s regression tests: A. Intercept = −1.23 [95% standard error confidence interval: −2.88–0.41], t = −1.47, p>0.05; B. Intercept: −3.16 [95% standard error confidence interval: −5.90– −0.42], t = −2.26, p=0.02. C: Intercept: 0.57 [95% standard error confidence interval: −1.55–2.68], t=0.53, p>0.05. D: Intercept: −6.03 [95% standard error confidence interval: −11.29– −0.76], t=−2.24, p=0.04
Figure 4
Figure 4. Meta-analysis of MMN amplitude differences in experiments that counterbalanced deviant and standard stimuli, organized by mean age of the ASD group
Effect size is governed by standardized mean difference value (SMD). Experiment indicated by “Publication Number, as indicated in Table 1: Stimulus type, Deviant Type, (Mean ASD Age)”. Stimulus Type: P=Pure Tone, S=Speech, C=Complex Tone.
Figure 5
Figure 5. Size of group differences in MMN amplitude given stimulus type and mean age of ASD group
Data point sizes are weighted based on the experiment’s full sample size.

Similar articles

Cited by

References

    1. Aaltonen O, Tuomainen J, Laine M, Niemi P. Cortical Differences in Tonal versus Vowel Processing as Revealed by an ERP Component Called Mismatch Negativity (MMN) Brain and Language. 1993;44(2):139–152. doi: 10.1006/brln.1993.1009. - DOI - PubMed
    1. Abdeltawwab MM, Baz H. Automatic Pre-Attentive Auditory Responses: MMN to Tone Burst Frequency Changes in Autistic School-Age Children. The Journal of International Advanced Otology. 2015;11(1):36–41. doi: 10.5152/iao.2014.438. - DOI - PubMed
    1. American Psychiatric Association. Diagnostic and statistical manual of mental disorders (DSM-5®) American Psychiatric Pub; 2013.
    1. Andersson S, Posserud MB, Lundervold AJ. Early and late auditory event-related potentials in cognitively high functioning male adolescents with autism spectrum disorder. Research in Autism Spectrum Disorders. 2013;7(7):815–823. doi: 10.1016/j.rasd.2013.03.007. - DOI
    1. Barry RJ, Clarke AR, Johnstone SJ. A review of electrophysiology in attention-deficit/hyperactivity disorder: I. Qualitative and quantitative electroencephalography. Clinical Neurophysiology. 2003;114(2):171–183. doi: 10.1016/S1388-2457(02)00362-0. - DOI - PubMed

Publication types

MeSH terms