

Cluster-level statistical inference in fMRI datasets: The unexpected behavior of random fields in high dimensions
- PMID: 29408478
- PMCID: PMC5991838
- DOI: 10.1016/j.mri.2018.01.004
Cluster-level statistical inference in fMRI datasets: The unexpected behavior of random fields in high dimensions
Abstract
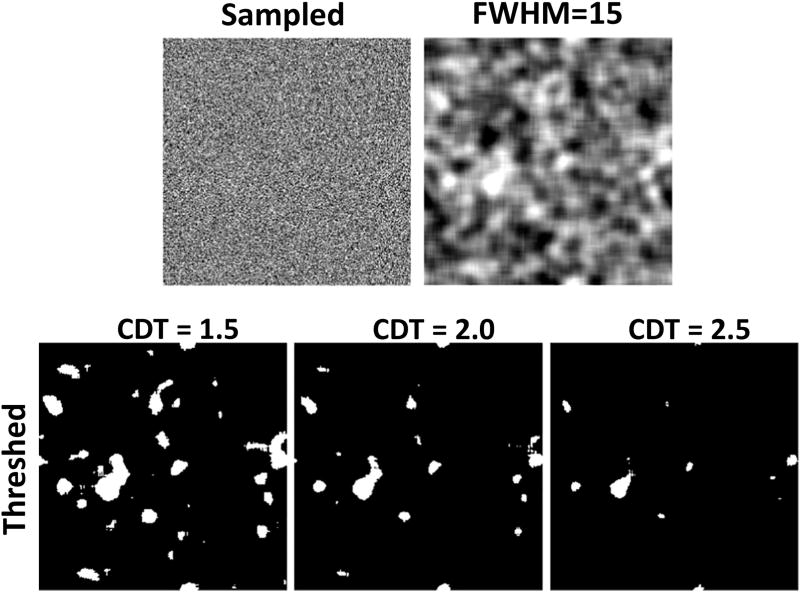
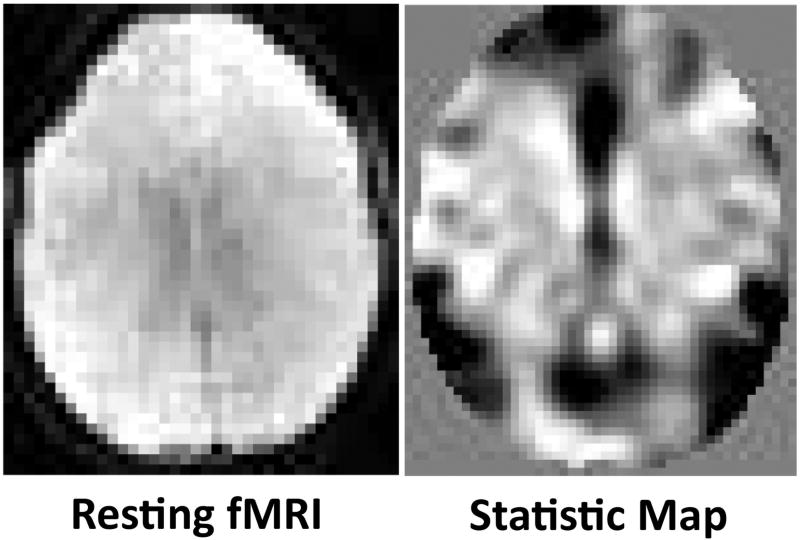
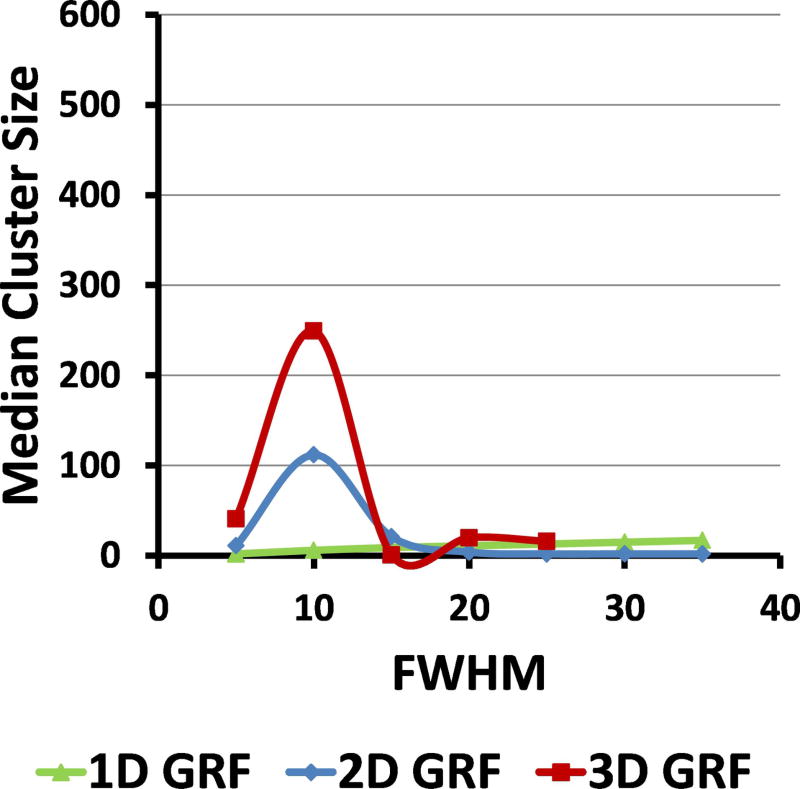
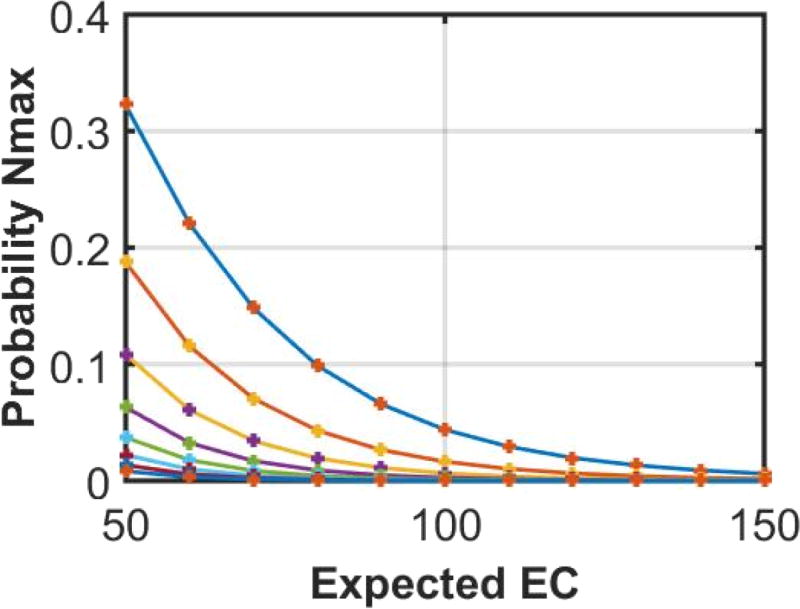
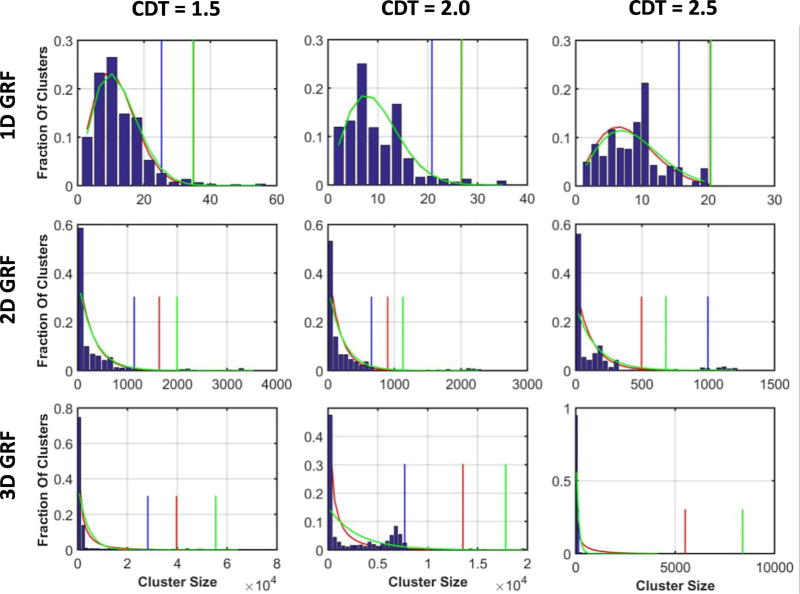
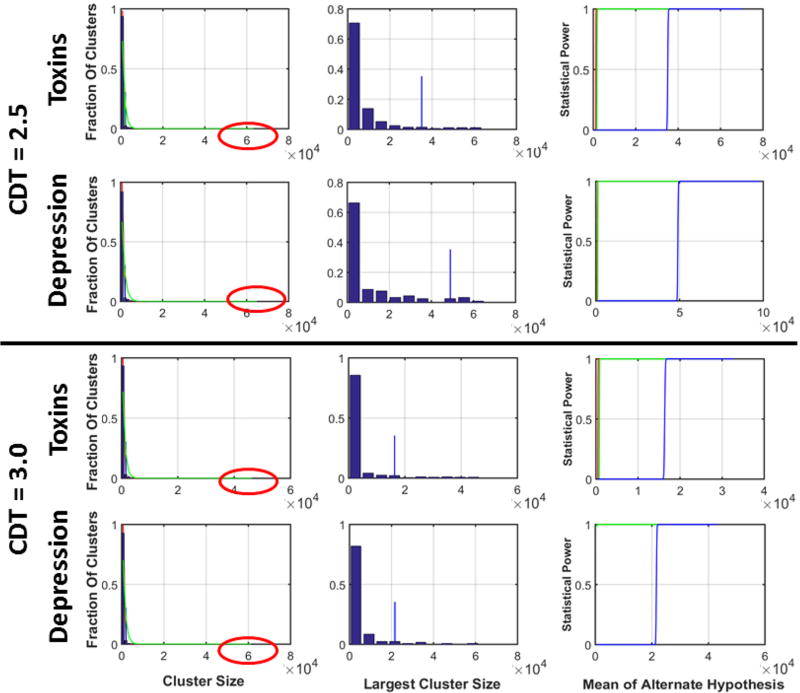
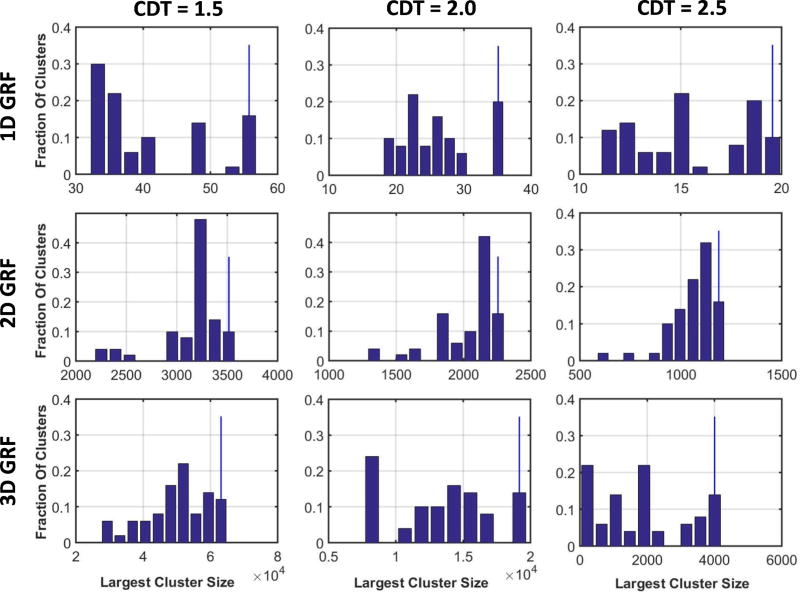
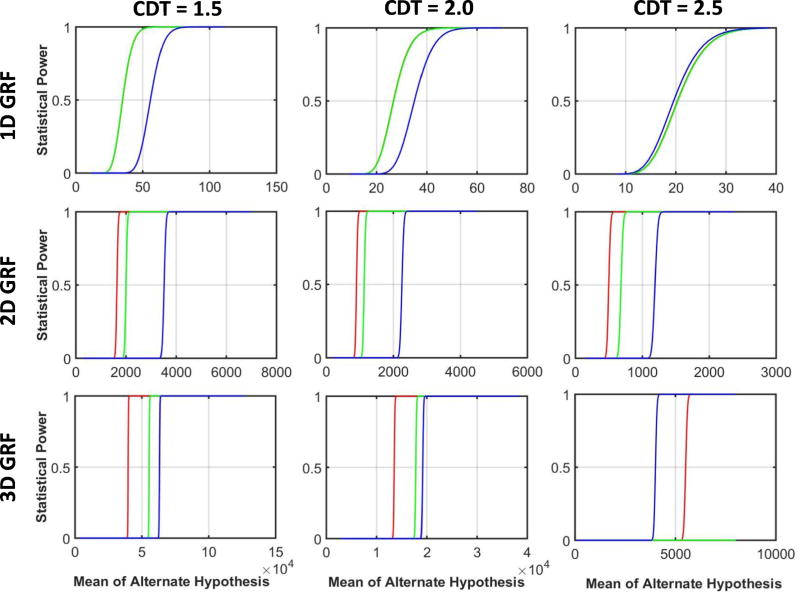
Identifying regional effects of interest in MRI datasets usually entails testing a priori hypotheses across many thousands of brain voxels, requiring control for false positive findings in these multiple hypotheses testing. Recent studies have suggested that parametric statistical methods may have incorrectly modeled functional MRI data, thereby leading to higher false positive rates than their nominal rates. Nonparametric methods for statistical inference when conducting multiple statistical tests, in contrast, are thought to produce false positives at the nominal rate, which has thus led to the suggestion that previously reported studies should reanalyze their fMRI data using nonparametric tools. To understand better why parametric methods may yield excessive false positives, we assessed their performance when applied both to simulated datasets of 1D, 2D, and 3D Gaussian Random Fields (GRFs) and to 710 real-world, resting-state fMRI datasets. We showed that both the simulated 2D and 3D GRFs and the real-world data contain a small percentage (<6%) of very large clusters (on average 60 times larger than the average cluster size), which were not present in 1D GRFs. These unexpectedly large clusters were deemed statistically significant using parametric methods, leading to empirical familywise error rates (FWERs) as high as 65%: the high empirical FWERs were not a consequence of parametric methods failing to model spatial smoothness accurately, but rather of these very large clusters that are inherently present in smooth, high-dimensional random fields. In fact, when discounting these very large clusters, the empirical FWER for parametric methods was 3.24%. Furthermore, even an empirical FWER of 65% would yield on average less than one of those very large clusters in each brain-wide analysis. Nonparametric methods, in contrast, estimated distributions from those large clusters, and therefore, by construct rejected the large clusters as false positives at the nominal FWERs. Those rejected clusters were outlying values in the distribution of cluster size but cannot be distinguished from true positive findings without further analyses, including assessing whether fMRI signal in those regions correlates with other clinical, behavioral, or cognitive measures. Rejecting the large clusters, however, significantly reduced the statistical power of nonparametric methods in detecting true findings compared with parametric methods, which would have detected most true findings that are essential for making valid biological inferences in MRI data. Parametric analyses, in contrast, detected most true findings while generating relatively few false positives: on average, less than one of those very large clusters would be deemed a true finding in each brain-wide analysis. We therefore recommend the continued use of parametric methods that model nonstationary smoothness for cluster-level, familywise control of false positives, particularly when using a Cluster Defining Threshold of 2.5 or higher, and subsequently assessing rigorously the biological plausibility of the findings, even for large clusters. Finally, because nonparametric methods yielded a large reduction in statistical power to detect true positive findings, we conclude that the modest reduction in false positive findings that nonparametric analyses afford does not warrant a re-analysis of previously published fMRI studies using nonparametric techniques.
Keywords: Cluster level inference; Euler characteristics; Family wise error rates; Parametric testing; Permutation testing; Random fields.
Copyright © 2018 Elsevier Inc. All rights reserved.
Conflict of interest statement
Authors report no financial relationships with commercial interests.
Figures
Similar articles
-
Cluster failure: Why fMRI inferences for spatial extent have inflated false-positive rates.Proc Natl Acad Sci U S A. 2016 Jul 12;113(28):7900-5. doi: 10.1073/pnas.1602413113. Epub 2016 Jun 28. Proc Natl Acad Sci U S A. 2016. PMID: 27357684 Free PMC article.
-
Accounting for Non-Gaussian Sources of Spatial Correlation in Parametric Functional Magnetic Resonance Imaging Paradigms II: A Method to Obtain First-Level Analysis Residuals with Uniform and Gaussian Spatial Autocorrelation Function and Independent and Identically Distributed Time-Series.Brain Connect. 2018 Feb;8(1):10-21. doi: 10.1089/brain.2017.0522. Brain Connect. 2018. PMID: 29161884
-
Accounting for Non-Gaussian Sources of Spatial Correlation in Parametric Functional Magnetic Resonance Imaging Paradigms I: Revisiting Cluster-Based Inferences.Brain Connect. 2018 Feb;8(1):1-9. doi: 10.1089/brain.2017.0521. Brain Connect. 2018. PMID: 28927289
-
Nonparametric analysis of statistic images from functional mapping experiments.J Cereb Blood Flow Metab. 1996 Jan;16(1):7-22. doi: 10.1097/00004647-199601000-00002. J Cereb Blood Flow Metab. 1996. PMID: 8530558 Review.
-
Controlling the familywise error rate in functional neuroimaging: a comparative review.Stat Methods Med Res. 2003 Oct;12(5):419-46. doi: 10.1191/0962280203sm341ra. Stat Methods Med Res. 2003. PMID: 14599004 Review.
Cited by
-
Frequency-dependent changes in fractional amplitude of low-frequency oscillations in Alzheimer's disease: a resting-state fMRI study.Brain Imaging Behav. 2020 Dec;14(6):2187-2201. doi: 10.1007/s11682-019-00169-6. Brain Imaging Behav. 2020. PMID: 31478145
-
Shared subcortical arousal systems across sensory modalities during transient modulation of attention.Neuroimage. 2025 May 15;312:121224. doi: 10.1016/j.neuroimage.2025.121224. Epub 2025 Apr 16. Neuroimage. 2025. PMID: 40250641 Free PMC article.
-
Altered Brain Morphometry in Cerebral Small Vessel Disease With Cerebral Microbleeds: An Investigation Combining Univariate and Multivariate Pattern Analyses.Front Neurol. 2022 Feb 23;13:819055. doi: 10.3389/fneur.2022.819055. eCollection 2022. Front Neurol. 2022. PMID: 35280297 Free PMC article.
-
Distinct Spontaneous Brain Activity Patterns in Different Biologically-Defined Alzheimer's Disease Cognitive Stage: A Preliminary Study.Front Aging Neurosci. 2019 Dec 17;11:350. doi: 10.3389/fnagi.2019.00350. eCollection 2019. Front Aging Neurosci. 2019. PMID: 32009939 Free PMC article.
-
Internally Guided Lower Limb Movement Recruits Compensatory Cerebellar Activity in People With Parkinson's Disease.Front Neurol. 2019 Jun 7;10:537. doi: 10.3389/fneur.2019.00537. eCollection 2019. Front Neurol. 2019. PMID: 31231297 Free PMC article.
References
-
- Sowell ER, Peterson BS, Thompson PM, Welcome SE, Henkenius AL, Toga AW. Mapping Cortical Change Across the Human Life Span. Nature Neuroscience. 2003:309–15. - PubMed
-
- Sowell ER, Thompson PM, Toga AW. Mapping changes in the human cortex throughout the span of life. Neuroscientist. 2004;10(4):372–92. - PubMed
-
- Sowell ER, Jernigan TL. Further MRI evidence of late brain maturation: Limbic volume increases and changing asymmetries during childhood and adolescence. Dev Neuropsychol. 1998;14(4):599–617.
Publication types
MeSH terms
Grants and funding
LinkOut - more resources
Full Text Sources
Other Literature Sources
Medical
