. 2018 Apr 2;128(4):1615-1626.
doi: 10.1172/JCI94230. Epub 2018 Mar 19.

FoxO transcription factors are required for hepatic HDL cholesterol clearance

Affiliations

FoxO transcription factors are required for hepatic HDL cholesterol clearance

Samuel X Lee et al. J Clin Invest. .

Abstract

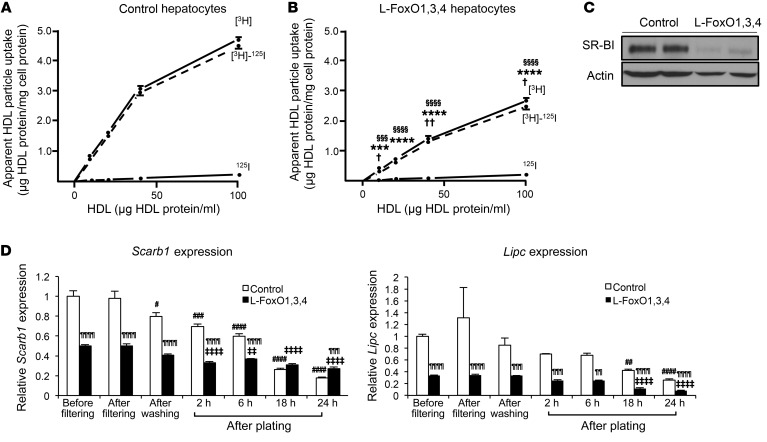
Insulin resistance and type 2 diabetes are associated with low levels of high-density lipoprotein cholesterol (HDL-C). The insulin-repressible FoxO transcription factors are potential mediators of the effect of insulin on HDL-C. FoxOs mediate a substantial portion of insulin-regulated transcription, and poor FoxO repression is thought to contribute to the excessive glucose production in diabetes. In this work, we show that mice with liver-specific triple FoxO knockout (L-FoxO1,3,4), which are known to have reduced hepatic glucose production, also have increased HDL-C. This was associated with decreased expression of the HDL-C clearance factors scavenger receptor class B type I (SR-BI) and hepatic lipase and defective selective uptake of HDL cholesteryl ester by the liver. The phenotype could be rescued by re-expression of SR-BI. These findings demonstrate that hepatic FoxOs are required for cholesterol homeostasis and HDL-mediated reverse cholesterol transport to the liver.

Keywords: Cholesterol; Insulin signaling; Lipoproteins; Metabolism.


Conflict of interest statement

Conflict of interest: The authors have declared that no conflict of interest exists.

Figures

Figure 1
Figure 1. Plasma cholesterol profiles of chow-fed and WTD-fed L-FoxO1,3,4 mice.
(A) Total plasma cholesterol in chow-fed L-FoxO1,3,4 mice and littermate controls after a 5-hour fast (n = 5). Data are presented as the mean ± SEM. (B) Cholesterol levels in plasma fractionated by FPLC in the same mice as in A. (C) Western blot of plasma apoA-I and apoE from pooled pairs of fractionated plasma obtained from FPLC in B. (D) Total plasma cholesterol levels in WTD-fed L-FoxO1,3,4 mice and littermate controls after a 5-hour fast (n = 5). (E) Cholesterol levels in plasma fractionated by FPLC in the same mice as in D. (F) Western blot of plasma apoA-I and apoE from pooled pairs of fractionated plasma obtained from FPLC in E. Independent FPLC cholesterol profiles for both chow-fed and WTD-fed mice yielded qualitatively identical results. Data are presented as the mean ± SEM. *P < 0.05 and **P < 0.01, by Student’s t test.
Figure 2
Figure 2. Defects in HDL metabolism genes due to ablation of hepatic FoxOs.
(A and B) Relative hepatic gene expression by qPCR in (A) chow-fed L-FoxO1,3,4 mice and littermate controls (n = 4–5) and (B) WTD-fed L-FoxO1,3,4 mice and littermate controls (n = 6–7). (C) Representative Western blot of hepatic SR-BI expression in both chow-fed and WTD-fed L-FoxO1,3,4 mice and littermate controls. SR-BI/actin denotes relative SR-BI expression levels by densitometric scanning (n = 4/group total). (D) Relative plasma HL activity in WTD-fed L-FoxO1,3,4 mice and littermate controls (n = 5–7). *P < 0.05, **P < 0.01, and ****P < 0.0001; §§P < 0.01 between chow-fed L-FoxO1,3,4 mice and littermate controls; ††P < 0.01 between WTD-fed L-FoxO1,3,4 mice and littermate controls by Student’s t test. Data are presented as the mean ± SEM.
Figure 3
Figure 3. Plasma decay kinetics of 125I-TC–/[3H]CEt-WT-HDL in chow-fed L-FoxO1,3,4 mice.
(A and B) 125I-TC–/[3H]CEt-WT-HDL was injected i.v. into chow-fed L-FoxO1,3,4 mice and littermate controls. Thereafter, over a 24-hour period, blood samples were harvested periodically, and plasma was analyzed for 125I-TC (crosses) and [3H]CEt (circles). The y axis represents the fraction of the tracer in plasma (percentage). Shown is a trace from a representative mouse from each genotype, with (A) control and (B) L-FoxO1,3,4 mice. The experiment was performed in 7 control and 5 L-FoxO1,3,4 mice.
Figure 4
Figure 4. Plasma FCRs and tissue tracer uptake rates for 125I-TC–/[3H]CEt-WT-HDL in chow-fed L-FoxO1,3,4 mice.
125I-TC–/[3H]CEt-WT-HDL was injected i.v. into chow-fed L-FoxO1,3,4 mice and littermate controls. (A) During the subsequent 24-hour period, blood was harvested periodically to determine the plasma decay of both tracers. 125I-TC (125I) and [3H]CEt ([3H]) were analyzed, and plasma FCRs for 125I-TC and [3H]CEt were calculated. The difference in plasma FCRs between [3H]CEt and 125I-TC was calculated. Twenty-four hours after tracer injection, the animals were euthanized, and tissues were analyzed for both tracers. (B) Liver, (C) adrenal gland, and (D) kidney organ FCRs for 125I-TC (125I) and [3H]CEt ([3H]). The difference in organ FCRs between [3H]CEt and 125I-TC ([3H]CEt – 125I-TC) was calculated. All calculations were done as described in Methods. n = 7 control mice; n = 5 L-FoxO1,3,4 mice. An independent experiment yielded qualitatively identical results. **P < 0.01, ***P < 0.001, and ****P ≤ 0.0001, by Student’s t test. No significant differences between genotypes were detected in adrenal glands. Data are presented as the mean ± SEM.
Figure 5
Figure 5. Uptake of 125I-TC–/[3H]CEt-WT-HDL by hepatocytes isolated from chow-fed L-FoxO1,3,4 mice.
(A and B) Hepatocytes from chow-fed L-FoxO1,3,4 mice and littermate controls were incubated (37°C, 2 hours) in medium containing 125I-TC–/[3H]CEt-WT-HDL (10, 20, 40, or 100 μg HDL protein/ml). Finally, cells were harvested, and apparent HDL particle uptake was analyzed as outlined in Methods. Values represent the mean of (A) n = 3 (control) and (B) n = 3 (L-FoxO1,3,4) independent determinations. An independent similar experiment yielded qualitatively identical results. Where no error bars are visible, the SEM was smaller than the symbol. (C) Western blots of SR-BI in primary hepatocytes from L-FoxO1,3,4 mice and littermate controls. Representative bands are shown. Two independent experiments yielded qualitatively identical results. (D) Relative Scarb1 and Lipc expression by qPCR in hepatocytes from chow-fed L-FoxO1,3,4 mice and littermate controls at different stages of the cell isolation procedure (see Methods). (A and B) §§§P < 0.001 and §§§§P < 0.0001, comparing [3H]CEt between L-FoxO1,3,4 and control hepatocytes; ***P < 0.001 and ****P < 0.0001, comparing [3H]CEt – 125I-TC between L-FoxO1,3,4 and control hepatocytes; and P < 0.05 and ††P < 0.01, comparing 125I-TC between L-FoxO1,3,4 and control hepatocytes (Student’s t test). (D) ¶¶P < 0.01, ¶¶¶P < 0.001, and ¶¶¶¶P < 0.0001, comparing gene expression between L-FoxO1,3,4 and control hepatocytes at each stage; #P < 0.05, ##P < 0.01, ###P < 0.001, and ####P < 0.0001, comparing gene expression between control hepatocytes at baseline (before filtering) and control hepatocytes at each stage; and ‡‡P < 0.01 and ‡‡‡‡P < 0.0001, comparing gene expression between L-FoxO1,3,4 hepatocytes at baseline (before filtering) and L-FoxO1,3,4 hepatocytes at each stage (2-way ANOVA, followed by Tukey’s post hoc test). All data are presented as the mean ± SEM.
Figure 6
Figure 6. Ad.SR-BI in WTD-fed L-FoxO1,3,4 mice.
(A) Western blot of hepatic SR-BI expression in WTD-fed L-FoxO1,3,4 mice and littermate controls transduced with Ad.SR-BI or Ad.GFP control virus. SR-BI/actin denotes relative SR-BI expression levels by densitometric scanning (n = 2–4). (B) Cholesterol levels in plasma fractionated by FPLC in the same mice as in A. (C) Western blots of plasma apoA-I and apoE in fractionated plasma obtained from FPLC in B. Lanes a, b, and c correspond to pooled fractions 30–33, 34–39, and 40–45, respectively.
Figure 7
Figure 7. Acute knockdown via Cre adeno-associated virus in chow-fed hepatic FoxO–floxed mice.
(AD) Chow-fed, adult Foxo1fl/fl, Foxo3fl/fl, and Foxo4fl/Y control mice transduced with adeno-associated virus (serotype 8) expressing Cre recombinase driven by the hepatocyte-specific Tbg promoter (AAV8.Tbg.Cre) or control virus (AAV.GFP) (n = 5). For comparison, we also included a group of traditional L-FoxO1,3,4–knockout mice that were not transduced with virus, but rather had FoxO deficiency since birth (n = 4). Four weeks after virus transduction, mice were fasted for five hours, and then plasma and livers were collected. (A) Cholesterol levels in plasma fractionated by FPLC 4 weeks after virus transduction. (B) Relative hepatic gene expression by qPCR. (C) Representative Western blot of hepatic SR-BI expression. SR-BI/actin denotes relative SR-BI expression levels by densitometric scanning. *P < 0.05 and **P < 0.01 versus AAV.GFP mice. No significant difference was detected between AAV8.Tbg.Cre mice and L-FoxO1,3,4 mice. (D) Correlation between Scarb1 or Lipc mRNA and FoxO1 mRNA. The P values in B and C were calculated by 1-way ANOVA, followed by a post hoc t test using the pooled SD, without Bonferroni’s correction. Data are presented as the mean ± SEM.

Similar articles

Cited by

References

    1. Accili D, Arden KC. FoxOs at the crossroads of cellular metabolism, differentiation, and transformation. Cell. 2004;117(4):421–426. doi: 10.1016/S0092-8674(04)00452-0. - DOI - PubMed
    1. Nakae J, et al. Regulation of insulin action and pancreatic beta-cell function by mutated alleles of the gene encoding forkhead transcription factor Foxo1. Nat Genet. 2002;32(2):245–253. doi: 10.1038/ng890. - DOI - PubMed
    1. O-Sullivan I, et al. FoxO1 integrates direct and indirect effects of insulin on hepatic glucose production and glucose utilization. Nat Commun. 2015;6:7079. - PMC - PubMed
    1. Lu M, et al. Insulin regulates liver metabolism in vivo in the absence of hepatic Akt and Foxo1. Nat Med. 2012;18(3):388–395. doi: 10.1038/nm.2686. - DOI - PMC - PubMed
    1. Dong XC, et al. Inactivation of hepatic Foxo1 by insulin signaling is required for adaptive nutrient homeostasis and endocrine growth regulation. Cell Metab. 2008;8(1):65–76. doi: 10.1016/j.cmet.2008.06.006. - DOI - PMC - PubMed

Publication types