. 2018 Mar;267(3):576-584.
doi: 10.1097/SLA.0000000000002097.

Pathophysiological Response to Burn Injury in Adults

Affiliations

Pathophysiological Response to Burn Injury in Adults

Mile Stanojcic et al. Ann Surg. 2018 Mar.

Abstract

Objective: The aim of this study was to compare the hypermetabolic, and inflammatory trajectories in burned adults to gain insight into the pathophysiological alterations and outcomes after injury.

Summary of background data: Burn injury leads to a complex response that is associated with hypermetabolism, morbidity, and mortality. The underlying pathophysiology and the correlations between humoral changes and organ function have not been well delineated in adult burn patients.

Methods: Burned adult patients (n = 1288) admitted to our center from 2006 to 2016 were enrolled in this prospective study. Demographics, clinical data, metabolic and inflammatory markers, hypermetabolism, organ function, and clinical outcomes were obtained throughout acute hospitalization. We then stratified patients according to burn size (<20%, 20% to 40%, and >40% total body surface area [TBSA]) and compared biomedical profiles and clinical outcomes for these patients.

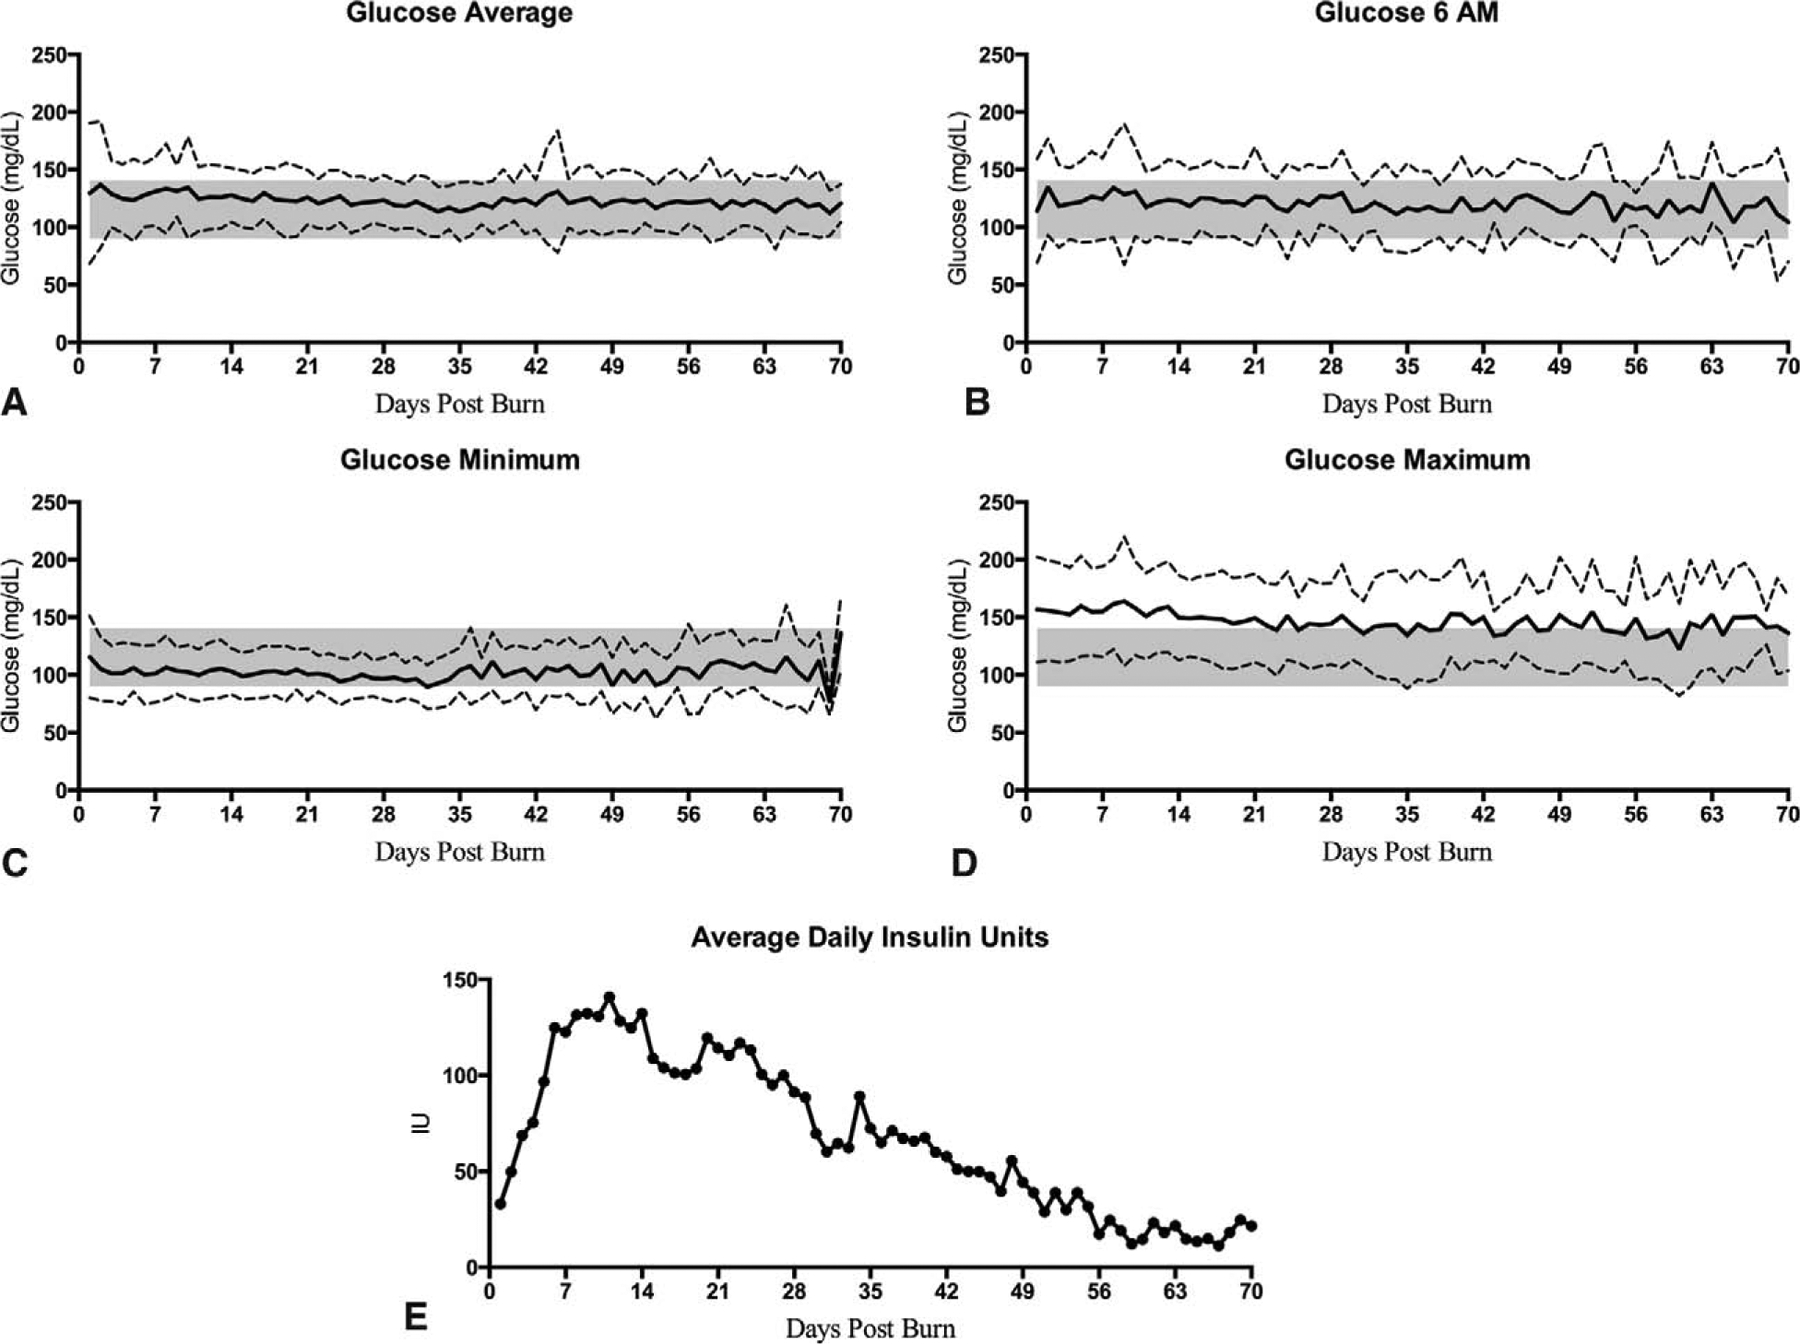
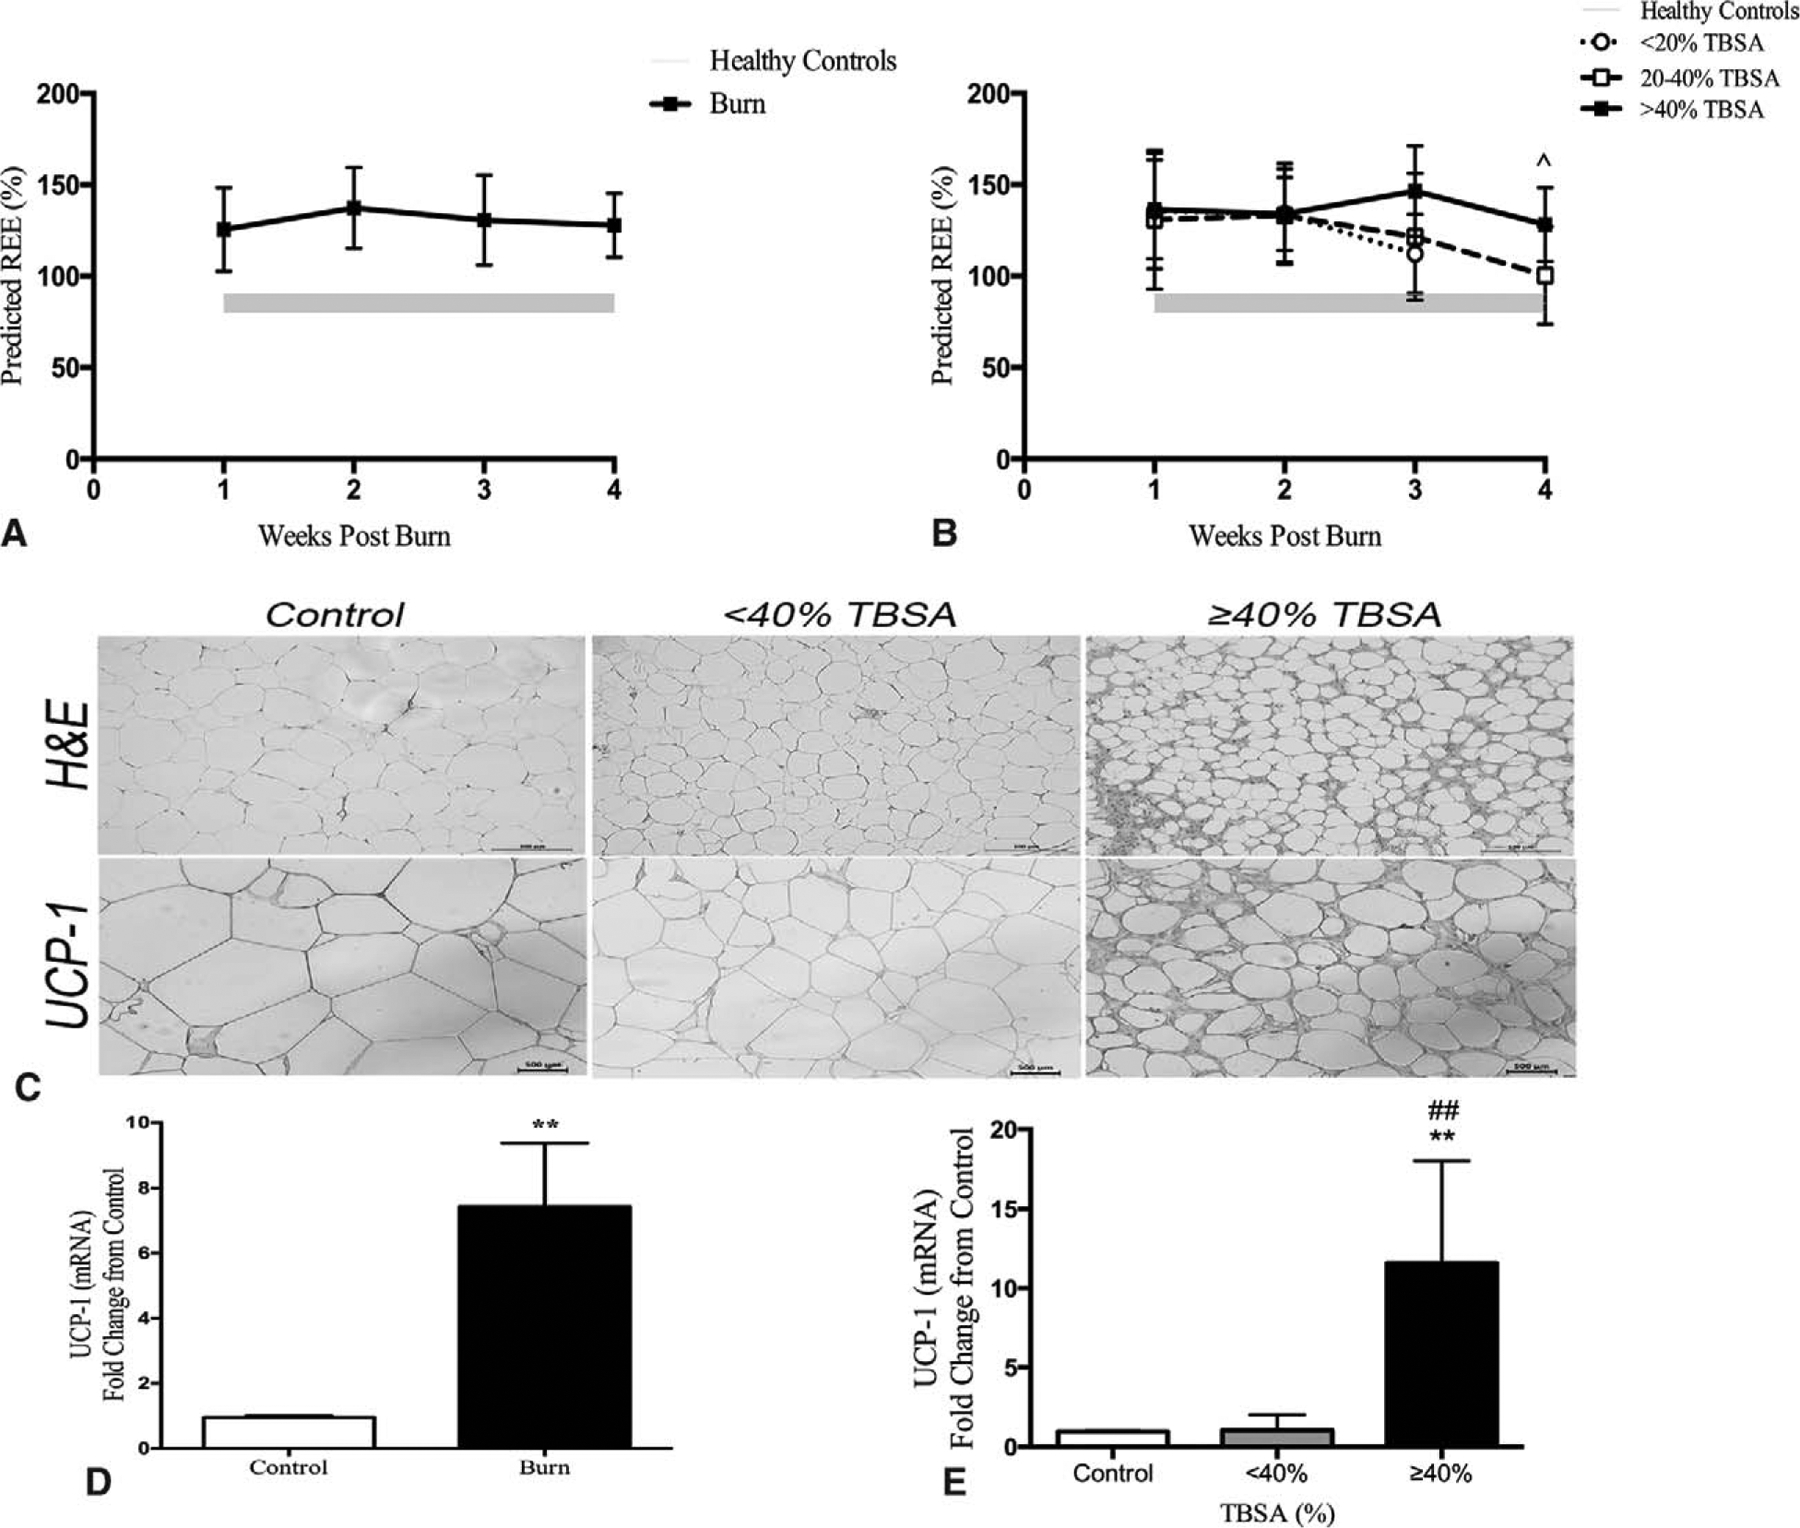
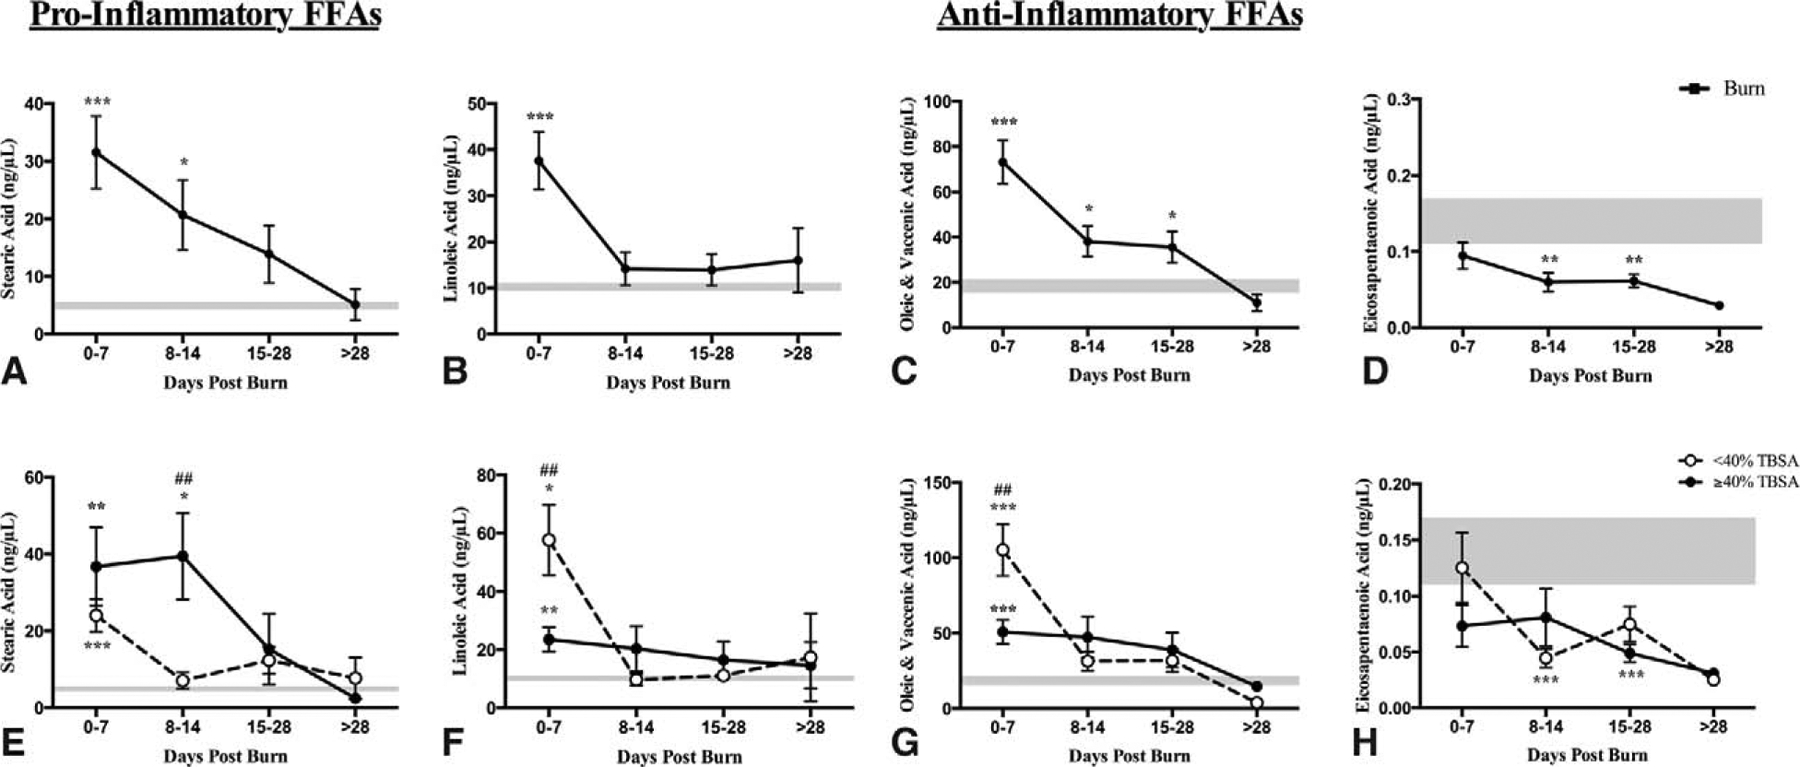
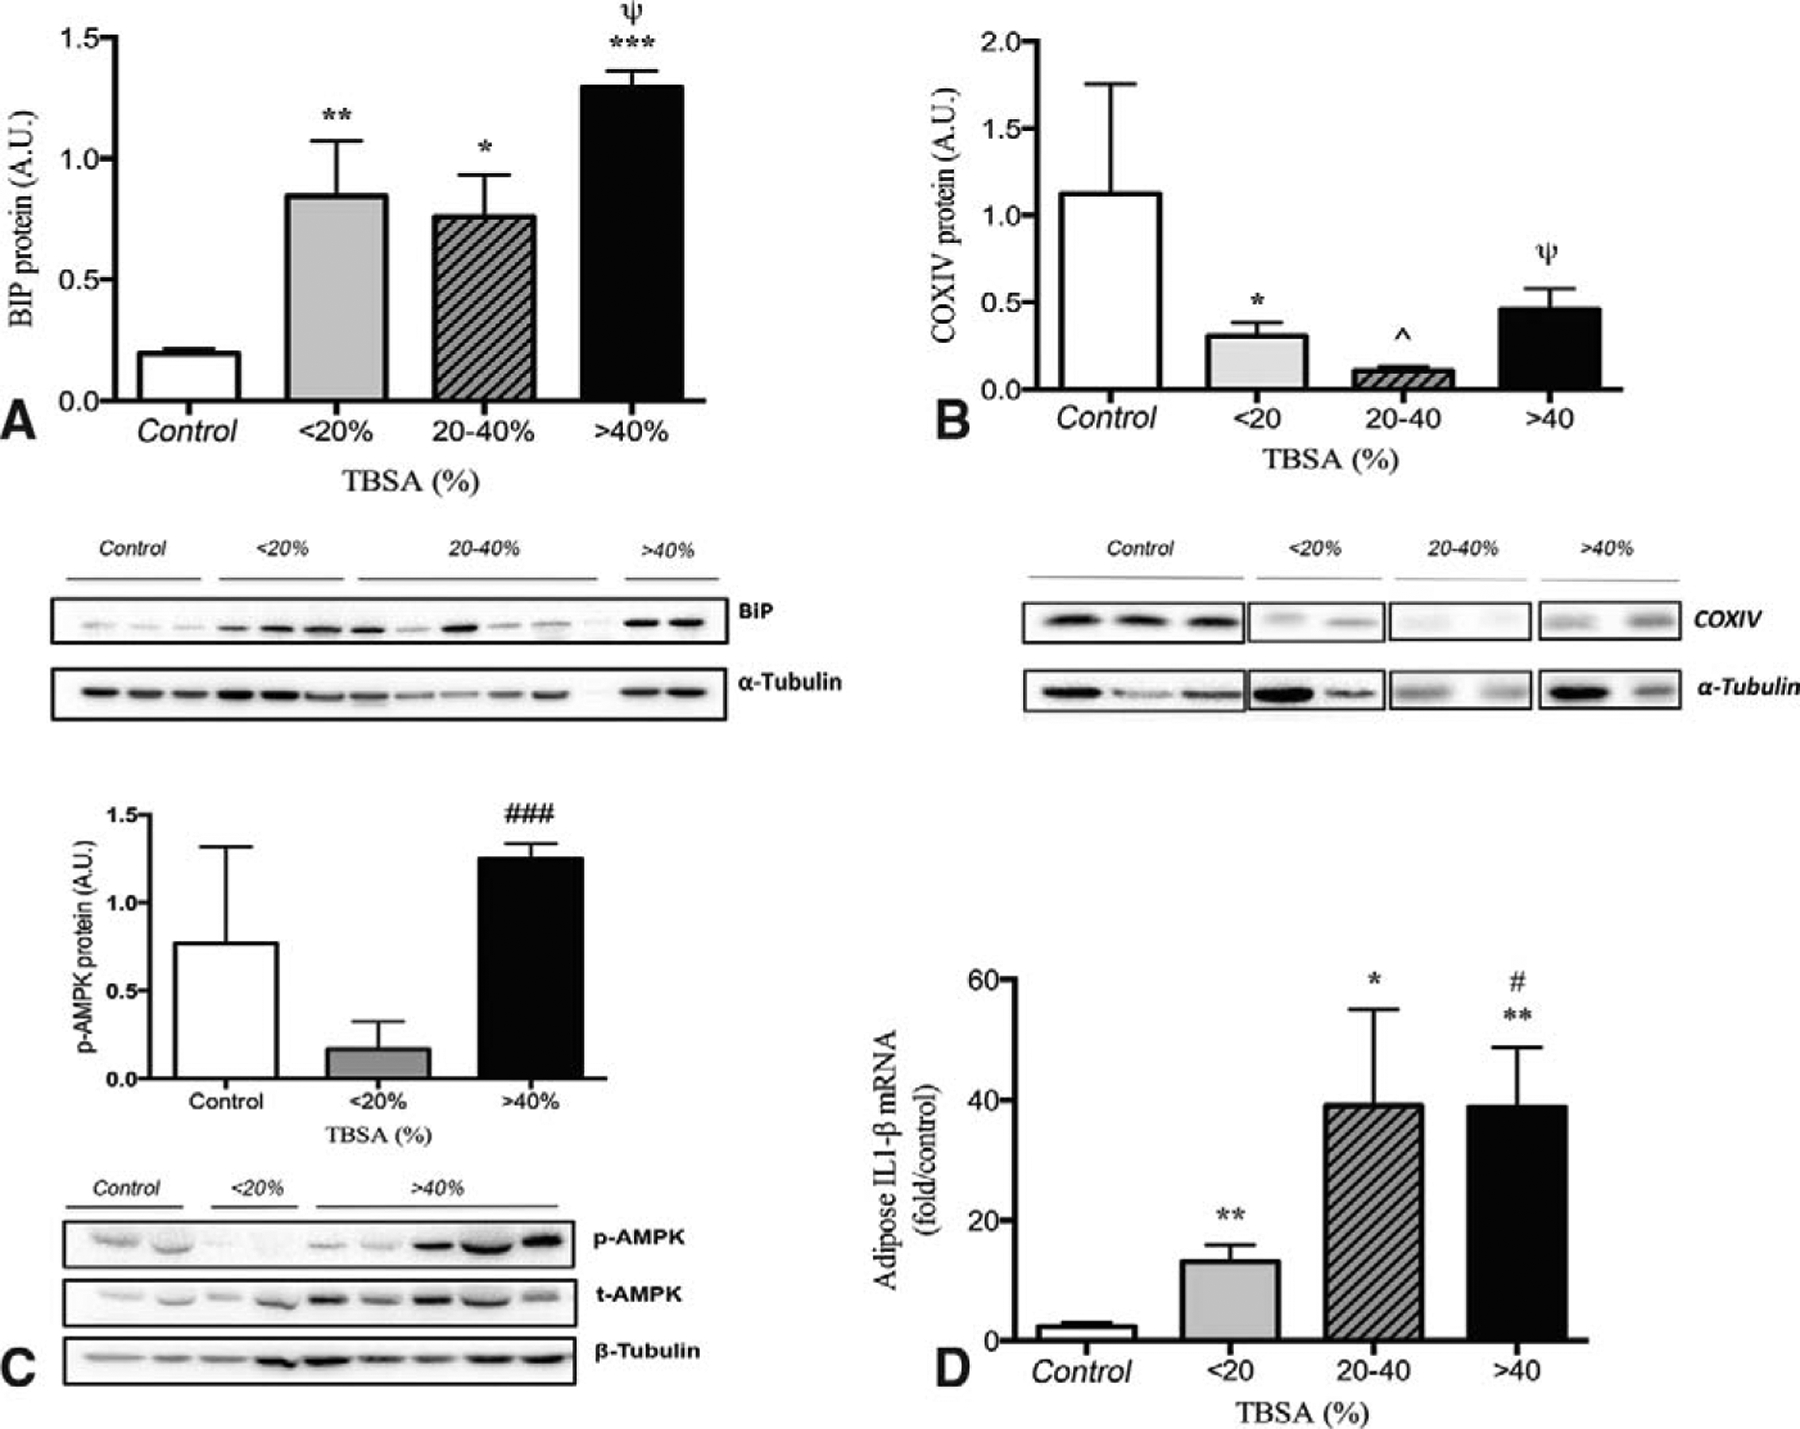
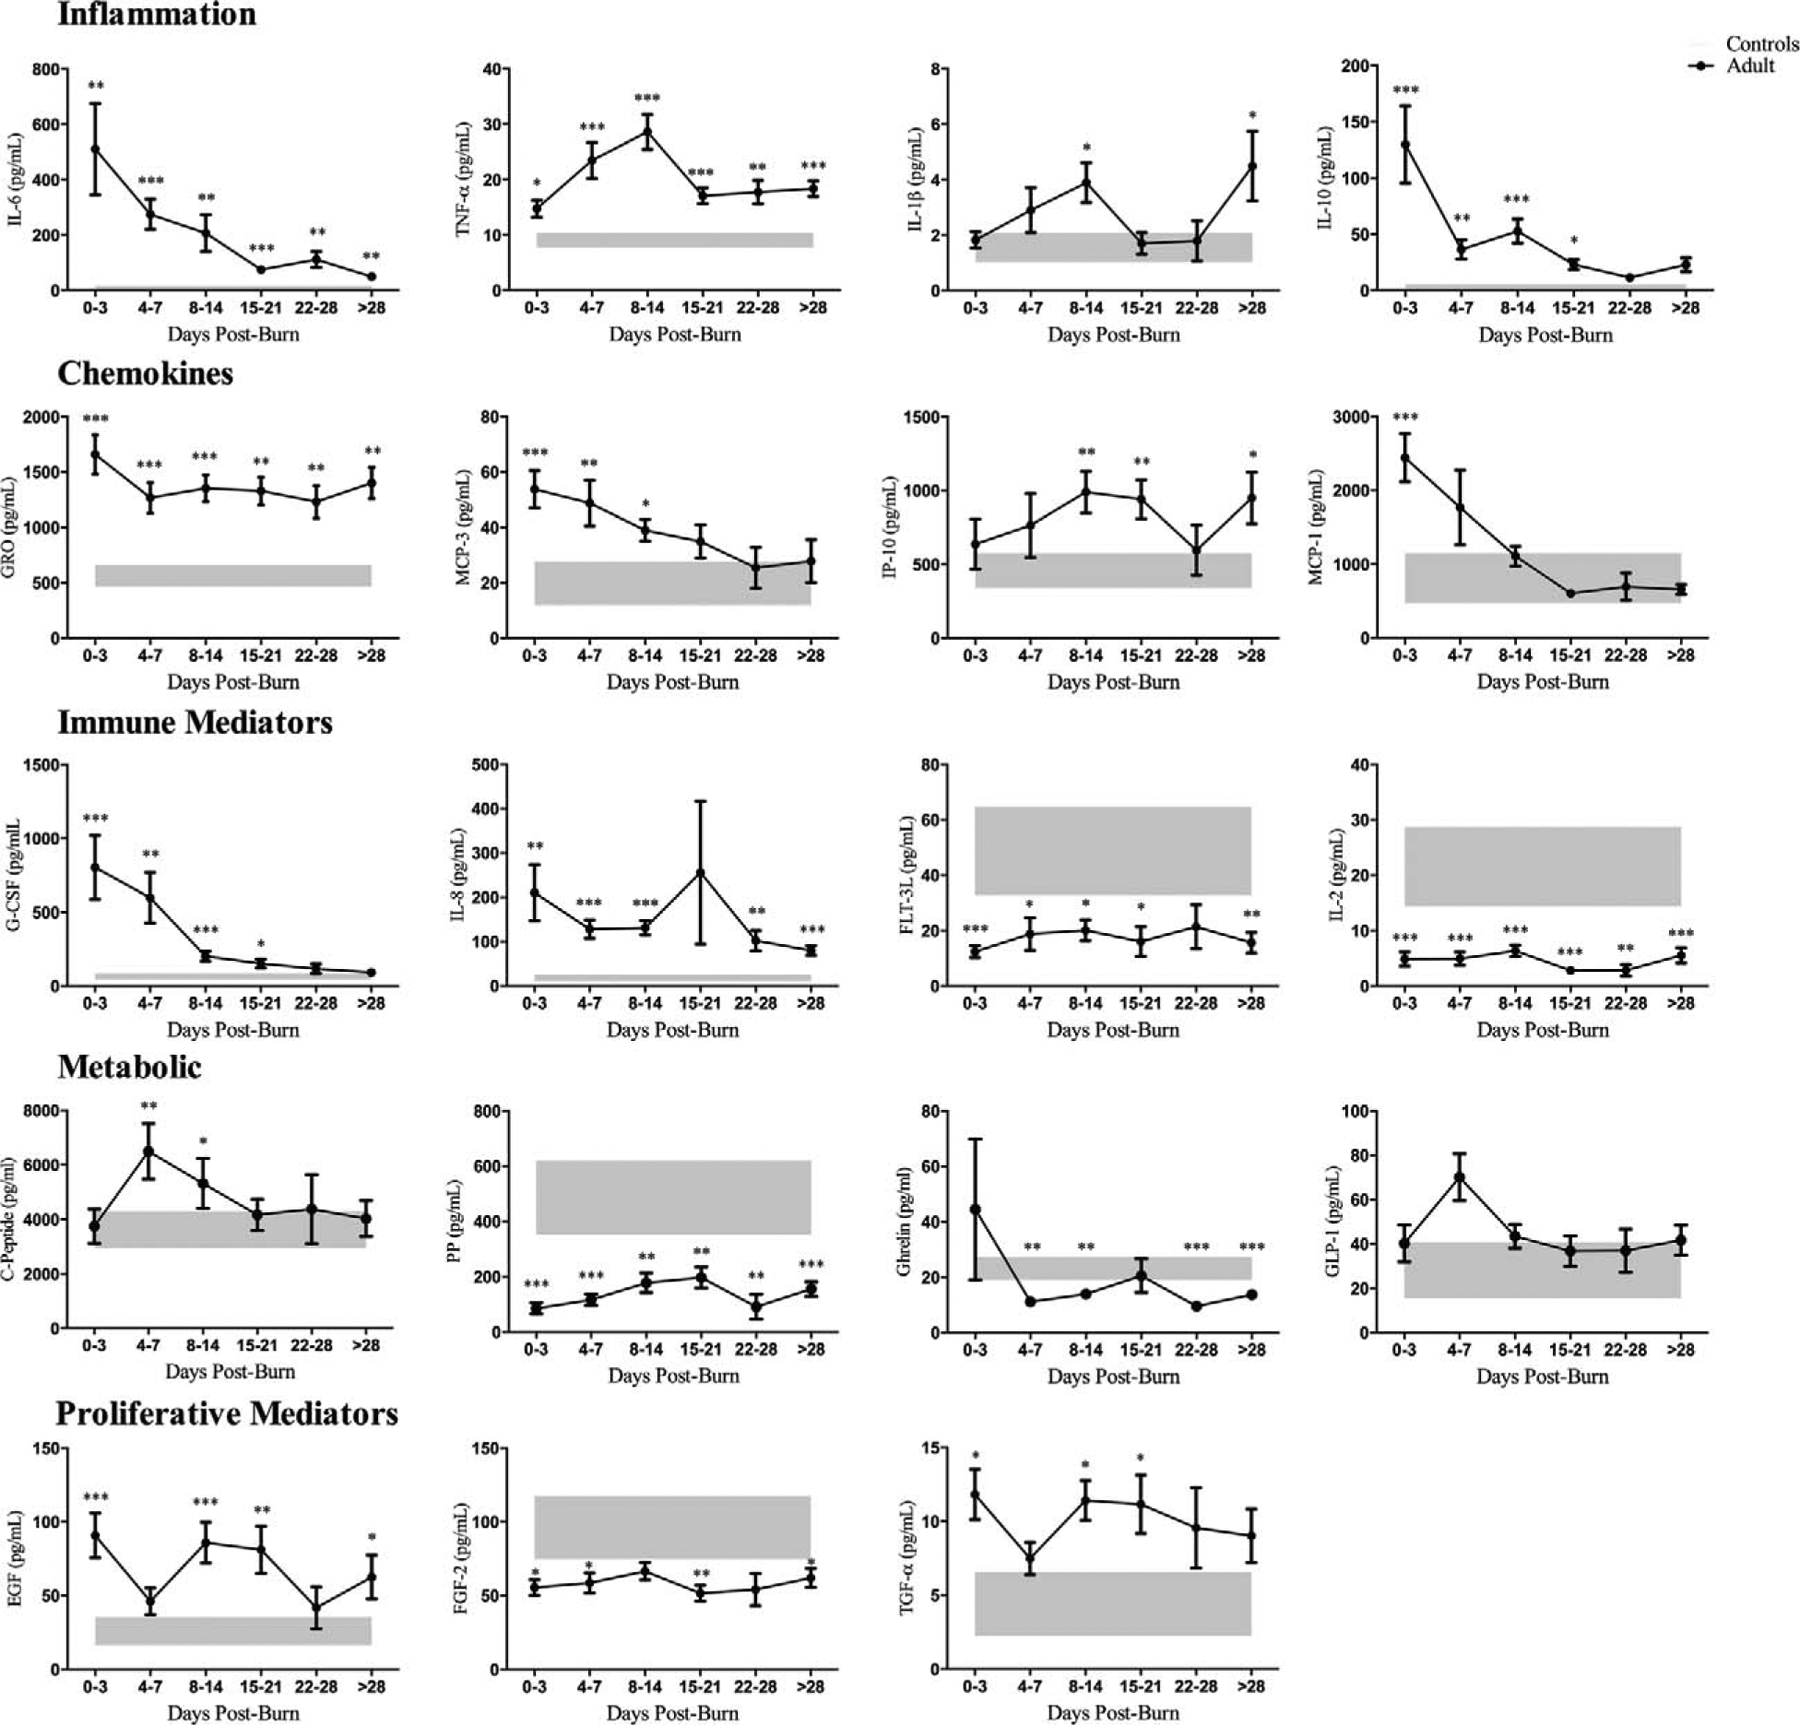
Results: Burn patients were hypermetabolic with elevated resting energy expenditure (REE) associated with increased browning of white adipose tissue from weeks 2 to 4. Hyperglycemia and hyperinsulinemia peaked 7 to 14 days after injury. Oral glucose tolerance and insulin resistance (QUICKI, HOMA2) tests further confirmed these findings with similar areas under the curve for moderate (20% to 40% TBSA) and severe burn (>40% TBSA). Lipid metabolism in sera revealed elevated pro-inflammatory stearic and linoleic acid, with complementary increases in anti-inflammatory free fatty acids. Similar increases were observed for inflammatory cytokines, chemokines, and metabolic hormones. White adipose tissue from the site of injury had increased ER stress, mitochondrial damage, and inflammasome activity, which was exacerbated with increasing burn severity.

Conclusions: In this large prospective trial, we delineated the complexity of the pathophysiologic responses postburn in adults and concluded that these profound responses are time and burn size dependent. Patients with medium-size (20% to 40% TBSA) burn demonstrated a very robust response that is similar to large burns.


Conflict of interest statement

The authors declare no conflicts of interest.

Figures

FIGURE 1.
FIGURE 1.
Patients’ glucose levels in burn adults (n = 600). Mean daily average glucose (A), 6AM glucose (B), minimum glucose (C), maximum glucose (D), and insulin units administered (E) during the course of hospital stay. Dashed lines indicate SD. Shaded area represents glucose control protocol target range of 90 to 144 mg/dL (5 to 8 mmol/L).
FIGURE 2.
FIGURE 2.
Hypermetabolic response and WAT browning. Burn adults (n = 92) had increased resting energy expenditure expressed as a percentage throughout the course of hospital stay (A). When stratified by burn severity (B), all burn groups (<20%, 20–40%, and >40% TBSA) demonstrated hypermetabolic response with the severe burn persisting beyond 4 weeks postinjury. Data represented as mean ± SEM, *significant difference between 20–40% TBSA and >40% TBSA burned adults, P < 0.05. Morphological and immunohistochemical evidence of browning in white adipose tissue postburn. H&E and UCP-1 staining of representative cross sectional area of paraffin sections of sWAT obtained from burned patients and healthy controls (C). Quantitative RT-PCR gene expression comparing controls to burn patients (>10 days postburn) revealed several fold increased expression in browning marker UCP-1 at the site of injury (D). This increased expression of UCP-1 was further demonstrated when stratified based on injury severity (<40 TBSA vs ≥40% TBSA). Data represented as mean ± SEM. ** = significant difference between controls (n = 5) and burned adults (n = 10); ## = significant difference between < 40% TBSA and ≥40% TBSA burned adults, P < 0.01.
FIGURE 3.
FIGURE 3.
Lipid FFA alterations in burn patients over time. Pro-inflammatory FFA species (stearic and linoleic acids) were all significantly increased within the first 14 days after injury relative to controls (A, B). Anti-inflammatory oleic and vaccenic acid and eicosapentaenoic acid also showed augmented profiles throughout sampling period (C, D). When stratified based on burn size (<40% TBSA vs ≥40% TBSA), both groups had similar profiles with steric acid revealing the most divergent trajectory in the severe groups (E to H). Data expressed as mean ± SEM.*, ** & *** = significant difference between burn (n = 46) and healthy controls (n=5); #, ## & ### = significant difference between < 40% TBSA and ≥40% TBSA burn groups; P < 0.05, P < 0.01, and P < 0.001, respectively.
FIGURE 4.
FIGURE 4.
Metabolic markers of augmented response in WAT. ER stress marker BiP was upregulated in all burn groups relative to controls with highest proportion in >40 TBSA (A). Mitochondrial dysfunction was present and manifested by decreased expression of COXIV (B) and increased AMPK (C). As a measure of NLRP3 inflammasome activity, adipose tissue IL-1β was increased in all burn groups and increased with increasing burn severity (D). All tissues were taken within 7 days postburn. Data are represented as mean ± SEM.*, ** & *** = significant difference between controls (n = 5) and burned adults (n = 34); ^, ^^ & ^^^ = significant difference between < 20% TBSA and 20% to 40% TBSA; #, ## & ### = significant difference between <20% TBSA and > 40%TBSA; Ψ, Ψ Ψ & Ψ Ψ Ψ = significant difference between 20–40% TBSA and > 40% TBSA; P < 0.05, P < 0.01, and P < 0.001, respectively.
FIGURE 5.
FIGURE 5.
Plasma cytokine profiling of burn (n = 128) and healthy controls (n = 10) during the course of hospital stay (0 to 3, 4 to 7, 8 to 14, 15 to 21, 22 to 28, >28 days postburn). A significantly augmented inflammatory, chemokine, and metabolic response was present in burn patients and persisted throughout hospital course, with greatest alterations during the acute phase (within 14 days postburn). Data are represented as mean ± SEM.*, ** &*** = significant difference between controls (grey boxes) vs. burned adults; P < 0.05, P < 0.01 and P < 0.001, respectively.

References

    1. Jeschke MG, Gauglitz GG, Kulp GA, et al. Long-term persistence of the pathophysiologic response to severe burn injury. PLoS One. 2011;6:e21245. - PMC - PubMed
    1. Williams FN, Herndon DN, Jeschke MG. The hypermetabolic response to burn injury and interventions to modify this response. Clin Plast Surg. 2009;36:583–596. - PMC - PubMed
    1. Jeschke MG, Patsouris D, Stanojcic M, et al. Pathophysiologic response to burns in the elderly. EBioMedicine. 2015;2:1536–1548. - PMC - PubMed
    1. Kraft R, Herndon DN, Al-Mousawi AM, et al. Burn size and survival probability in paediatric patients in modern burn care: a prospective observational cohort study. Lancet. 2012;379:1013–1021. - PMC - PubMed
    1. Stanojcic M, Chen P, Xiu F, et al. Impaired immune response in elderly burn patients: new insights into the immune-senescence phenotype. Ann Surg. 2016;264:195–202. - PMC - PubMed

Publication types