

Contribution of bacterial pathogens to evoking serological disease markers and aggravating disease activity in rheumatoid arthritis
- PMID: 29408886
- PMCID: PMC5800560
- DOI: 10.1371/journal.pone.0190588
Contribution of bacterial pathogens to evoking serological disease markers and aggravating disease activity in rheumatoid arthritis
Abstract
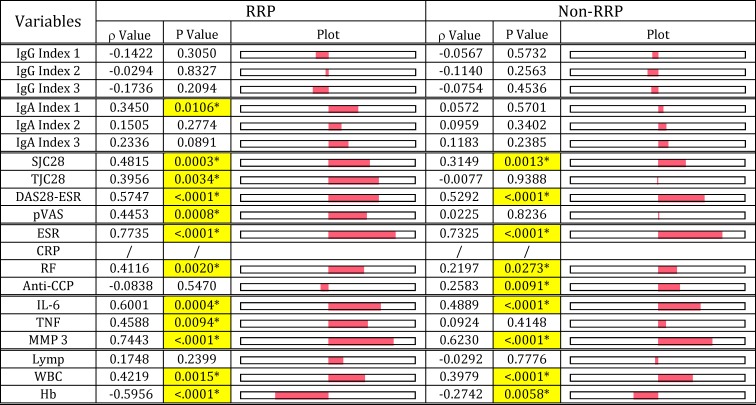
Commensal bacteria and their pathogenic components in the gastrointestinal tract and oral cavity may play pathological roles in autoimmune diseases. To study the possible involvement of bacterial pathogens in autoimmune diseases, IgG and IgA antibodies against pathogenic components produced by three strains of commensal bacteria, Escherichia coli-lipopolysaccharide (E. coli-LPS), Porphyromonas gingivalis-LPS (Pg-LPS) and peptidoglycan polysaccharide (PG-PS) from Streptococcus pyogenes, were determined by an improved ELISA system for sera from two groups of patients with rheumatoid arthritis (RA), who met rapid radiographic progression (RRP) criteria and non-RRP, and compared to normal (NL) controls. Antibody responses to these bacterial pathogens are unique and consistent in individuals, and no fundamental difference was observed between RA and NL controls. Despite the similar antibody responses to pathogens, lower IgG or higher IgA and consequent higher IgA/IgG antibody ratio among the patients with RA related to disease marker levels and disease activity. Peculiarly, the IgA/IgG anti-Pg-LPS antibody ratio resulted from lower IgG and higher IgA antibody responses to Pg-LPS strongly correlated not only with rheumatoid factor (RF), but also correlated with erythrocyte sedimentation rate (ESR), C-reactive protein (CRP) and disease activity score of 28 joints with ESR (DAS28-ESR) in the RRP group. In contrast, the IgA/IgG anti-E. coli-LPS and anti-PG-PS antibody ratio correlated or tended to correlate with RF, ESR, CRP, and DAS28-ESR in the non-RRP group, whereas either the IgG or IgA anti-Pg-LPS antibody levels and consequent IgA/IgG anti-Pg-LPS antibody ratio did not correlate with any clinical marker levels in this group. Notably, anti-circular-citrullinated peptide (CCP) antibody levels, which did not correlate with either IgG or IgA antibody levels to any pathogens, did not correlate with severity of arthritis in both RRP and non-RRP. Taken together, we propose that multiple environmental pathogens, which overwhelm the host antibody defense function, contribute independently or concomitantly to evoking disease makers and aggravating disease activity, and affect disease outcomes.
Trial registration: UMIN CTR UMIN000012200.
Conflict of interest statement
Figures


Similar articles
-
Oral and Intestinal Bacterial Substances Associated with Disease Activities in Patients with Rheumatoid Arthritis: A Cross-Sectional Clinical Study.J Immunol Res. 2022 Feb 18;2022:6839356. doi: 10.1155/2022/6839356. eCollection 2022. J Immunol Res. 2022. PMID: 35224112 Free PMC article. Clinical Trial.
-
Clinical correlations with Porphyromonas gingivalis antibody responses in patients with early rheumatoid arthritis.Arthritis Res Ther. 2013;15(5):R109. doi: 10.1186/ar4289. Arthritis Res Ther. 2013. PMID: 24017968 Free PMC article.
-
[Significance of IgA isotype of anti-v-raf murine sarcoma viral oncogene homologue B1 antibody in rheumatoid arthritis].Beijing Da Xue Xue Bao Yi Xue Ban. 2023 Aug 18;55(4):631-635. doi: 10.19723/j.issn.1671-167X.2023.04.010. Beijing Da Xue Xue Bao Yi Xue Ban. 2023. PMID: 37534643 Free PMC article. Chinese.
-
Unique correlation between mutated citrullinated vimentine IgG autoantibodies and markers of systemic inflammation in rheumatoid arthritis patients.Indian J Clin Biochem. 2013 Jul;28(3):272-6. doi: 10.1007/s12291-012-0272-1. Epub 2012 Oct 17. Indian J Clin Biochem. 2013. PMID: 24426223 Free PMC article.
-
Anti-cyclic citrullinated peptide antibody and rheumatoid factor isotypes in Iranian patients with rheumatoid arthritis: evaluation of clinical value and association with disease activity.Iran J Allergy Asthma Immunol. 2014 Jun;13(3):147-56. Iran J Allergy Asthma Immunol. 2014. PMID: 24659118
Cited by
-
Antibodies Isolated from Rheumatoid Arthritis Patients against Lysine-Containing Proteus mirabilis O3 (S1959) Lipopolysaccharide May React with Collagen Type I.Int J Mol Sci. 2020 Dec 17;21(24):9635. doi: 10.3390/ijms21249635. Int J Mol Sci. 2020. PMID: 33348817 Free PMC article.
-
Periodontitis and periodontopathic bacteria as risk factors for rheumatoid arthritis: A review of the last 10 years.Jpn Dent Sci Rev. 2023 Dec;59:263-272. doi: 10.1016/j.jdsr.2023.08.002. Epub 2023 Aug 26. Jpn Dent Sci Rev. 2023. PMID: 37674898 Free PMC article. Review.
-
Oral and Intestinal Bacterial Substances Associated with Disease Activities in Patients with Rheumatoid Arthritis: A Cross-Sectional Clinical Study.J Immunol Res. 2022 Feb 18;2022:6839356. doi: 10.1155/2022/6839356. eCollection 2022. J Immunol Res. 2022. PMID: 35224112 Free PMC article. Clinical Trial.
-
New Studies of Pathogenesis of Rheumatoid Arthritis with Collagen-Induced and Collagen Antibody-Induced Arthritis Models: New Insight Involving Bacteria Flora.Autoimmune Dis. 2021 Mar 25;2021:7385106. doi: 10.1155/2021/7385106. eCollection 2021. Autoimmune Dis. 2021. PMID: 33833871 Free PMC article. Review.
-
Multi-omics profiling reveals potential alterations in rheumatoid arthritis with different disease activity levels.Arthritis Res Ther. 2023 May 3;25(1):74. doi: 10.1186/s13075-023-03049-z. Arthritis Res Ther. 2023. PMID: 37138305 Free PMC article.
References
-
- Guilherme L, Kalil J, Cunningham M. Molecular mimicry in the autoimmune pathogenesis of rheumatic heart disease. Autoimmunity. 2006;39(1): 31–9. doi: 10.1080/08916930500484674 - DOI - PubMed
-
- Rashid T, Leirisalo-Repo M, Tani Y, Hukuda S, Kobayashi S, Wilson C, et al. Antibacterial and antipeptide antibodies in Japanese and Finnish patients with rheumatoid arthritis. Clin Rheumatol. 2004;23(2):134–41. doi: 10.1007/s10067-003-0847-6 - DOI - PubMed
Publication types
MeSH terms
Substances
LinkOut - more resources
Full Text Sources
Other Literature Sources
Medical
Research Materials
Miscellaneous
