. 2018 Feb 6;13(2):e0191690.
doi: 10.1371/journal.pone.0191690. eCollection 2018.

Splenic macrophages are required for protective innate immunity against West Nile virus

Affiliations

Splenic macrophages are required for protective innate immunity against West Nile virus

Marianne A Bryan et al. PLoS One. .

Abstract

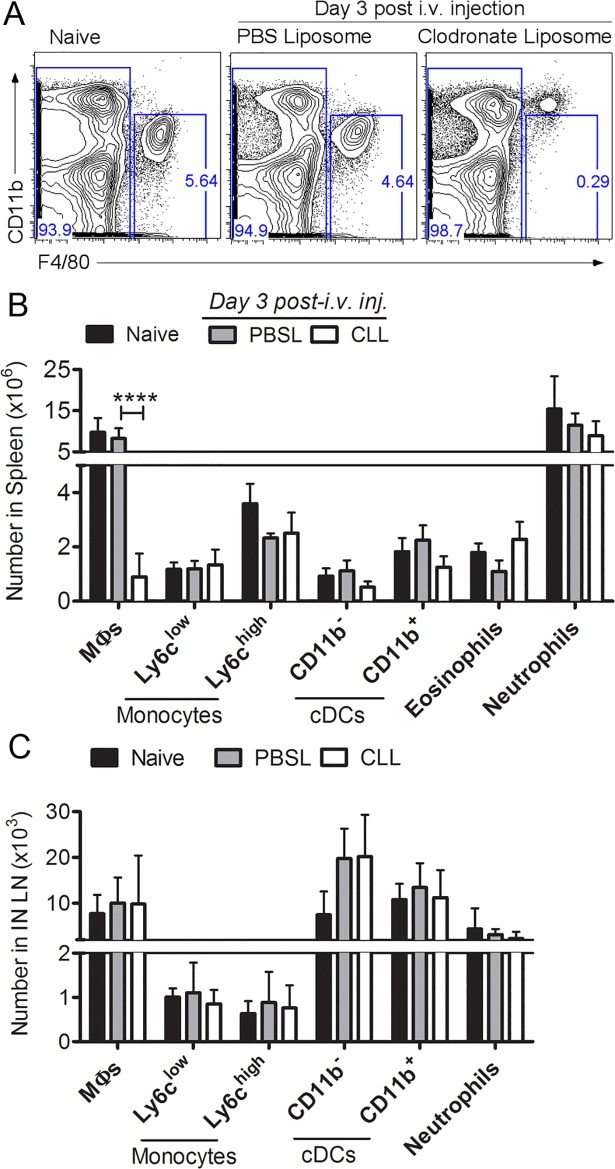
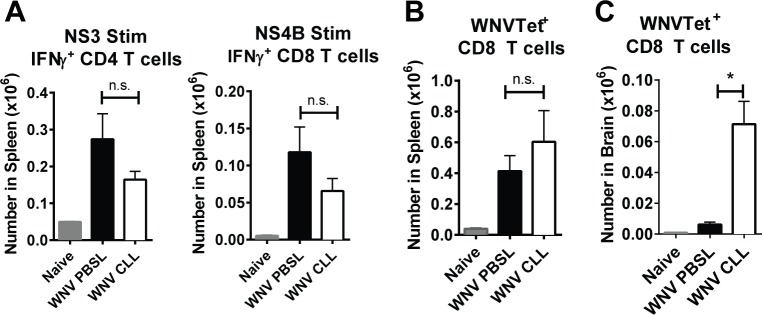
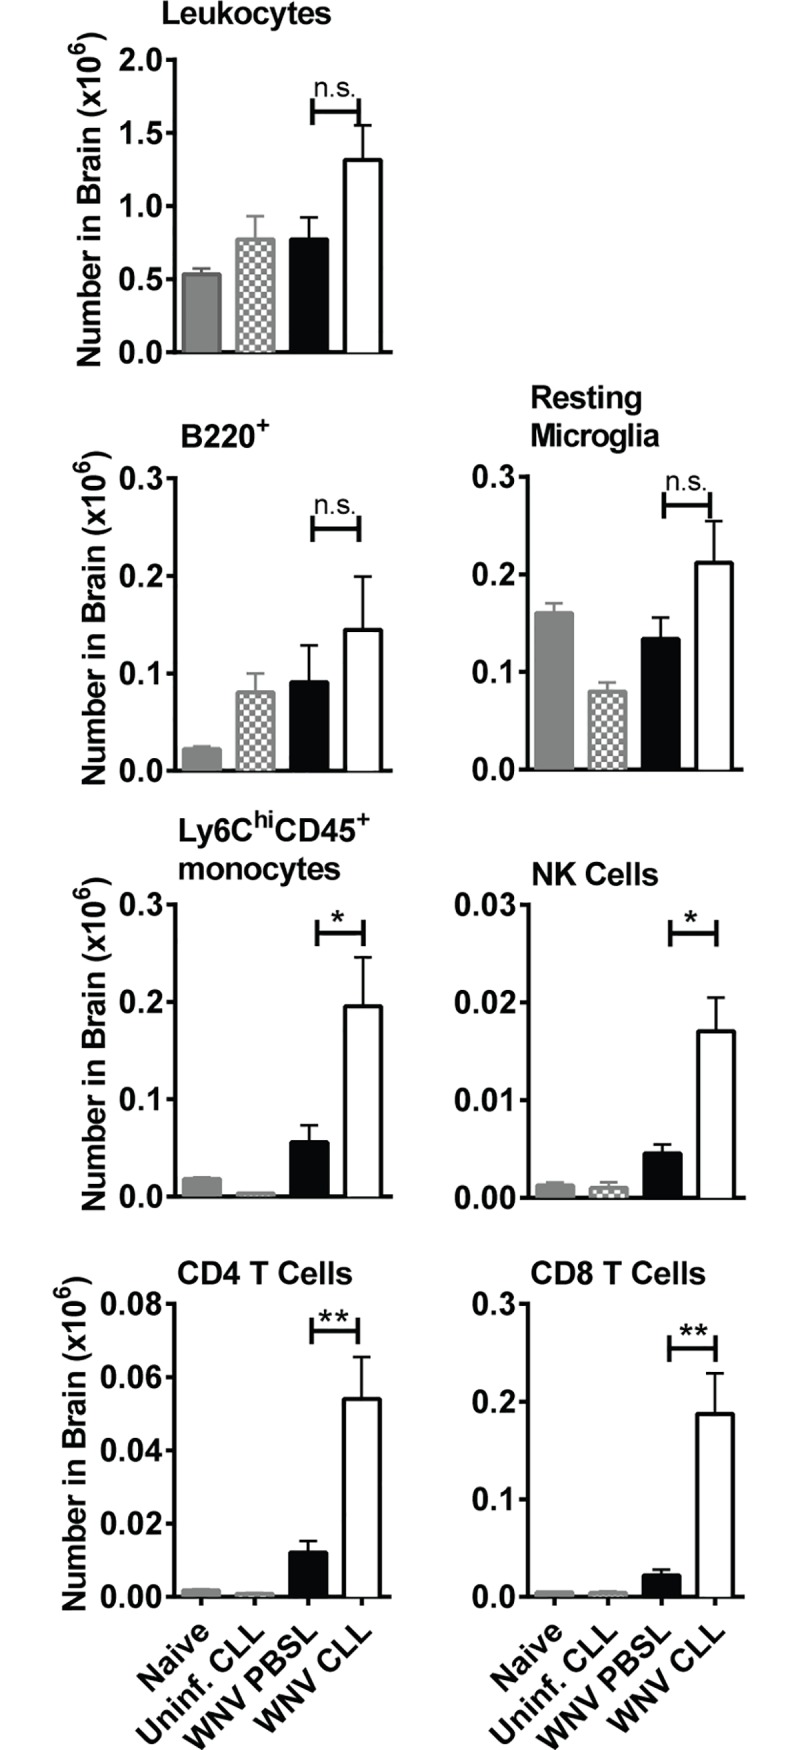
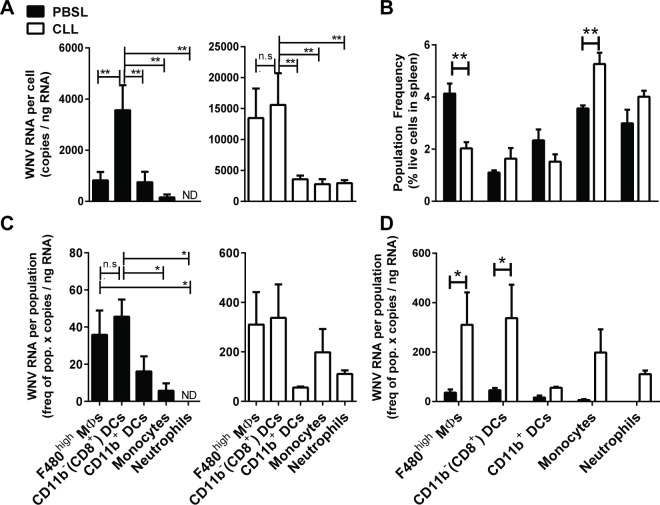
Although the spleen is a major site for West Nile virus (WNV) replication and spread, relatively little is known about which innate cells in the spleen replicate WNV, control viral dissemination, and/or prime innate and adaptive immune responses. Here we tested if splenic macrophages (MΦs) were necessary for control of WNV infection. We selectively depleted splenic MΦs, but not draining lymph node MΦs, by injecting mice intravenously with clodronate liposomes several days prior to infecting them with WNV. Mice missing splenic MΦs succumbed to WNV infection after an increased and accelerated spread of virus to the spleen and the brain. WNV-specific Ab and CTL responses were normal in splenic MΦ-depleted mice; however, numbers of NK cells and CD4 and CD8 T cells were significantly increased in the brains of infected mice. Splenic MΦ deficiency led to increased WNV in other splenic innate immune cells including CD11b- DCs, newly formed MΦs and monocytes. Unlike other splenic myeloid subsets, splenic MΦs express high levels of mRNAs encoding the complement protein C1q, the apoptotic cell clearance protein Mertk, the IL-18 cytokine and the FcγR1 receptor. Splenic MΦ-deficient mice may be highly susceptible to WNV infection in part to a deficiency in C1q, Mertk, IL-18 or Caspase 12 expression.


Conflict of interest statement

Competing Interests: The authors have declared that no competing interests exist.

Figures

Fig 1
Fig 1. Selective depletion of splenic macrophages by i.v. delivery of clodronate liposomes (CLL).
Mice were left untreated (naïve) or injected i.v. with CLL or saline filled liposomes (PBSL) as a negative control; 3 days later spleens were harvested and cells analyzed by multi-color flow cytometry. (A) Representative plots showing CD11b vs. F4/80 staining of splenocytes from naïve and liposome treated mice. (B, C) Numbers for splenic and lymph node populations were calculated based as cell frequency X total spleen cell numbers. Data shown represent one of four separate experiments with similar results. Statistics were performed using 2-way ANOVA and Tukey’s multiple comparison test. P values: * p < 0.05, ** p <0.01, *** p<0.001, **** < 0.0001.
Fig 2
Fig 2. Splenic MΦs are necessary for control of WNV infection.
(A) Experimental design; mice were treated with CLL or PBSL 3 days prior to subcutaneous (s.c.) footpad inoculation with WNV (1000 PFU) or vehicle control (CLL Mock). Mice depleted of splenic MΦs (triangles), unlike infected PBSL controls (squares) or CLL Mock mice (circles) all succumbed to WNV infection (MST = 11 days) (B); CLL treated mice had significantly decreased body weight at days 7–10 p.i (C) and had significantly increased disease scores at day 8–10 p.i. (D). (E) WNV RNA in sera (qPCR) of CLL-treated (white) vs. PBSL-treated control (black) mice at day 1 and day 2 post-WNV infection. (F) WNV RNA in popliteal (PO) and inguinal (IN) dLNs and in spleen of CLL treated (open) vs. PBSL control (black) mice at day 2 post-WNV infection. Viral levels determined by plaque assay in spleens (G) and brains (H) of CLL-treated (open) and PBSL-treated (black) mice days 2–8 pi. Statistics used were B: Log-Rank Test; C,D: Student’s t tests; and E-H: 1-way Anova plus Tukey’s post-test. P values: * p < 0.05, ** p <0.01, *** p<0.001, ND = not detected.
Fig 3
Fig 3. WNV-specific Ab responses in splenic MΦ-depleted mice.
Mice were treated as in Fig 2A with CLL (open) or PBSL (black), and sera were collected at days 5 and 8 p.i. (A) Anti-WNV Env IgM and IgG titers were determined by OD values that were 3 standard deviations above the mock controls. PNRT50 represents the reciprocal dilution at which 50% of plaques were neutralized, The combination of two independent experiments is shown. (B) Serum samples were obtained from naïve, WNV immune (>15 days post-WNV), and at day 8 post-WNV from PBSL or CLL treated mice. Heat inactivated pooled sera were then injected into μMT B cell-deficient mice 1 day prior to and 1 day after inoculation of mice with 100 PFU WNV. A pool of sera from naïve mice was used a negative control and provided no protection. Two-tailed Student's t test, * p < 0.05, ** p <0.01, *** p<0.001.
Fig 4
Fig 4. Generation of WNV-specific CD4 and CD8 T cells in WNV-infected splenic MΦ-depleted mice.
Mice were treated as in Fig 2A with CLL (open) or PBSL (black) and spleens and brains were harvested at day 8 p.i. (A) Splenocytes were stimulated with an NS3 peptide or an NS4b peptide and then analyzed for IFNγ expression within CD4 and CD8 T cells, respectively. (B) Splenocytes were stained with NS4b tetramers to enumerate WNV-specific (WNVTet+) CD8 T cells (C) Leukocytes from brains were stained with NS4b tetramers to enumerate WNVTet+ CD8 T cells. Statistics are shown for 1-way Anova plus Tukey’s post-test. P values: * p < 0.05, ** p <0.01, *** p<0.001.
Fig 5
Fig 5. Cellular infiltration into the brains of WNV-infected splenic MΦ-depleted mice.
Brains were isolated from mice treated as in Fig 2A with either CLL (open) or PBSL (black), or from uninfected naïve mice (grey) or CLL treated mice (grey checked bar). Brains were harvested at day 8 post-WNV infection. Cell suspensions were stained with mAbs to surface markers and subsets quantified using flow cytometry as: CD45+ leukocytes, B220+ B cells, CD45lo CD11b+ Ly6C- Ly6G- resting microglial cells (52), CD45+ Ly6Chi CD11b+ Ly6G- monocytes, CD45+ NK1.1+ NK cells, CD45+ CD3+ CD4+ CD4 T cells, and CD45+ CD3+ CD8+ CD8 T cells. The results shown are the combined result of two independent experiments with similar results. Statistics shown are for two-tailed Student's t test, * p < 0.05, ** p <0.01, *** p<0.001.
Fig 6
Fig 6. Quantification of WNV viral RNA in myeloid cells from WNV infected mice.
Mice were treated with CLL (open bars) or PBSL (black bars) 3 days prior to footpad inoculation with WNV (1000 PFU); spleens were harvested at day 3–4 p.i., and splenocytes were enriched using magnetic beads for CD11b-, CD11c-, or F4/80hi cells (see Methods). Purified myeloid populations were obtained by cell sorting and RNA isolated for quantization via qPCR. (A) WNV quantities/cell indicate that in infected PBSL control mice CD11b- DCs had significantly higher WNV RNA levels than other myeloid subsets. 1-way ANOVA (B) Population frequency determined by FACS analysis on total spleen single cell preparations. 2-way ANOVA with Bonferroni post-test (C) WNV quantity per population indicates that splenic F4/80hi MΦs and CD11b- DCs had similar levels of WNV, while CD11b+ DCs and MOs had much less. 1-way ANOVA. (D) CD11b- DCs and repopulating F4/80hi MΦs had significantly higher WNV RNA levels per population in CLL treated mice vs. control mice. 2-way ANOVA with Bonferroni post test. Data represent the combined data from 3 independent experiments. * p < 0.05, ** p <0.01.
Fig 7
Fig 7. Expression of immune-associated genes in splenic myeloid subsets before and after WNV-infection.
F4/80hi MΦs, CD11b- DCs, CD11b+ DCs or CD11b+SSClo MOs splenic subsets were isolated by cell sorting from either naïve B6 mice or from PBSL-treated mice infected 4 days previously with 1000 pfu WNV/Tx. RNA was isolated, after which expression of 108 immune-associated genes were determined (see Materials and Methods and Table A in S1 File). Heat maps show the gene expression/population for the 4 subsets relative to the total gene expression in myeloid cells obtained from (A) naïve mice (mean of 2 independent experiments) or (B) WNV-infected mice (mean of 3 experiments). Ratios were loaded into R statistical programming language (version 3.2.0). Pearson correlation was performed on ratios and displayed in R/Bioconductor using the gplots package. Gene expression/population shown is calculated as expression of the given population X the frequency of the same population in the spleen. Details of expression levels are available in Tables B and C in S1 File.
Fig 8
Fig 8. Differential expression in splenic myeloid cell subsets of genes encoding RNA sensing and signaling proteins.
Control (PBSL) mice were infected with WNV and spleens were harvested 4 days post-WNV. Myeloid populations (F480high MΦs, CD11b- DCs, CD11b+ DCs, and MOs) were isolated by FACS, RNA extracted, and gene expression quantified by qPCR array cards. Gene expression per population shown is calculated as gene expression of the given population X the frequency of the same population in the spleen (expression per cell). (A) F480high MΦs express high levels of mRNAs encoding the cytosolic sensors Ddx58 (RIG-I) and Ifih1 (MDA5) as well a large proportion compared to other subsets of the mRNA encoding downstream adapter MAVS. (B) F480high MΦs, CD11b+ DCs and MOs have high levels of mRNA for Ddx58 (RIG-I) and Tlr7 compared to CD11b- DCs, which express more Tlr3. (C) Fold change was determined by dividing expression in myeloid populations from WNV-infected mice by that of the same populations from naïve controls. Splenic myeloid cells from WNV infected control mice increased mRNA expression of some RNA sensors, but not for the downstream adapters MAVS and Myd88. For all plots, statistics shown are from 1-way ANOVA *p < 0.05, ** p < 0.01. Data represent the combined data from three independent sort experiments.

Similar articles

Cited by

References

    1. Petersen L. R., Brault A. C., and Nasci R. S. 2013. West Nile virus: review of the literature. JAMA. 310:308–15. doi: 10.1001/jama.2013.8042 - DOI - PMC - PubMed
    1. Roehrig J. T. 2013. West nile virus in the United States—a historical perspective. Viruses. 5:3088–108. doi: 10.3390/v5123088 - DOI - PMC - PubMed
    1. Murray K. O., Ruktanonchai D., Hesalroad D., Fonken E., and Nolan M. S. 2013. West Nile virus, Texas, USA, 2012. Emerg. Infect. Dis. 19:1836–8. doi: 10.3201/eid1911.130768 - DOI - PMC - PubMed
    1. Beasley D. W., Barrett A. D., and Tesh R. B. 2013. Resurgence of West Nile neurologic disease in the United States in 2012: what happened? What needs to be done? Antiviral Res. 99:1–5. doi: 10.1016/j.antiviral.2013.04.015 - DOI - PubMed
    1. Diamond M.S. 2009. Progress on the development of therapeutics against West Nile virus. Antiviral Res. 83:214–27. doi: 10.1016/j.antiviral.2009.05.006 - DOI - PMC - PubMed

Publication types