

Transcriptional profiling of liver tissues in chicken embryo at day 16 and 20 using RNA sequencing reveals differential antioxidant enzyme activity
- PMID: 29408927
- PMCID: PMC5800670
- DOI: 10.1371/journal.pone.0192253
Transcriptional profiling of liver tissues in chicken embryo at day 16 and 20 using RNA sequencing reveals differential antioxidant enzyme activity
Abstract
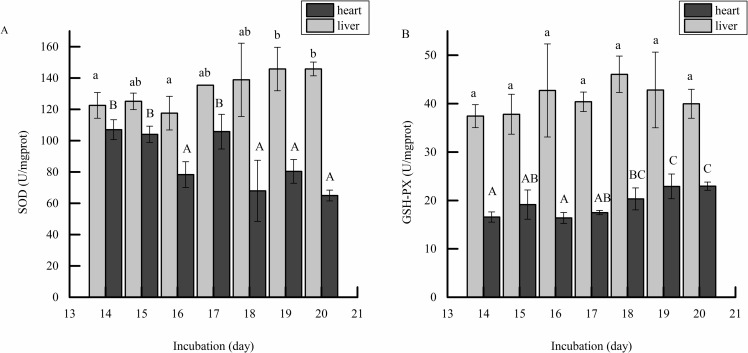
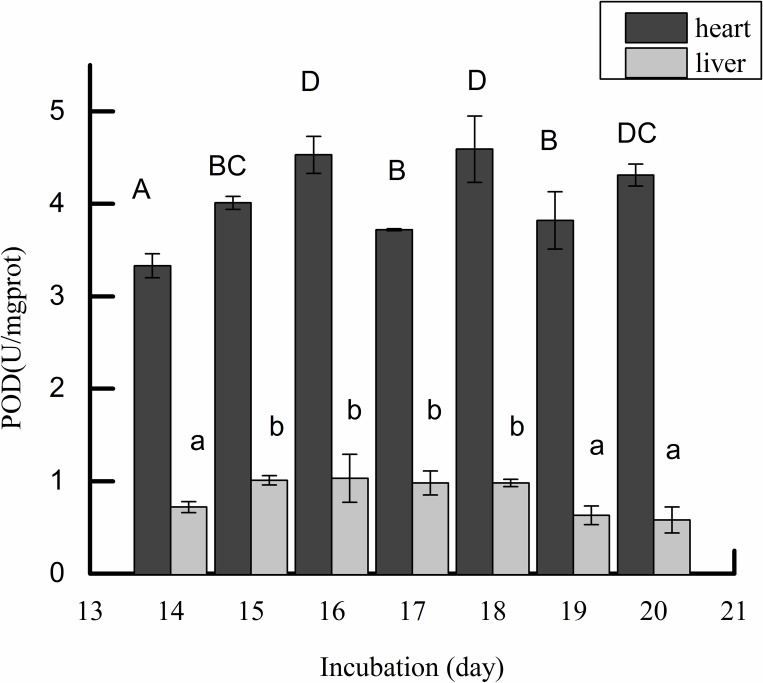
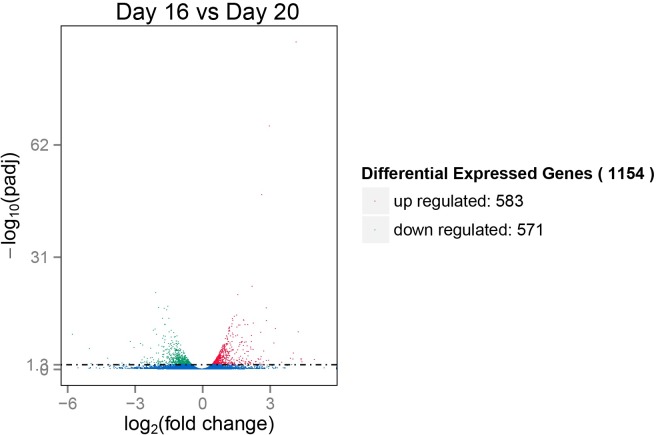
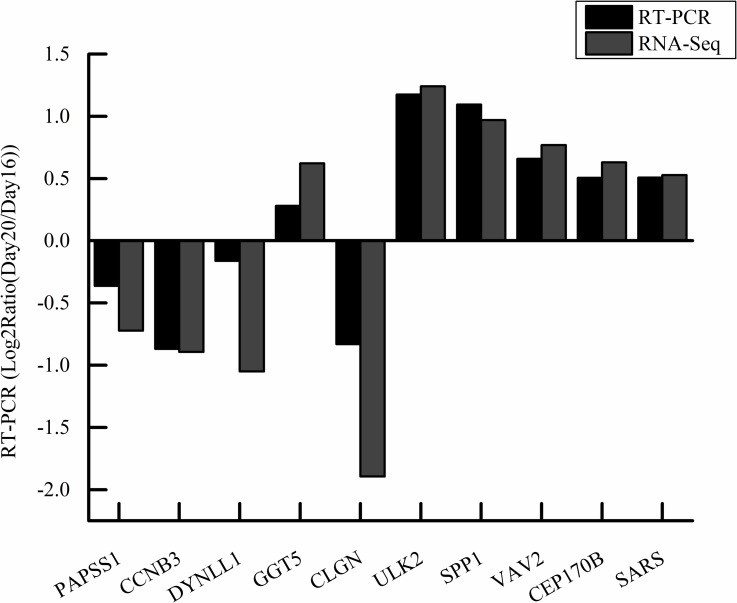
Considering the high proportion of polyunsaturated fatty acids, the antioxidant defense of chick embryo tissues is vital during the oxidative stress experienced at hatching. In order to better understand the mechanisms of the defense system during chicken embryo development, we detected the activity of antioxidant enzymes during the incubation of chicken embryo. Results showed that the activity of superoxide dismutase (SOD) and (GSH-PX) in livers were higher than those in hearts. Based on these results, liver tissues were used as the follow-up study materials, which were obtained from chicken embryo at day 16 and day 20. Thus, we used RNA sequencing (RNA-Seq) analysis to identify the transcriptome from 6 liver tissues. In total, we obtained 45,552,777-45,462,856 uniquely mapped reads and 18,837 mRNA transcripts, across the 6 liver samples. Among these, 1,154 differentially expressed genes (p<0.05, foldchange≥1) were identified between the high and low groups, and 1,069 GO terms were significantly enriched (p<0.05). Of these, 10 GO terms were related to active oxygen defense and antioxidant enzyme activity. GO enrichment and KEGG pathway analysis indicated that GSTA2, GSTA4, MGST1, GPX3, and HAO2 participated in glutathione metabolism, and were considered as the most promising candidate genes affecting the antioxidant enzyme activity of chicken embryo at day 16 and day 20. Using RNA-Seq and differential gene expression, our study here investigated the complexity of the liver transcriptome in chick embryos and analyzed the key genes associated with the antioxidant enzyme.
Conflict of interest statement
Figures
References
-
- Turrens JF. Mitochondrial formation of reactive oxygen species. J Physiol. 2003; 552: 335–344. doi: 10.1113/jphysiol.2003.049478 - DOI - PMC - PubMed
-
- He RR, Li Y, Li XD, Yi RN, Wang XY, Tsoi B, et al. A New Oxidative Stress Model, 2,2-Azobis(2-Amidinopropane) Dihydrochloride Induces Cardiovascular Damages in Chicken Embryo. PLOS one. 2013; 8: e57732 doi: 10.1371/journal.pone.0057732 - DOI - PMC - PubMed
-
- Covarrubias L, Herna´ndez-Garcı´a D, Schnabel D, Salas-Vidal E, Castro-Obrego´n S. Function of reactive oxygen species during animal development: Passive or active?. Dev Biol. 2008; 320: 1–11. doi: 10.1016/j.ydbio.2008.04.041 - DOI - PubMed
-
- Wells PG, McCallum GP, Chen CS, Henderson JT, Lee CJ, Perstin J, et al. Oxidative stress in developmental origins of disease: teratogenesis, neuro developmental deficits, and cancer. Toxicol Sci. 2009; 108: 4–18. doi: 10.1093/toxsci/kfn263 - DOI - PubMed
-
- Han ZJ, Song G, Cui Y, Xia HF, Ma X. Oxidative stress is implicated in arsenic-induced neural tube defects in chick embryos. Int. J. Devl Neuroscience. 2011; 29: 673–680. - PubMed
Publication types
MeSH terms
Substances
LinkOut - more resources
Full Text Sources
Other Literature Sources
Miscellaneous
