. 2018 Feb 6;14(2):e1005979.
doi: 10.1371/journal.pcbi.1005979. eCollection 2018 Feb.

Interpretation of correlated neural variability from models of feed-forward and recurrent circuits

Affiliations

Interpretation of correlated neural variability from models of feed-forward and recurrent circuits

Volker Pernice et al. PLoS Comput Biol. .

Abstract

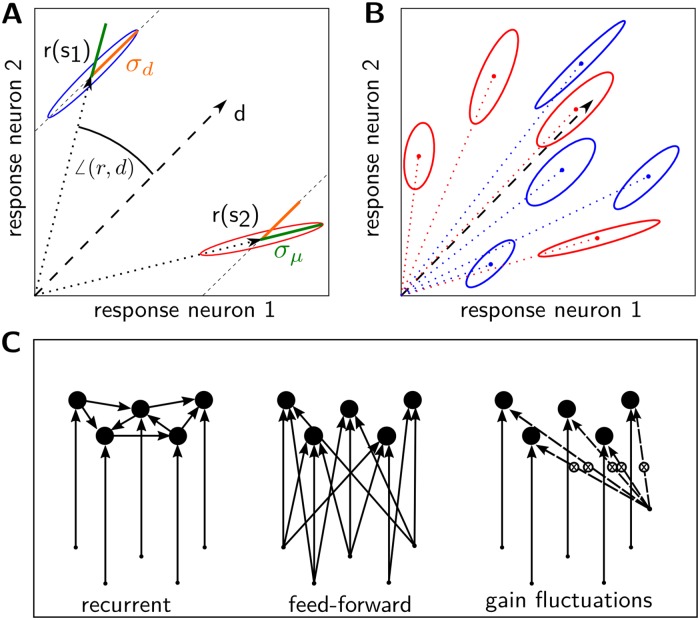
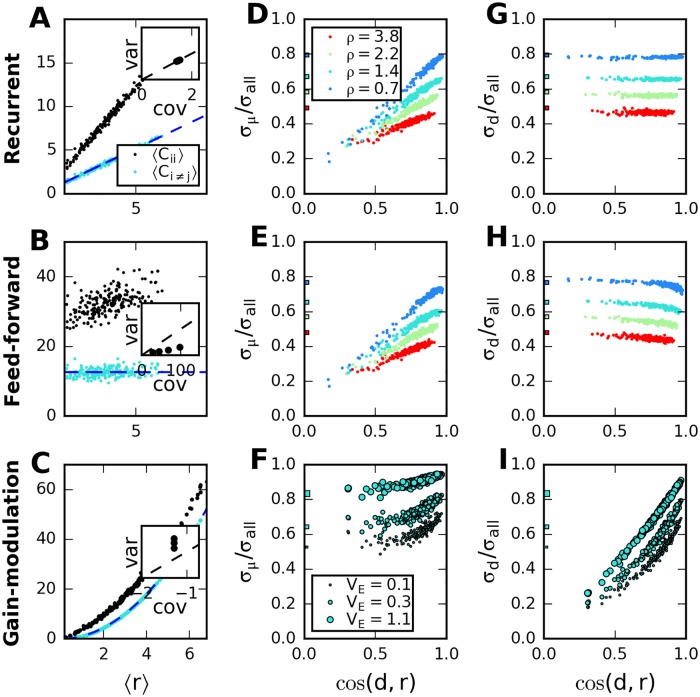
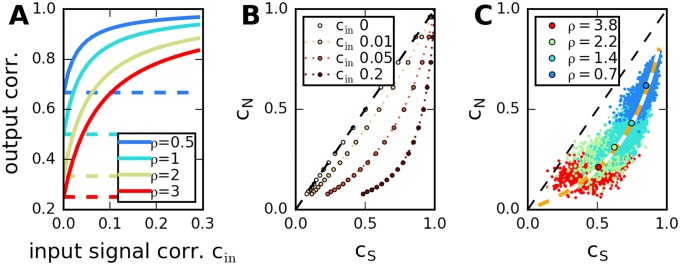
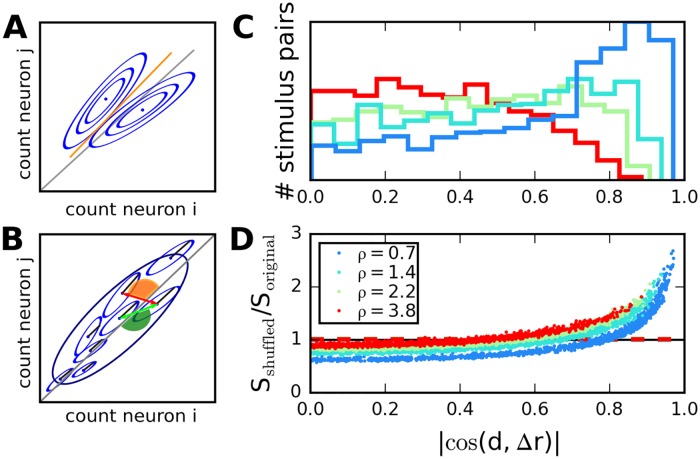
Neural populations respond to the repeated presentations of a sensory stimulus with correlated variability. These correlations have been studied in detail, with respect to their mechanistic origin, as well as their influence on stimulus discrimination and on the performance of population codes. A number of theoretical studies have endeavored to link network architecture to the nature of the correlations in neural activity. Here, we contribute to this effort: in models of circuits of stochastic neurons, we elucidate the implications of various network architectures-recurrent connections, shared feed-forward projections, and shared gain fluctuations-on the stimulus dependence in correlations. Specifically, we derive mathematical relations that specify the dependence of population-averaged covariances on firing rates, for different network architectures. In turn, these relations can be used to analyze data on population activity. We examine recordings from neural populations in mouse auditory cortex. We find that a recurrent network model with random effective connections captures the observed statistics. Furthermore, using our circuit model, we investigate the relation between network parameters, correlations, and how well different stimuli can be discriminated from one another based on the population activity. As such, our approach allows us to relate properties of the neural circuit to information processing.


Conflict of interest statement

The authors have declared that no competing interests exist.

Figures

Fig 1
Fig 1. Properties of response distributions and network scenarios.
A: Examples of distributions for which the variability is mostly along the diagonal direction (blue ellipse), resulting in a large value of σd, and for which the variability is mostly along the direction of the average response (red ellipse), resulting in a large value of σμ. B: Response distributions for two stimulus ensembles. Either σμ (red set) or σd (blue set) remains large across stimuli. A dependence as in the red set emerges in feed-forward models with common gain fluctuations, while a dependence as in the blue set may arise in densely connected recurrent networks or in feed-forward networks with shared inputs. C: Different network architectures which induce correlated activity. Connections (arrows) to and between neurons (dots) vary in strength. Dashed arrows indicate multiplicative modulations.
Fig 2
Fig 2. Response-covariance relations depend on the origin of correlations.
A-C: Average population response, 〈r〉, versus average (co-)variances in recurrent network (top), feed-forward network with shared inputs (middle) and feed forward network with common gain fluctuations (bottom). Each dot corresponds to a random stimulus, blue dashed lines represent analytic results, Eqs (24)–(27). Larger ρ indicates larger variability of effective weights in the network models; larger Vext indicates increased variance of gain fluctuations. Inset: Ratio slope/intercept of linear fits to the (co-)variances, for different networks; scatter plots of ratios for covariances vs variances show that they coincide only in the recurrent network model. D-F: Dependence of normalized variability projected on direction of average response for the three network architectures. In D, E, colors indicate results for different network parameters, in F, size of markers indicates strength of gain fluctuations. Square markers on the left indicate numerical value of cN. G-I: Same for the normalized variability projected on diagonal direction. See S1 Appendix for further details and the numerical parameters.
Fig 3
Fig 3. Relation between signal and noise correlations in the recurrent network model.
A: Dependence of average signal correlations, cS (continuous lines), and average noise correlations, cN (dashed lines), on input correlation and network properties, Eqs (28) and (29). Low variability of the transfer matrix elements, ρ, increases cN and cS. Input signal correlations affect only cS. B: Same data, average signal versus noise correlation. C: Scatter plot of all pairwise signal versus pairwise noise correlations (dots), in five network realizations, for cin = 0.05. Circles indicate network average across pairs, orange dotted line corresponds to analytical expressions displayed in B for cN and cS.
Fig 4
Fig 4. Covariances affect stimulus discriminability.
A: Sketch of response distributions for two neurons and two stimuli (blue ellipses). Neural responses are correlated for both stimuli, so that main axis of variability is nearly parallel to linear separator (orange line). B: Larger ensemble of stimuli for correlated neurons (large variance along diagonal directions). The effect of correlations is favorable for stimulus pairs for which difference in means is orthogonal to diagonal (red arrow), and unfavorable when difference in means is nearly parallel to diagonal (green arrow). C: Distribution of cosines of angle between diagonal and difference in means, across stimulus pairs in recurrent networks with different parameter ρ. In networks with low ρ, unfavorable angles are more frequent. D: Ratio between discriminability for correlated and shuffled distributions, dots correspond to stimulus pairs. Values smaller than one correspond to beneficial correlations. Dashed horizontal lines indicate averages across all stimulus pairs.
Fig 5
Fig 5. Variability and correlation in mouse auditory cortex.
A: Average response versus response variance in a single population. Colors correspond to 10 randomly chosen stimuli. Dots correspond to single neurons, circles to averaged values across population. Dashed line indicates identity. Inset: All neurons for all stimuli. B: Scatter plot of signal correlation coefficient (across stimuli) vs. noise correlation coefficient (averaged over stimuli), for different neural populations measured in the same animal; marginal histograms at top and bottom. Signal and noise correlations are correlated across pairs. Correlations are high in general, but the amount of signal and noise correlations varies strongly across populations. Circles denote average across pairs in each populations. Inset: Black circles, average signal and noise correlations in all measured populations. Grey dots, individual pairs, 5% randomly chosen from all experiments.
Fig 6
Fig 6. Dependence of noise distribution orientation on average response, in data.
A, B: Typical examples, 6 neural populations recorded in the same animal. Relative variances projected on mean and diagonal directions, versus cosine of angle between mean response and diagonal. Each marker corresponds to a different stimulus. Different markers/colors denote different populations. Squares to the left side indicate Cijij/Ciii. Solid lines: linear fits. C: Slopes from linear fits as in A, B of σμ/σall vs. slope from σd/σall, for all measured populations. Circles correspond to slopes for positive, squares to negative cos(r,d). Colors in all panels indicate value of cN in populations.
Fig 7
Fig 7. Scaling of covariances with average response, in experiments and models.
A, B: Distribution of parameters ρ and ρext (variability of network connections and stimulus input) estimated from all experiments. C: Histograms of cos(d,r(s)) from mean responses across stimuli, for a selection of populations recorded from in one animal. Filled histograms: experimental data. Solid lines: model results for 500 randomly generated stimuli and one network with random effective connections, parameters inferred from data. D: Population-averaged variances and covariances versus population-averaged response, for all stimuli (full circles) in one experiment and for corresponding feed-forward models (empty circles). Dashed lines represent linear fits. E: Scatter plot of ratio slope/intercept from linear fits in all experiments (excluding four outliers with very low intercept) versus corresponding values in the feed-forward model. Orange circle indicates population used in panel D. F: The ratio intercept/slope is consistent for covariances and variances, across experiments (dots). G: Distribution of estimated slopes for average variances. H: Distribution of estimated 〈Vext〉 (intercept/slope from fits to variances) compared to distribution of average and minimum firing rate across experiments.
Fig 8
Fig 8. Effect of correlations on stimulus discrimination.
A: Signal-to-noise ratio S, dots correspond to pairs of stimuli. Value from observed covariance matrix versus value based on shuffled trials, for different populations (different colors) in the same animal. B: Same data, distribution of S(shuffled)/S(original). Broad distribution, but mean value greater than one for all populations (tics) indicates that shuffling increases information on average. C: Distribution of cosine of angle between diagonal and average-response difference, across stimulus pairs for different neural populations. Large cosines/small angles are most frequent. D: Scatter plot of effect of correlations on discrimination. Small dots correspond to stimulus pairs. Connected large dots indicate average value in a bin centered at the corresponding location on the x-axes. E: The distribution of mean values across all measured populations shows that correlations are on average unfavorable, for almost all populations. F: Average effect of noise correlations is stronger for larger signal correlations.

Similar articles

Cited by

References

    1. Kriener B, Tetzlaff T, Aertsen A, Diesmann M, Rotter S. Correlations and Population Dynamics in Cortical Networks. Neural Comput. 2008;20(9):2185–2226. doi: 10.1162/neco.2008.02-07-474 - DOI - PubMed
    1. Ostojic S, Brunel N, Hakim V. How connectivity, background activity, and synaptic properties shape the cross-correlation between spike trains. J Neurosci. 2009;29(33):10234–53. doi: 10.1523/JNEUROSCI.1275-09.2009 - DOI - PMC - PubMed
    1. Tetzlaff T, Helias M, Einevoll GT, Diesmann M. Decorrelation of neural-network activity by inhibitory feedback. PLoS Comput Biol. 2012;8(8):e1002596 doi: 10.1371/journal.pcbi.1002596 - DOI - PMC - PubMed
    1. Trousdale J, Hu Y, Shea-Brown E, Josić K. Impact of network structure and cellular response on spike time correlations. PLoS Comput Biol. 2012;8(3):e1002408 doi: 10.1371/journal.pcbi.1002408 - DOI - PMC - PubMed
    1. Renart A, la Rocha JD, Bartho P. The asynchronous state in cortical circuits. Science. 2010;327(5965):587–590. doi: 10.1126/science.1179850 - DOI - PMC - PubMed

Publication types