

A method for inferring regional origins of neurodegeneration
- PMID: 29409009
- PMCID: PMC5837438
- DOI: 10.1093/brain/awx371
A method for inferring regional origins of neurodegeneration
Erratum in
-
Corrigendum.Brain. 2018 Apr 1;141(4):e35. doi: 10.1093/brain/awy058. Brain. 2018. PMID: 29506018 Free PMC article. No abstract available.
Abstract
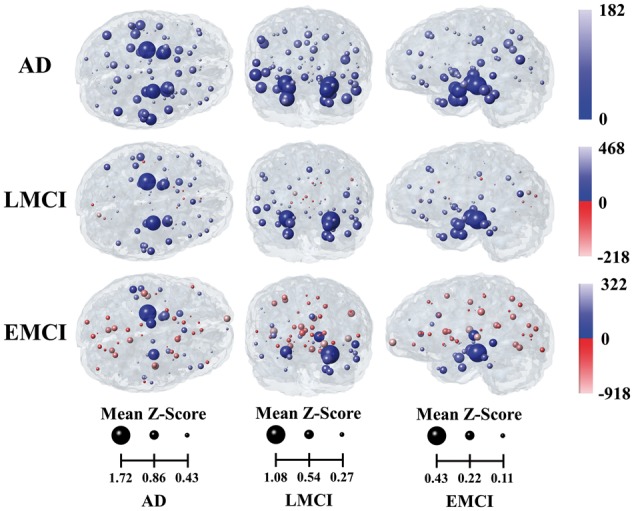
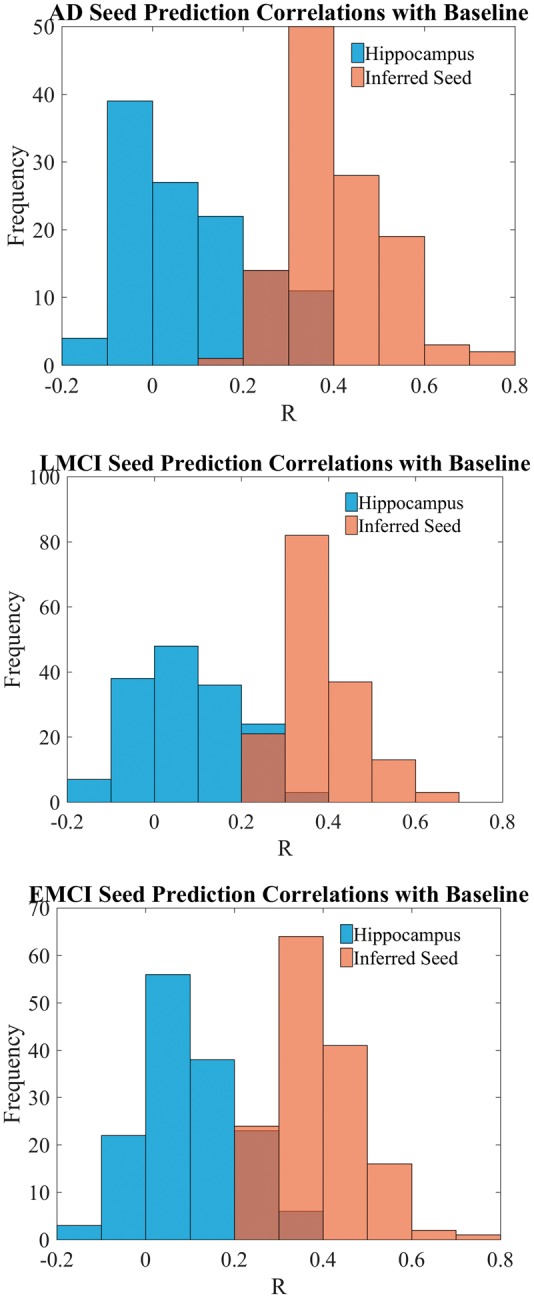
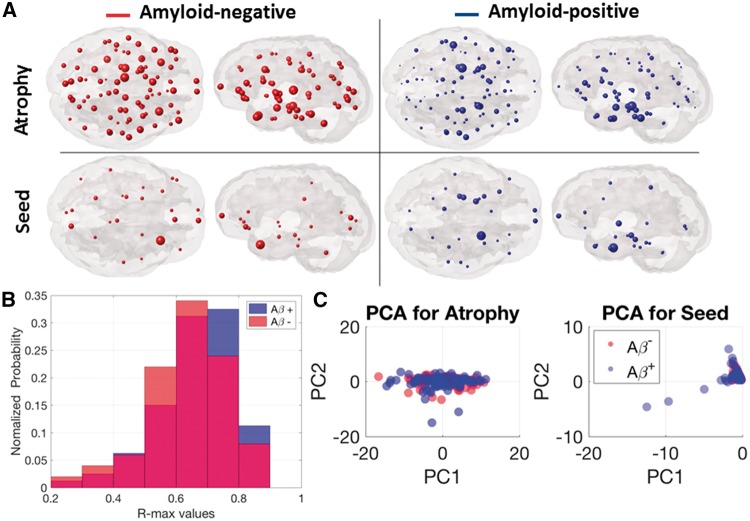
Alzheimer's disease, the most common form of dementia, is characterized by the emergence and spread of senile plaques and neurofibrillary tangles, causing widespread neurodegeneration. Though the progression of Alzheimer's disease is considered to be stereotyped, the significant variability within clinical populations obscures this interpretation on the individual level. Of particular clinical importance is understanding where exactly pathology, e.g. tau, emerges in each patient and how the incipient atrophy pattern relates to future spread of disease. Here we demonstrate a newly developed graph theoretical method of inferring prior disease states in patients with Alzheimer's disease and mild cognitive impairment using an established network diffusion model and an L1-penalized optimization algorithm. Although the 'seeds' of origin using our inference method successfully reproduce known trends in Alzheimer's disease staging on a population level, we observed that the high degree of heterogeneity between patients at baseline is also reflected in their seeds. Additionally, the individualized seeds are significantly more predictive of future atrophy than a single seed placed at the hippocampus. Our findings illustrate that understanding where disease originates in individuals is critical to determining how it progresses and that our method allows us to infer early stages of disease from atrophy patterns observed at diagnosis.
Figures


Similar articles
-
Biomarker clusters are differentially associated with longitudinal cognitive decline in late midlife.Brain. 2016 Aug;139(Pt 8):2261-74. doi: 10.1093/brain/aww142. Epub 2016 Jun 20. Brain. 2016. PMID: 27324877 Free PMC article.
-
Association Between Longitudinal Plasma Neurofilament Light and Neurodegeneration in Patients With Alzheimer Disease.JAMA Neurol. 2019 Jul 1;76(7):791-799. doi: 10.1001/jamaneurol.2019.0765. JAMA Neurol. 2019. PMID: 31009028 Free PMC article.
-
Progressive medial temporal lobe atrophy during preclinical Alzheimer's disease.Neuroimage Clin. 2017 Aug 25;16:439-446. doi: 10.1016/j.nicl.2017.08.022. eCollection 2017. Neuroimage Clin. 2017. PMID: 28879085 Free PMC article.
-
Neurofibrillary tangles and Alzheimer's disease.Eur Neurol. 1998 Oct;40(3):130-40. doi: 10.1159/000007969. Eur Neurol. 1998. PMID: 9748670 Review.
-
Biomarkers, ketone bodies, and the prevention of Alzheimer's disease.Metabolism. 2015 Mar;64(3 Suppl 1):S51-7. doi: 10.1016/j.metabol.2014.10.033. Epub 2014 Oct 30. Metabolism. 2015. PMID: 25468143 Review.
Cited by
-
Atrophy network mapping of transdiagnostic cognitive and neuropsychiatric symptoms.Brain. 2020 Apr 1;143(4):1053-1056. doi: 10.1093/brain/awaa075. Brain. 2020. PMID: 32318733 Free PMC article.
-
Network diffusion model predicts neurodegeneration in limb-onset Amyotrophic Lateral Sclerosis.PLoS One. 2022 Aug 11;17(8):e0272736. doi: 10.1371/journal.pone.0272736. eCollection 2022. PLoS One. 2022. PMID: 35951510 Free PMC article.
-
Modelling pathological spread through the structural connectome in the frontotemporal dementia clinical spectrum.Brain. 2025 Jun 3;148(6):1994-2007. doi: 10.1093/brain/awae391. Brain. 2025. PMID: 39611765 Free PMC article.
-
Identifying Vulnerable Brain Networks in Mouse Models of Genetic Risk Factors for Late Onset Alzheimer's Disease.Front Neuroinform. 2019 Dec 10;13:72. doi: 10.3389/fninf.2019.00072. eCollection 2019. Front Neuroinform. 2019. PMID: 31920610 Free PMC article.
-
Beyond the usual suspects: multi-factorial computational models in the search for neurodegenerative disease mechanisms.Transl Psychiatry. 2024 Sep 23;14(1):386. doi: 10.1038/s41398-024-03073-w. Transl Psychiatry. 2024. PMID: 39313512 Free PMC article. Review.
References
-
- Arriagada PV, Growdon JH, Hedley-Whyte ET, Hyman BT. Neurofibrillary tangles but not senile plaques parallel duration and severity of Alzheimer’s disease. Neurology 1992; 42: 631–9. - PubMed
-
- Attems J, Thal DR, Jellinger KA. The relationship between subcortical tau pathology and Alzheimer’s disease. Biochem Soc Trans 2012; 40: 711–15. - PubMed
Publication types
MeSH terms
Substances
Grants and funding
LinkOut - more resources
Full Text Sources
Other Literature Sources
Medical
