. 2018 Feb 6;9(1):514.
doi: 10.1038/s41467-018-02997-4.

Cryo-EM structure of 5-HT3A receptor in its resting conformation

Affiliations

Cryo-EM structure of 5-HT3A receptor in its resting conformation

Sandip Basak et al. Nat Commun. .

Abstract

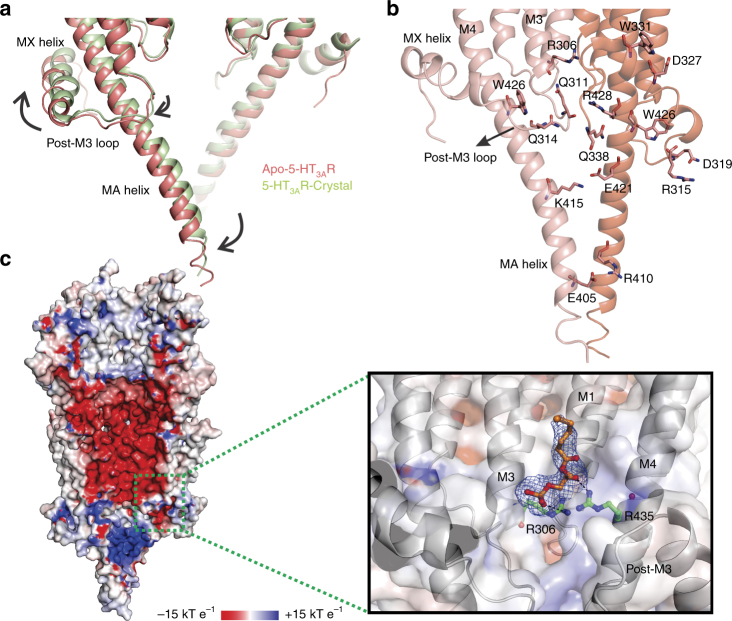
Serotonin receptors (5-HT3AR) directly regulate gut movement, and drugs that inhibit 5-HT3AR function are used to control emetic reflexes associated with gastrointestinal pathologies and cancer therapies. The 5-HT3AR function involves a finely tuned orchestration of three domain movements that include the ligand-binding domain, the pore domain, and the intracellular domain. Here, we present the structure from the full-length 5-HT3AR channel in the apo-state determined by single-particle cryo-electron microscopy at a nominal resolution of 4.3 Å. In this conformation, the ligand-binding domain adopts a conformation reminiscent of the unliganded state with the pore domain captured in a closed conformation. In comparison to the 5-HT3AR crystal structure, the full-length channel in the apo-conformation adopts a more expanded conformation of all the three domains with a characteristic twist that is implicated in gating.


Conflict of interest statement

The authors declare no competing financial interests.

Figures

Fig. 1
Fig. 1
Cryo-EM structure of apo-5-HT3AR. a The 3D reconstruction map from the full-length 5-HT3AR at 4.3 Å resolution. The views, going from left to right, are parallel to the membrane (side view), from the extracellular side (top view), and from the intracellular side (bottom view). Individual subunits are depicted in different colors, and the three domains are labeled. The solid lines denote putative membrane limits. b Cartoon representations of the 5-HT3AR structural model based on the EM reconstruction. The views correspond to the orientations shown in a. For each subunit, three sets of glycans (green) and one lipid (brown) molecule are shown as stick representation
Fig. 2
Fig. 2
Alignment of the apo-5-HT3AR with the crystal structure of nanobody-bound 5-HT3AR. a A view of the ECDs from the extracellular end when aligned with respect to the TMDs (left). The view of the TMDs from the intracellular end when aligned with respect to the ECDs (right). The apo-5-HT3AR structure and the 5-HT3AR crystal structure are shown in salmon red and pale green, respectively. The arrows show the putative direction of displacements between the two structures. b A comparison of the ECD of the apo-structure with the crystal structure when aligned with respect to the TMD of the (−) subunit (left). A comparison of the TMD between the two structures when aligned with the ECD of the (−) subunit. The relative tilt of the axis parallel to the TM helices between the two structures are indicated. The dotted lines highlight the differences in the intrasubunit cavity volume. The spheres indicate the position of residues M1 (Leu227), M2 (Leu266), M3 (Met291), and M4 (Trp456). The arrows show the putative direction of displacements between the two structures (right). The alignment in b highlights the relative changes in the two structures, both with respect to the neighboring subunit, as well as with respect to the other domain
Fig. 3
Fig. 3
Profile of ion permeation pathway. a The pore profile generated by the HOLE program depicts an ion permeation pathway of ~165 Å encompassing the ECD, TMD, and the ICD. Only two subunits are shown for clarity. Sidechains of residues that line the constricted areas are shown as sticks. b A comparison of the pore radii along the pore axis for the 5-HT3AR cryo-EM structure (salmon red) with that of the crystal structure (pale green). The dashed line indicates an approximate radius of a hydrated Na+ ion. The pore is constricted below 3 Å radius at three sites: L260 and E250 along M2 and R416 in the ICD. c Non-protein densities along the pore axis were modeled as water (red), Na+ (magenta), and Cl (green). The map around the ions is shown as a mesh representation calculated at various σ values (outer water ring: 4 σ; inner water ring:5 σ; Na+ ion: 6 σ; Cl ion: 7 σ)
Fig. 4
Fig. 4
The neurotransmitter binding site. a The map around the aromatic residues at the subunit interface that constitutes the neurotransmitter binding site (top). The map for the residues in Loop F that are involved in ligand binding (bottom). b Alignment of 5-HT3AR apo (salmon red) and crystal (pale green) structures reveals a twist and an expansion at the region lined Loop C, Loop B, and Loop F. The arrows indicate the direction of movement. c A comparison of the orientations of the residues that are involved in neurotransmitter binding
Fig. 5
Fig. 5
The Intracellular domain. a The ICD is comprised of the post-M3 loop, the MX, helix, a stretch of unstructured region, followed by the MA helix. The density from the MX helix is bent downward to the intracellular end of the MA helix, but the unstructured region is not resolved. Superposition of the 5-HT3AR apo and crystal structures reveals differences in the conformation of ICD in the two structures. The (−) subunit of the two structures are aligned. The expansion of the ICD resulting from an outward displacement of MA and MX helices are indicated by arrows. b The residues within the ICD involved in several potential intra and inter-subunit interactions. c The solvent-accessible electrostatic potential map generated using the APBS tool. The inset shows a zoomed-in view of the lipid-binding pocket within the dotted green box. The lipid (partially built phospholipid) and the interacting residues (R306 and R435) are shown in stick. The map around the lipid is shown as blue mesh

References

    1. Maricq AV, Peterson AS, Brake AJ, Myers RM, Julius D. Primary structure and functional expression of the 5HT3 receptor, a serotonin-gated ion channel. Science. 1991;254:432–437. doi: 10.1126/science.1718042. - DOI - PubMed
    1. Lummis SC. 5-HT(3) receptors. J. Biol. Chem. 2012;287:40239–40245. doi: 10.1074/jbc.R112.406496. - DOI - PMC - PubMed
    1. Niesler B, Frank B, Kapeller J, Rappold GA. Cloning, physical mapping and expression analysis of the human 5-HT3 serotonin receptor-like genes HTR3C, HTR3D and HTR3E. Gene. 2003;310:101–111. doi: 10.1016/S0378-1119(03)00503-1. - DOI - PubMed
    1. Engel M, Smidt MP, van Hooft JA. The serotonin 5-HT3 receptor: a novel neurodevelopmental target. Front. Cell Neurosci. 2013;7:76. doi: 10.3389/fncel.2013.00076. - DOI - PMC - PubMed
    1. Gehlert DR, Gackenheimer SL, Wong DT, Robertson DW. Localization of 5-HT3 receptors in the rat brain using [3H]LY278584. Brain Res. 1991;553:149–154. doi: 10.1016/0006-8993(91)90242-N. - DOI - PubMed

Publication types

LinkOut - more resources