. 2018 Feb 6;9(1):519.
doi: 10.1038/s41467-017-02376-5.

Proliferation dynamics of acute myeloid leukaemia and haematopoietic progenitors competing for bone marrow space

Affiliations

Proliferation dynamics of acute myeloid leukaemia and haematopoietic progenitors competing for bone marrow space

O Akinduro et al. Nat Commun. .

Abstract

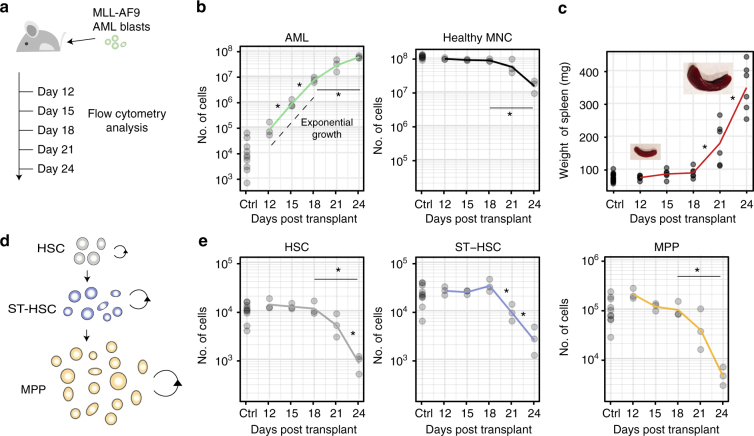
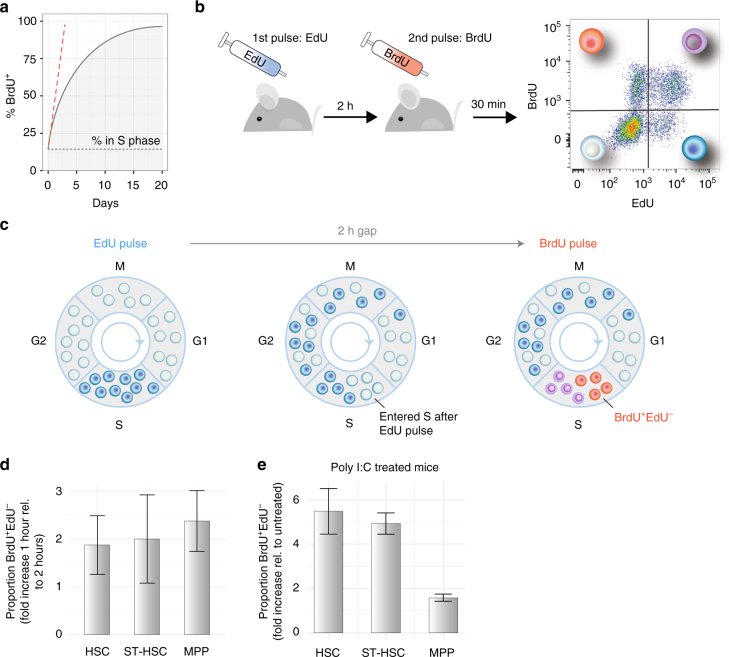
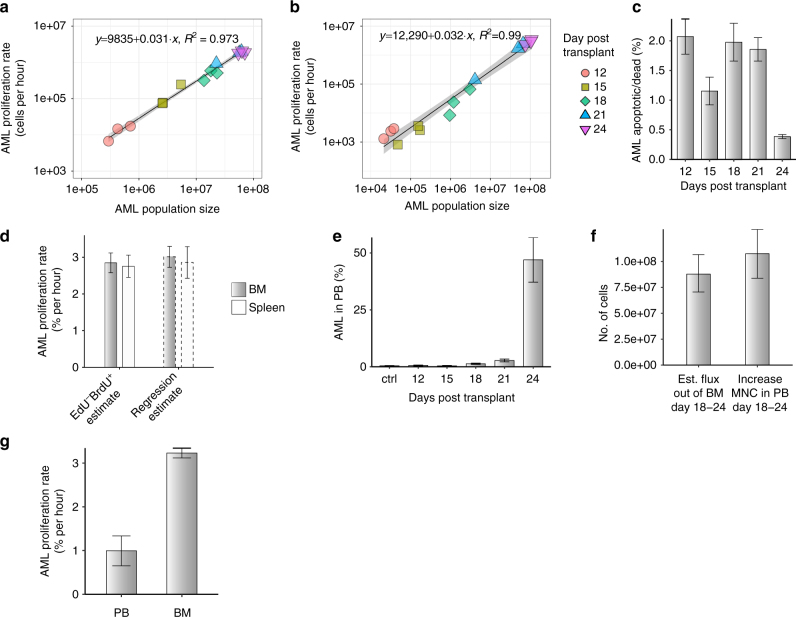
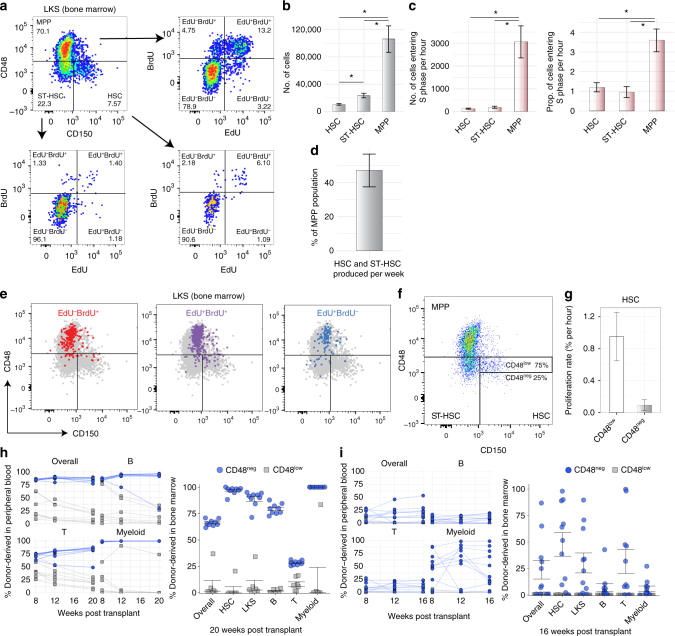
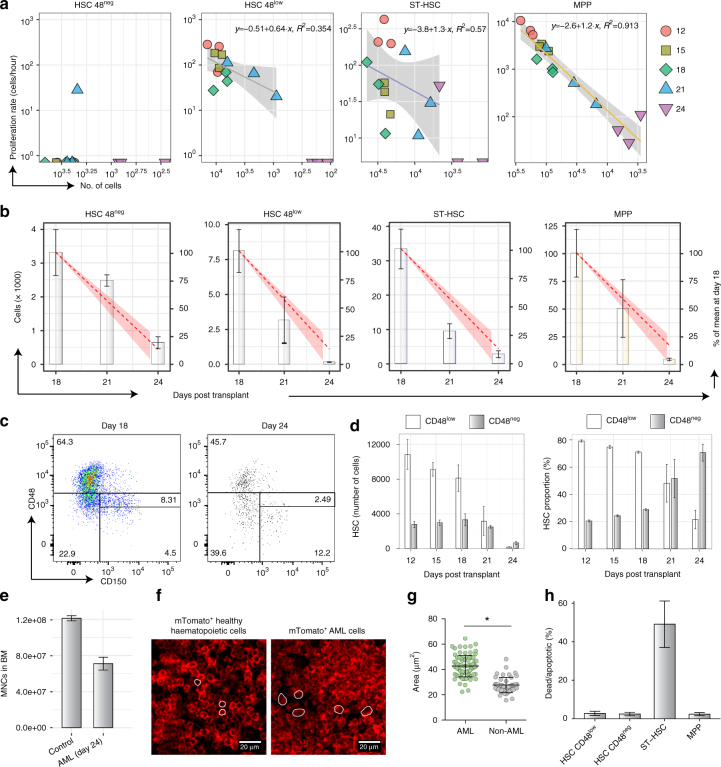
Leukaemia progressively invades bone marrow (BM), outcompeting healthy haematopoiesis by mechanisms that are not fully understood. Combining cell number measurements with a short-timescale dual pulse labelling method, we simultaneously determine the proliferation dynamics of primitive haematopoietic compartments and acute myeloid leukaemia (AML). We observe an unchanging proportion of AML cells entering S phase per hour throughout disease progression, with substantial BM egress at high levels of infiltration. For healthy haematopoiesis, we find haematopoietic stem cells (HSCs) make a significant contribution to cell production, but we phenotypically identify a quiescent subpopulation with enhanced engraftment ability. During AML progression, we observe that multipotent progenitors maintain a constant proportion entering S phase per hour, despite a dramatic decrease in the overall population size. Primitive populations are lost from BM with kinetics that are consistent with ousting irrespective of cell cycle state, with the exception of the quiescent HSC subpopulation, which is more resistant to elimination.


Conflict of interest statement

The authors declare no competing financial interests.

Figures

Fig. 1
Fig. 1
Population dynamics of healthy and malignant haematopoietic cells as leukaemia progresses. a Cohorts of mice were injected i.v. with 100,000 MLL-AF9 AML blasts at day 0. Control and diseased mice were culled at days 12, 15, 18, 21 and 24, for flow cytometry analysis of BM cells (tibeas, femurs and ileac crest bones). b Between days 18 and 24, as AML cell numbers grow in the BM (p = 0.003, Welch two-sample t-test), mononuclear cell counts decrease significantly (p = 5.43e−04, Welch two-sample t-test). c Spleen weights increase following AML cells injection, slowly at first and significantly by day 21 (p = 0.016, Welch two-sample t-test) and day 24 (p = 0.001, Welch two-sample t-test). d At the apex of the haematopoietic cascade are HSCs, ST-HSCs and MPPs. Cells in each population proliferate (circular arrows) and differentiate into the downstream population (straight arrows). e Quantification of HSC (LKS CD150+CD48−/low), ST-HSC (LKS CD150-CD48−/low) and MPP (LKS CD48+) cell numbers as disease progresses. A significant reduction in population size was observed between days 18 and 24 in all populations (p = 0.04 HSCs, p = 0.03 ST-HSCs and p = 0.046 MPPs, Welch two-sample t-test); n = 15 control in total and 3 leukaemic mice per time point analysed, apart for c where 4–6 spleens/time point are shown. Results from one cohort shown, with equivalent results obtained from two other independent experiments
Fig. 2
Fig. 2
EdU and BrdU dual pulse allows measurement of rate of entry into S phase of haematopoietic cell populations. a Assuming a constant proportion of cells are in S phase (black dotted line), continuous administration of BrdU alone leads to progressive accumulation of the thymidine analogue in a growing proportion of the cell population (black line). The rate of entry in S phase at the time of the first administration is the derivative at the origin of the curve (dashed red line) and cannot be calculated from a single mouse. b Experimental setup: mice were administered EdU first, then BrdU 2 h later, and 30 min later were culled, and haematopoietic cells were analysed by flow cytometry. c Diagram representing the dynamics of cell labelling. EdU first labels all the cells in S phase (dark blue). In the 2-h gap, some of these cells progress through G2 and mitosis, while others continue to synthetise DNA (dark blue). In parallel, some unlabelled cells enter S phase (empty circles). BrdU again labels all the cells in S phase, with the following results: cells that entered S phase during the 2-h gap are BrdU single positive (orange circles), cells that were in S phase during both pulses are double positive (purple circles), and cells that terminated S phase prior to the BrdU pulse are EdU single positive (blue circles). d Validation of the dual-pulse method. A 2-h gap between pulses results in a 2-fold increase in the number of labelled cells compared to a 1-h pulse (shown is average ± s.e.m; p = 0.84 HSC, p = 0.99 ST-HSC, p = 0.61 MPP, Welch two-sample t-test; n = 3 mice with 1 h gap, and n = 3 mice with a 2 h gap). e Dual-pulse method can identify the changes in proliferation rate of cell populations. Mice were administered poly I:C prior to EdU and BrdU, 24 h prior to culling, and the proportions of S phase HSCs, ST-HSCs and MPPs were compared to those of control mice (average ± s.e.m shown; p = 0.04 HSC, p = 0.01 ST-HSC, p = 0.07 MPP, Welch two-sample t-test; n = 3 control and n = 3 poly I:C treated mice)
Fig. 3
Fig. 3
Proliferation and BM egression dynamics of AML cells. Number of AML cells entering S phase per hour in BM (a) and spleen (b) are plotted against absolute numbers of AML cells in tibea, femur and ileac crest bones of mice at multiple time points following injection of AML blasts (colour and shape coded). Black lines are linear regression of the data, with confidence intervals in grey. c Very small proportions of apoptotic cells (DAPI and/or Annexin V positive) are detectable within the AML cell population throughout disease progression (average ± s.e.m shown; days 15 and 24, p = 0.07, Welch two-sample t-test; n = 3 mice at each time point). d Proportion of AML cells entering S phase per hour estimated for BM (grey bars) and spleen (white bars) using dual-pulse method (left) and exponential regression from data presented in Fig. 1b and Supplementary Fig. 1 (average ± s.e.m; BM vs. spleen EdUBrdU+ estimates p = 0.8208, Welch two-sample t-test; n = 9 mice). e The proportion of AML cells in PB (RBC lysed) increases slowly following injection of blasts, and dramatically by the late stages of the disease (average ± s.e.m; n = 3 mice per time point). f Comparison of estimated number of AML cells exiting BM between days 18 and 24, and measured increase in MNCs in blood during those days (average ± bootstrap std. deviation shown for estimate, average ± s.e.m shown for measured values; estimate, n = 6 samples based on measurements presented in Figs. 1b and 3a; measured PB MNC, n = 6 mice). g Proportion of AML cells entering S phase per hour in blood and BM (average ± s.e.m shown; p = 0.0003, Welch two-sample t-test; n = 3 and 6 mice)
Fig. 4
Fig. 4
EdU-BrdU dual pulse reveals instantaneous rate of entry into S phase of primitive haematopoietic cell populations in steady-state conditions. a Representative FACS plot of LKS cells, showing HSC, ST-HSC and MPP populations and their relative FACS plots of EdU and BrdU incorporation patterns. b Total number of HSCs, ST-HSCs and MPPs in BM from one hind leg. c Number (left) and proportion (right) of HSCs, ST-HSCs and MPPs entering S phase per hour (average ± s.e.m shown; left, p = 0.252 HSC to ST-HSC, p = 0.002 HSC to MPP, p = 0.003 ST-HSC to MPP, Welch’s two-sample t-test; right, p = 0.509 HSC to ST-HSC, p = 0.004 HSC to MPP, p = 0.002 ST-HSC to MPP, Welch’s two-sample t-test; n = 15 mice analysed). d Number of cells produced per week by HSCs and ST-HSCs compared with MPP population size based on the data presented in b and c (average ± s.e.m. shown). e Representative FACS plot of LKS cell population, highlighting the phenotype of EdUBrdU+, EdU+BrdU+ and EdU+BrdU cells. f Representative FACS plot showing gates separating HSCs with the lowest 25% expression levels of CD48 (CD48neg) and the higher 75% (CD48low). g Proportion of CD48low and CD48neg HSCs entering S phase per hour based on EdU and BrdU uptake (average ± s.e.m shown; p = 0.019, Welch’s two-sample t-test; n = 10 mice). h Transplantation of mTomato+ CD48neg and CD48low HSCs into lethally irradiated recipients. Left panel: time-course of engraftment at weeks 8, 12 and 20 (data, mean ± s.e.m shown; p < 10−4 overall, B, T and Myeloid, exact one-way permutation test for mean difference between groups; n = 9 and n = 7 mice, respectively). Right panel: bone marrow engraftment at week 20. i Secondary transplantation of mTomato+ CD48neg and CD48low HSCs into lethally irradiated recipients. Left panel: time-course of engraftment at weeks 8, 12 and 16 (data, mean ± s.e.m shown; p < 10−4 overall, B, T and Myeloid, exact one-way permutation test for mean difference between two groups with n = 11 mice each). Right panel: bone marrow engraftment at week 16
Fig. 5
Fig. 5
Primitive haematopoietic cell populations proliferative dynamics under leukaemic stress. a Number of cells entering S phase per hour plotted against number of cells in each of the indicated cell population, colour- and shape-coded per day of analysis following AML blasts injection. Lines show linear regression with 95% confidence intervals shown as grey shadows. b Numbers of each analysed population per hind leg, with red dotted line and shaded area indicating the estimated cell loss based on a cell type and cell cycle independent ousting model. c Representative FACS plot of LKS cells showing CD48neg and CD48low gates at days 18 and 24 of disease progression, showing survival of HSCs in the CD48neg gate. d CD48neg and CD48low HSC numbers (left) and relative proportions (right) as a function of time (average ± s.e.m shown). e Numbers of mononuclear cells in the hind legs BM of control and advanced leukaemic mice (average ± s.e.m; p = 0.012, Welch’s two-sample t-test; n = 2 control and 3 AML mice from one representative cohort). f Histological sections of BM from mice reconstituted with healthy mTmG BM MNC (left) and day 24 mTmG MLL-AF9 blasts (right). Red is membrane-bound tomato signal, while white lines provide illustrative examples of measured cells. g Cell area measurements of healthy and AML cells from day 24 of disease (p < 10−4, Welch’s two-sample t-test; n = 48 healthy and n = 78 AML cells measured from sections from one whole BM chimera and 3 day-24 AML-burdened mice). h Proportion of dead or apoptotic (Annexin V and/or DAPI positive) primitive cell populations in mice at an advanced stage of disease, day 24 (p = 0.68 for CD48neg HSC, p = 0.24 for CD48low HSC, p = 0.06 for ST-HSCs and p = 0.3 for MPPs, Welch two-sample t-test; n = 10 control mice, n = 3 leukaemic mice). Throughout the figure, a representative cohort of 15 mice is shown, with 3 analysed at each time point

References

    1. Kondo M, et al. Biology of hematopoietic stem cells and progenitors: implications for clinical application. Annu. Rev. Immunol. 2003;21:759–806. doi: 10.1146/annurev.immunol.21.120601.141007. - DOI - PubMed
    1. Foudi A, et al. Analysis of histone 2B-GFP retention reveals slowly cycling hematopoietic stem cells. Nat. Biotechnol. 2009;27:84–90. doi: 10.1038/nbt.1517. - DOI - PMC - PubMed
    1. Wilson A, et al. Hematopoietic stem cells reversibly switch from dormancy to self-renewal during homeostasis and repair. Cell. 2008;135:1118–1129. doi: 10.1016/j.cell.2008.10.048. - DOI - PubMed
    1. Bernitz JM, Kim HS, MacArthur B, Sieburg H, Moore K. Hematopoietic stem cells count and remember self-renewal divisions. Cell. 2016;167:1296–1309.e1210. doi: 10.1016/j.cell.2016.10.022. - DOI - PMC - PubMed
    1. Qiu J, Papatsenko D, Niu X, Schaniel C, Moore K. Divisional history and hematopoietic stem cell function during homeostasis. Stem Cell Rep. 2014;2:473–490. doi: 10.1016/j.stemcr.2014.01.016. - DOI - PMC - PubMed

Publication types