Randomized Controlled Trial
. 2018 Feb 6;8(1):2453.
doi: 10.1038/s41598-018-20827-x.

Intestinal microbiota development and gestational age in preterm neonates

Affiliations
Randomized Controlled Trial

Intestinal microbiota development and gestational age in preterm neonates

Katri Korpela et al. Sci Rep. .

Abstract

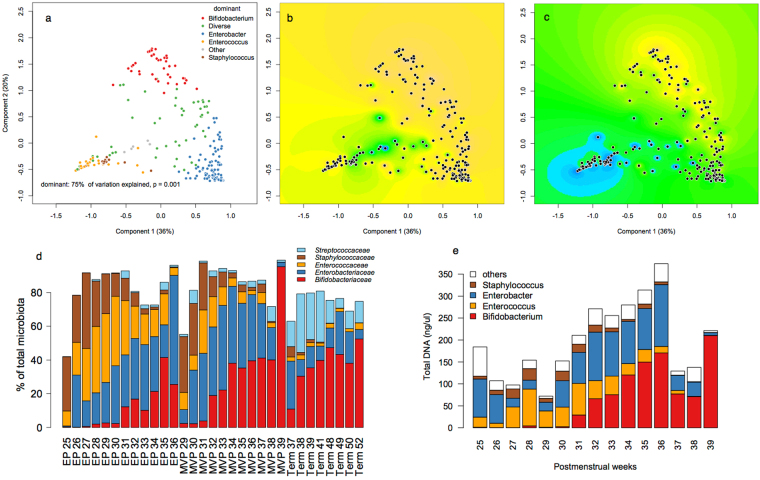
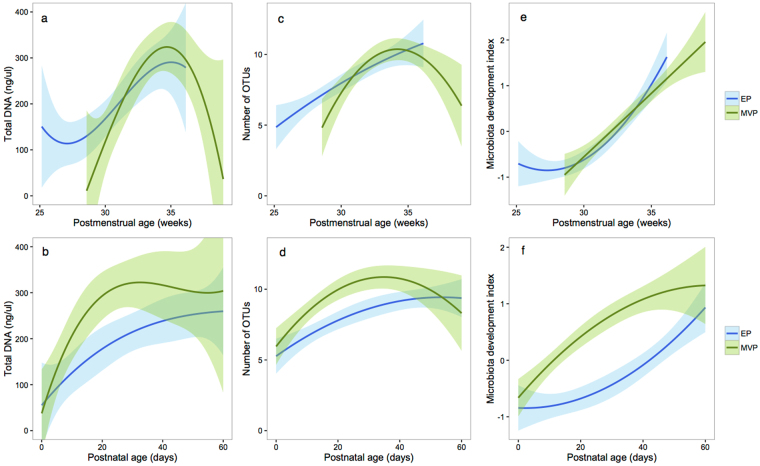
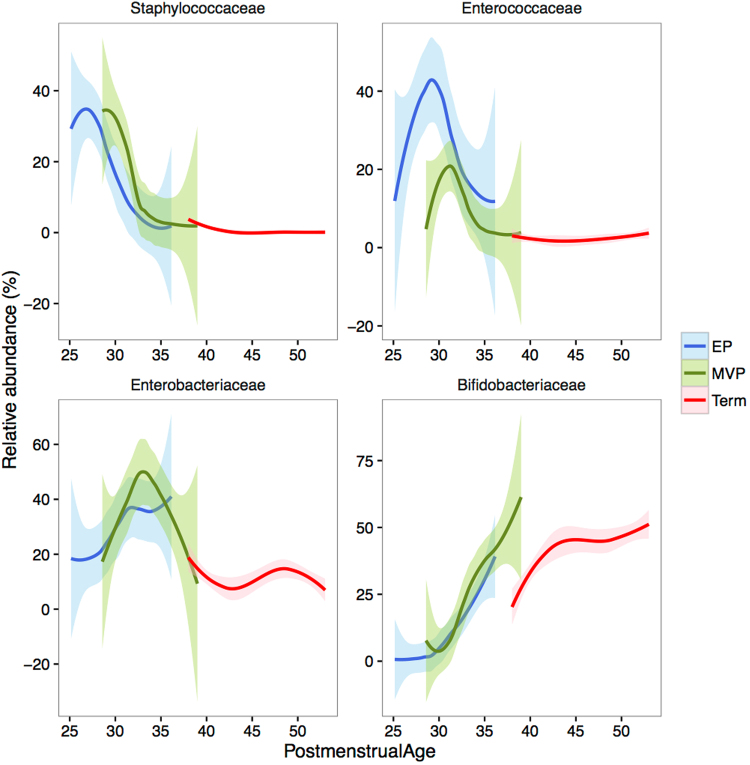
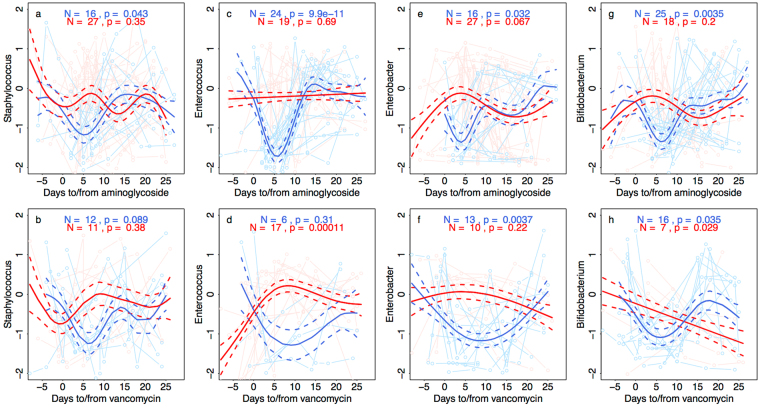
The intestinal microbiota is an important contributor to the health of preterm infants, and may be destabilized by a number of environmental factors and treatment modalities. How to promote the development of a healthy microbiota in preterm infants is largely unknown. We collected fecal samples from 45 breastfed preterm very low birth weight (birth weight < 1500 g) infants from birth until 60 days postnatal age to characterize the intestinal microbiota development during the first weeks of life in preterm infants. Fecal microbiota composition was determined by 16S rRNA amplicon sequencing. The main driver of microbiota development was gestational age; antibiotic use had strong but temporary effects and birth mode had little influence. Microbiota development proceeded in four phases indicated by the dominance of Staphylococcus, Enterococcus, Enterobacter, and finally Bifidobacterium. The Enterococcus phase was only observed among the extremely premature infants and appeared to delay the microbiota succession. The results indicate that hospitalized preterm infants receiving breast milk may develop a normal microbiota resembling that of term infants.


Conflict of interest statement

The authors declare that they have no competing interests.

Figures

Figure 1
Figure 1
Microbiota composition in the fecal samples of preterm infants. Principal coordinates analyses (PCoA, Bray-Curtis dissimilarities) (ac). The axes represent PCoA component scores, showing the two most important gradients differentiating the microbial communities. Each circle represents a microbial community, colored in panel (a) by the dominant organism in the community (>50% of all reads). Background color corresponds to: (b) postnatal age of the infant at the time of fecal sample collection; (c) postmenstrual age of the infant at sample collection. Blue background indicates low values, green intermediate, and orange high values. Average relative abundances of the dominant families in extremely premature (EP), moderately or very premature (MVP), compared to term infants from a Dutch cohort, at different postmenstrual ages (weeks) (d). Average total DNA concentration by postmenstrual age, divided to bacterial taxa based on their relative abundances in the 16S rRNA data (e).
Figure 2
Figure 2
Development of the microbiota with postmenstrual (a,c,e) and postnatal (b,d,e) age. Association between postmenstrual and postnatal age of the infant and total DNA concentration (a,b), microbial richness (c,d), and development index (e,f, sum of the two first principal components in Fig. 1) among infants born before (extremely premature, EP), and at/after gestational week 28 (moderately or very premature, MVP). The trend lines show the best-fit (second polynomial) and the shaded areas show 95% confidence intervals.
Figure 3
Figure 3
Development of the most abundant bacterial genera in premature and term-born infants with respect to postmenstrual age. The trend lines show the best-fit (second polynomial) and the shaded areas show 95% confidence intervals.
Figure 4
Figure 4
Effect of antibiotic treatments on the most abundant bacterial genera. Deviation from expected relative abundance of each genus, based on age of the infant and birth mode, is shown in relation to timing of the antibiotic courses. Consistently negative values after the beginning of the antibiotic course (between days 1 and 10) are interpreted as a response to the antibiotic, and the infants are categorized as responders (blue) or non-responders (red). Number of infants in each category and the p-values of the GAMM models are shown.
Figure 5
Figure 5
Relative abundances of Bifidobacterium, Staphylococcus, and Enterococcus before (“Pre”), during (“Sep”), and after (“Post”) sepsis, compared to infants with no sepsis (“No”).

References

    1. Kramer M, et al. The contribution of mild and moderate preterm birth to infant mortality. JAMA. 2000;284:843–849. doi: 10.1001/jama.284.7.843. - DOI - PubMed
    1. Neu, J., Chen, M. & Beierle, E. Intestinal innate immunity: how does it relate to the pathogenesis of necrotizing enterocolitis. In: Seminars in pediatric surgerysurgery, pp.137–144: Elsevier (2005). - PubMed
    1. Malaeb S, Dammann O. Fetal inflammatory response and brain injury in the preterm newborn. J. Child Neurol. 2009;24:1119–1126. doi: 10.1177/0883073809338066. - DOI - PMC - PubMed
    1. Magne F, et al. Low species diversity and high interindividual variability in faeces of preterm infants as revealed by sequences of 16S rRNA genes and PCR-temporal temperature gradient gel electrophoresis profiles. FEMS Microbiol Ecol. 2006;57:128–138. doi: 10.1111/j.1574-6941.2006.00097.x. - DOI - PubMed
    1. Arboleya S, et al. Establishment and development of intestinal microbiota in preterm neonates. FEMS Microbiol Ecol. 2012;79:763–772. doi: 10.1111/j.1574-6941.2011.01261.x. - DOI - PubMed

Publication types

MeSH terms

LinkOut - more resources