

Disruption of Intracellular ATP Generation and Tight Junction Protein Expression during the Course of Brain Edema Induced by Subacute Poisoning of 1,2-Dichloroethane
- PMID: 29410610
- PMCID: PMC5787108
- DOI: 10.3389/fnins.2018.00012
Disruption of Intracellular ATP Generation and Tight Junction Protein Expression during the Course of Brain Edema Induced by Subacute Poisoning of 1,2-Dichloroethane
Abstract
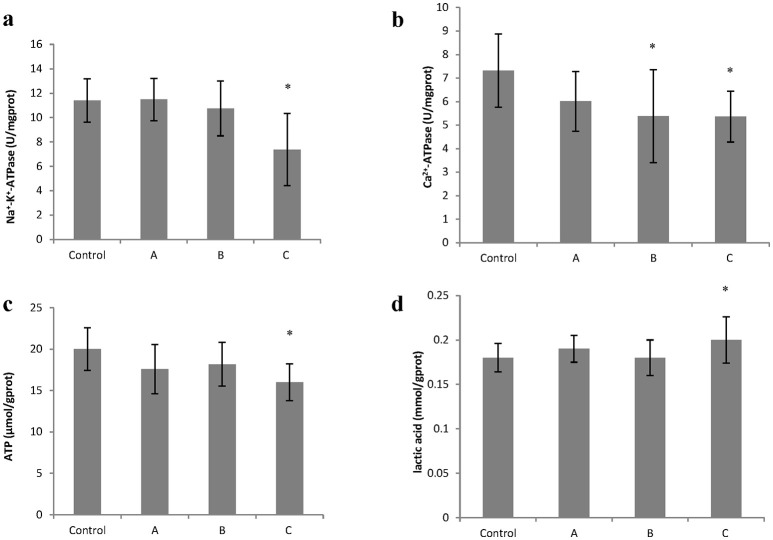
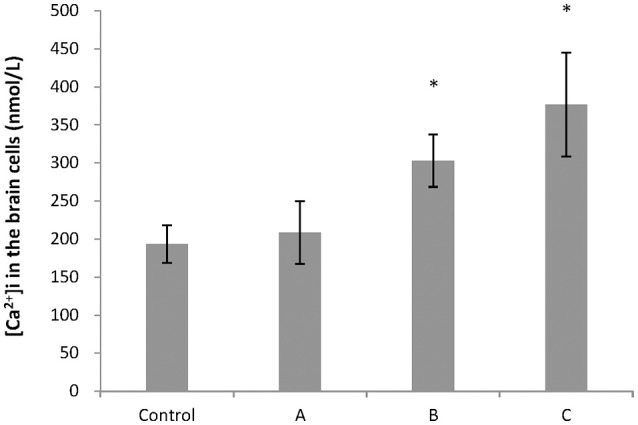
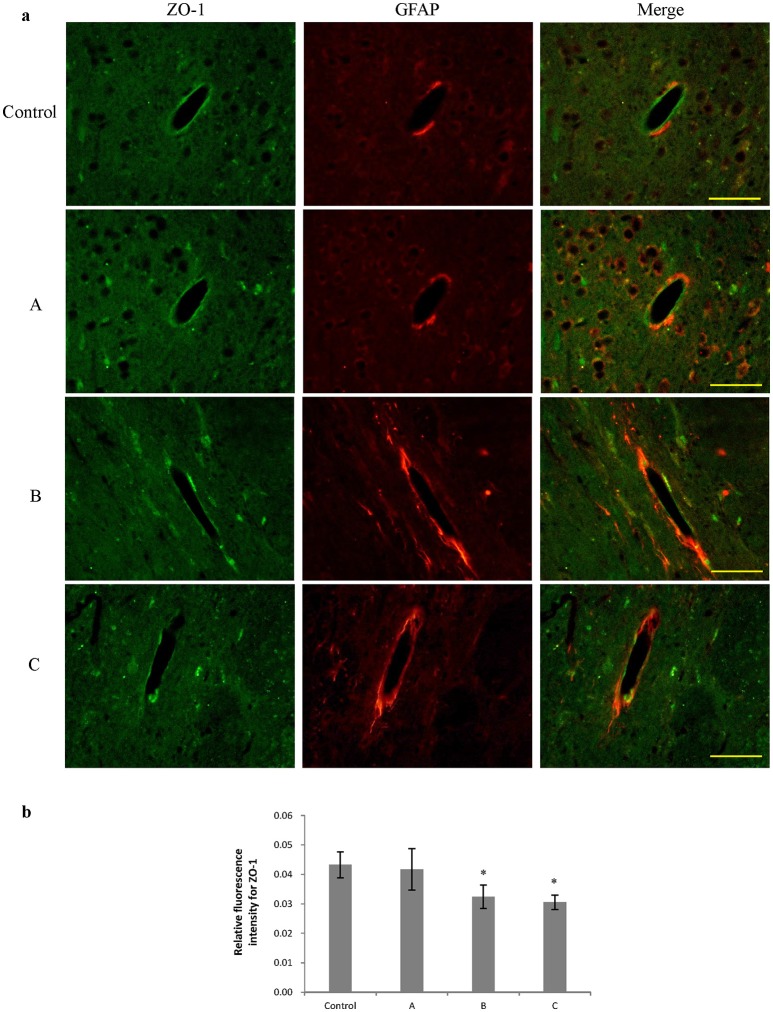
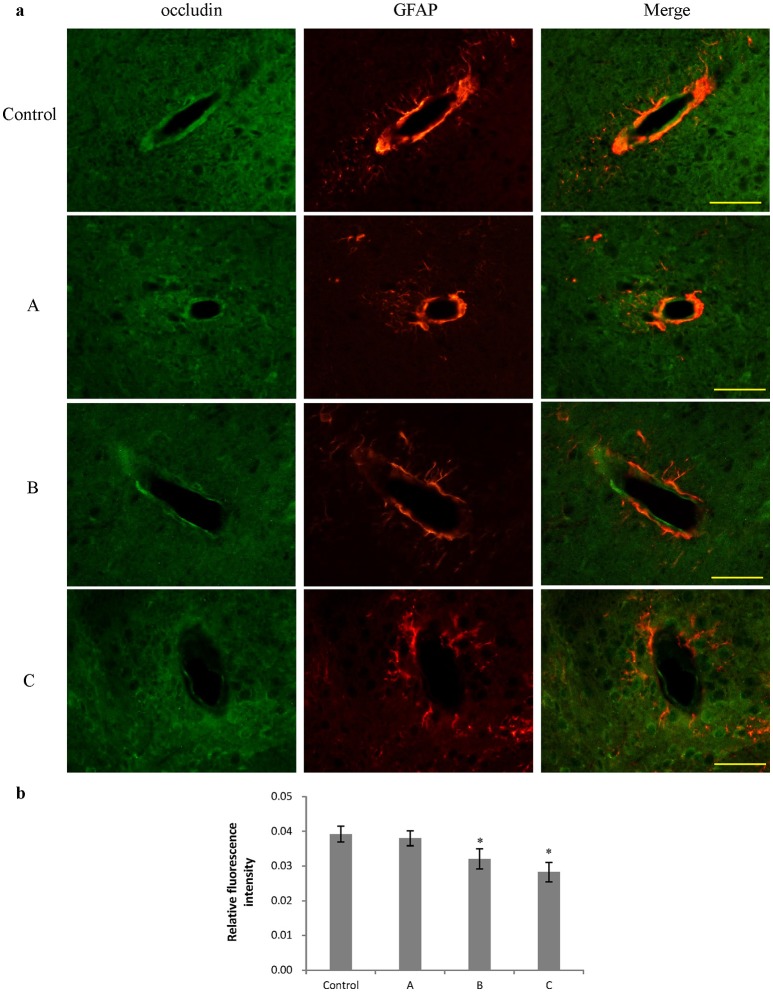
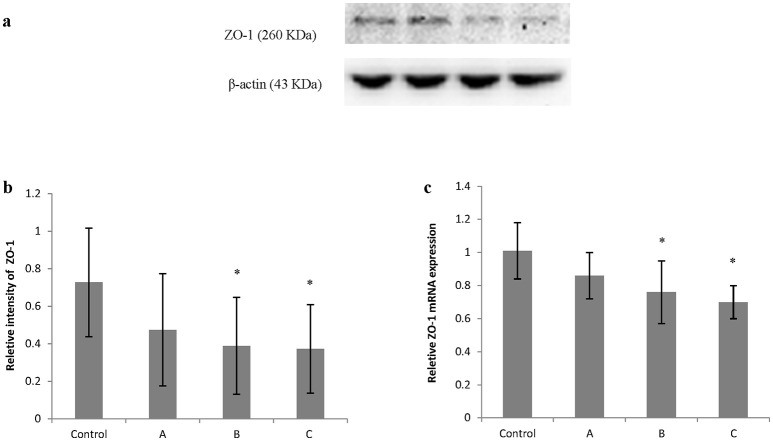
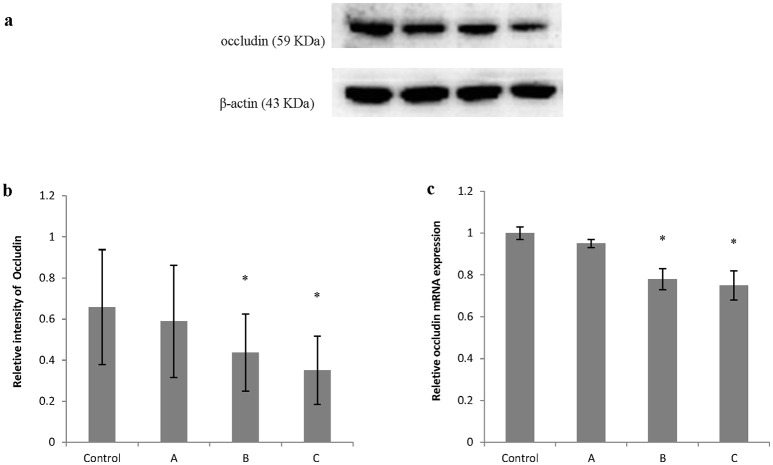
The aim of this study was to explore changes in intracellular ATP generation and tight junction protein expression during the course of brain edema induced by subacute poisoning of 1,2-dichloroethane (1,2-DCE). Mice were exposed to 1.2 g/m3 1,2-DCE for 3.5 h per day for 1, 2, or 3 days, namely group A, B, and C. Na+-K+-ATPase and Ca2+-ATPase activity, ATP and lactic acid content, intracellular free Ca2+ concentration and ZO-1 and occludin expression in the brain were measured. Results of present study disclosed that Ca2+-ATPase activities in group B and C, and Na+/K+-ATPase activity in group C decreased, whereas intracellular free Ca2+ concentrations in group B and C increased significantly compared with control. Moreover, ATP content decreased, whereas lactic acid content increased significantly in group C compared with control. On the other hand, expressions of ZO-1 and occludin at both the protein and gene levels in group B and C decreased significantly compared with control. In conclusion, findings from this study suggest that calcium overload and depressed expression of tight junction associated proteins, such as ZO-1 and occludin might play an important role in the early phase of brain edema formation induced by subacute poisoning of 1,2-DCE.
Keywords: 1; 2-dichloroethane poisoning; ATP generation; blood brain barrier; brain edema; tight junction associated proteins.
Figures
Similar articles
-
Involvement of CYP2E1 in the Course of Brain Edema Induced by Subacute Poisoning With 1,2-Dichloroethane in Mice.Front Pharmacol. 2018 Nov 15;9:1317. doi: 10.3389/fphar.2018.01317. eCollection 2018. Front Pharmacol. 2018. PMID: 30524279 Free PMC article.
-
Involvement of the p38 MAPK signaling pathway in overexpression of matrix metalloproteinase-9 during the course of brain edema in 1,2-dichloroethane-intoxicated mice.Neurotoxicology. 2018 Dec;69:296-306. doi: 10.1016/j.neuro.2018.07.022. Epub 2018 Aug 3. Neurotoxicology. 2018. PMID: 30081051
-
[Expression of CYP2E1 in different brain regions during the formation of toxic cerebral edema induced by 1, 2-DCE in mice and its effect on cerebral edema formation].Zhonghua Lao Dong Wei Sheng Zhi Ye Bing Za Zhi. 2020 Nov 20;38(11):809-814. doi: 10.3760/cma.j.cn121094-20191030-00509. Zhonghua Lao Dong Wei Sheng Zhi Ye Bing Za Zhi. 2020. PMID: 33287471 Chinese.
-
Neuroinflammatory Reactions in the Brain of 1,2-DCE-Intoxicated Mice during Brain Edema.Cells. 2019 Aug 27;8(9):987. doi: 10.3390/cells8090987. Cells. 2019. PMID: 31461951 Free PMC article.
-
Molecular mechanisms of 1,2-dichloroethane-induced neurotoxicity.Toxicol Res. 2023 Jul 13;39(4):565-574. doi: 10.1007/s43188-023-00197-x. eCollection 2023 Oct. Toxicol Res. 2023. PMID: 37779589 Free PMC article. Review.
Cited by
-
Roles of Crosstalk between Astrocytes and Microglia in Triggering Neuroinflammation and Brain Edema Formation in 1,2-Dichloroethane-Intoxicated Mice.Cells. 2021 Oct 3;10(10):2647. doi: 10.3390/cells10102647. Cells. 2021. PMID: 34685627 Free PMC article.
-
Brain Endothelial Cells: Metabolic Flux and Energy Metabolism.Handb Exp Pharmacol. 2022;273:59-79. doi: 10.1007/164_2021_494. Handb Exp Pharmacol. 2022. PMID: 34251530
-
Involvement of CYP2E1 in the Course of Brain Edema Induced by Subacute Poisoning With 1,2-Dichloroethane in Mice.Front Pharmacol. 2018 Nov 15;9:1317. doi: 10.3389/fphar.2018.01317. eCollection 2018. Front Pharmacol. 2018. PMID: 30524279 Free PMC article.
-
Metformin as Potential Therapy for High-Grade Glioma.Cancers (Basel). 2020 Jan 15;12(1):210. doi: 10.3390/cancers12010210. Cancers (Basel). 2020. PMID: 31952173 Free PMC article.
-
The Effect of Normoxic and Hypoxic U-87 Glioblastoma Paracrine Secretion on the Modulation of Brain Endothelial Cells.Cells. 2022 Jan 14;11(2):276. doi: 10.3390/cells11020276. Cells. 2022. PMID: 35053392 Free PMC article.
References
LinkOut - more resources
Full Text Sources
Other Literature Sources
Miscellaneous