Review
. 2018 Jan 23:9:7.
doi: 10.3389/fneur.2018.00007. eCollection 2018.

Status Epilepticus: Behavioral and Electroencephalography Seizure Correlates in Kainate Experimental Models

Affiliations
Review

Status Epilepticus: Behavioral and Electroencephalography Seizure Correlates in Kainate Experimental Models

Shaunik Sharma et al. Front Neurol. .

Abstract

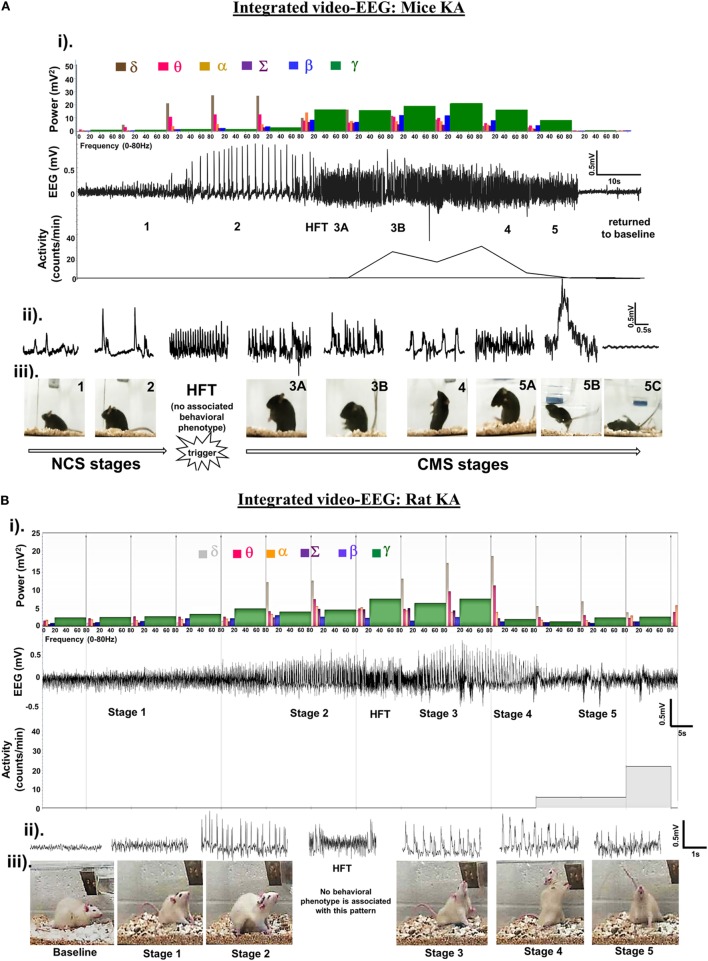
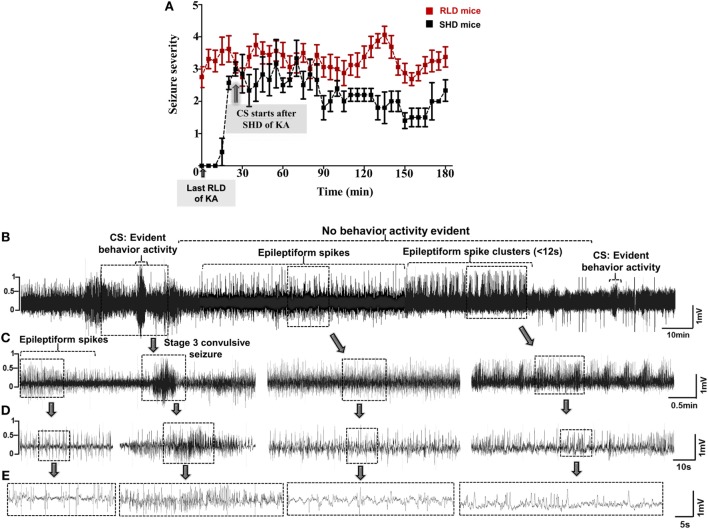
Various etiological factors, such as head injury, chemical intoxication, tumors, and gene mutation, can induce epileptogenesis. In animal models, status epilepticus (SE) triggers epileptogenesis. In humans, convulsive SE for >30 min can be a life-threatening medical emergency. The duration and severity of convulsive SE are highly variable in chemoconvulsant animal models. A continuous video-electroencephalography (EEG) recording, and/or diligent direct observation, facilitates quantification of exact duration of different stages of convulsive seizures (Racine stages 3-5) to determine the severity of SE. A continuous convulsive SE for >30 min usually causes high mortality in some rodents and results in widespread brain damage in the surviving animals, in spite of treating with antiepileptic drugs (AEDs). AEDs control behavioral seizures but not EEG seizures. The severity of initial SE impacts epileptogenesis and cognitive function; therefore, quantitative assessment of behavioral SE and EEG in animal models will help to understand the impact of SE severity on epileptogenesis. There are several excellent reviews on experimental models of seizure/SE/epilepsy. This review focusses on the comparison of induction and characterization of behavioral SE and EEG correlates in mice and rats induced by kainate. We also discuss the advantages of repeated low dose of kainate (i.p. route), which minimizes variability in the initial SE severity between animals and reduces mortality rate. A refined approach to induce SE with kainate also addresses the two of the 3Rs (i.e., refinement and reduction), the guiding principles for ethical and scientific standpoint of animal research.

Keywords: behavioral seizures; electroencephalography seizures; kainate; repeated low dose; status epilepticus.


Figures

Figure 1
Figure 1
(A,B) An example of an electroencephalography (EEG) trace showing different stages of seizures, induced by kainate in C57BL/6J mouse (A) and Sprague Dawley rat (B). The corresponding power spectra, activity level, and real-time behavioral seizures captured from the video-EEG recording are illustrated. (i) EEG trace in the middle shows the changes in electrical activity as the seizure severity progressed from NCS to CS over time. A brief HFT pattern on the EEG, which had no behavioral correlate, preceded the CS. The photographs show different stages of behavioral seizures (iii). Magnified 2-s EEG traces that correspond to each stage of behavioral seizures are shown in the panel (ii). The histograms at the top panel in “i” represent power bands. As the seizure progressed from NCS to CS, the power bands, especially the gamma power increased (shown in green) at stage 3, but decreased during stages 4 and 5. The delta and theta power bands increased during the stage 2 NCS. The gamma power band increased after HFT, peaked at stage 3B, and declined in stages 4 and 5 before returning to the baseline. One interesting finding in the power spectra of the rat kainate model (B), in contrast to the mouse kainate model (A), was an increase in theta and delta power bands during CS. Activity counts represent brisk locomotor activity, which is shown below the EEG trace, increased from stage 3A onward and peaked in stage 3B and 4. Activity counts reduced in stage 5 when the mouse was recumbent or showed generalized rigidity but increased when the mouse displayed jumping behavior. In the rat KA model, the delta power persisted at high levels during pre- and post-CS stage, but the theta, beta, and gamma powers increased during the CS stages. (C–E) The comparison of latency to the onset of CS (C), mortality rate (D), and the time spent by the number of animals (in percentage) in CS stages (E) in C57BL/6J mice, the crossbred mice on C57BL/6J genetic background (C57 × Balb-c) and the Sprague Dawley rats in response to SHD of kainate. (F) Comparison between the total amounts of kainate, given 5 mg/kg at 30 min interval, required to induce CS in telemetry and non-telemetry groups of mice and rats. The animals with telemetry required about ~40% less kainate to reach CS when compared to the non-telemetry group in both rats and mice. Mann–Whitney test, ***p < 0.001, n = 30–40 per group. RLD, repeated low dose; SHD, single high dose; CS, convulsive seizures; NCS, non-convulsive seizures; HFT, high frequency trigger. Adopted and modified from Tse et al. (2) and Puttachary et al. (9).
Figure 1
Figure 1
(A,B) An example of an electroencephalography (EEG) trace showing different stages of seizures, induced by kainate in C57BL/6J mouse (A) and Sprague Dawley rat (B). The corresponding power spectra, activity level, and real-time behavioral seizures captured from the video-EEG recording are illustrated. (i) EEG trace in the middle shows the changes in electrical activity as the seizure severity progressed from NCS to CS over time. A brief HFT pattern on the EEG, which had no behavioral correlate, preceded the CS. The photographs show different stages of behavioral seizures (iii). Magnified 2-s EEG traces that correspond to each stage of behavioral seizures are shown in the panel (ii). The histograms at the top panel in “i” represent power bands. As the seizure progressed from NCS to CS, the power bands, especially the gamma power increased (shown in green) at stage 3, but decreased during stages 4 and 5. The delta and theta power bands increased during the stage 2 NCS. The gamma power band increased after HFT, peaked at stage 3B, and declined in stages 4 and 5 before returning to the baseline. One interesting finding in the power spectra of the rat kainate model (B), in contrast to the mouse kainate model (A), was an increase in theta and delta power bands during CS. Activity counts represent brisk locomotor activity, which is shown below the EEG trace, increased from stage 3A onward and peaked in stage 3B and 4. Activity counts reduced in stage 5 when the mouse was recumbent or showed generalized rigidity but increased when the mouse displayed jumping behavior. In the rat KA model, the delta power persisted at high levels during pre- and post-CS stage, but the theta, beta, and gamma powers increased during the CS stages. (C–E) The comparison of latency to the onset of CS (C), mortality rate (D), and the time spent by the number of animals (in percentage) in CS stages (E) in C57BL/6J mice, the crossbred mice on C57BL/6J genetic background (C57 × Balb-c) and the Sprague Dawley rats in response to SHD of kainate. (F) Comparison between the total amounts of kainate, given 5 mg/kg at 30 min interval, required to induce CS in telemetry and non-telemetry groups of mice and rats. The animals with telemetry required about ~40% less kainate to reach CS when compared to the non-telemetry group in both rats and mice. Mann–Whitney test, ***p < 0.001, n = 30–40 per group. RLD, repeated low dose; SHD, single high dose; CS, convulsive seizures; NCS, non-convulsive seizures; HFT, high frequency trigger. Adopted and modified from Tse et al. (2) and Puttachary et al. (9).
Figure 2
Figure 2
(A) Seizure severity comparison between single high dose (SHD) and repeated low dose (RLD) of KA in mice during SE. Animals in RLD group showed more severe seizures and spent more time in ≥3 stage when compared to the SHD group during the 3 h of SE. Animals in both groups were given 20–30 mg/kg kainate (i.p.) (***p < 0.0001, two-way ANOVA between 1 and 719 degrees of freedom, F = 148.60, n = 30 for each group). Adopted and modified from Tse et al. (2). (B–E) An example of a 30-min EEG trace, during SE, showing inter-ictal activity that comprises of continuous epileptiform spikes and seizure cluster <12 s without any behavioral phenotype. Convulsive seizures (CS) and non-convulsive seizures (NCS) were observed throughout SE, but behavior activity was evident only during CS, i.e., stage ≥3. Expanded electroencephalography (EEG) traces of (B) are shown in panels (C–E).

References

    1. Park KM, Kim SE, Lee BI, Kim HC, Yoon DY, Song HK, et al. Top 100 cited articles on epilepsy and status epilepticus: a bibliometric analysis. J Clin Neurosci (2017) 42:12–8.10.1016/j.jocn.2017.02.065 - DOI - PubMed
    1. Tse K, Puttachary S, Beamer E, Sills GJ, Thippeswamy T. Advantages of repeated low dose against single high dose of Kainate in C57BL/6J mouse model of status epilepticus: behavioral and electroencephalographic studies. PLoS One (2014) 910.1371/journal.pone.0096622 - DOI - PMC - PubMed
    1. Lehmkuhle MJ, Thomson KE, Scheerlinck P, Pouliot W, Greger B, Dudek FE. A simple quantitative method for analyzing electrographic status epilepticus in rats. J Neurophysiol (2009) 101:1660–70.10.1152/jn.91062.2008 - DOI - PMC - PubMed
    1. Racine RJ. Modification of seizure activity by electrical stimulation: II. Motor seizure. Electroencephalogr Clin Neurophysiol (1972) 32:281–94.10.1016/0013-4694(72)90177-0 - DOI - PubMed
    1. Lüttjohann A, Fabene PF, Luijtelaar GV. A revised Racine’s scale for PTZ-induced seizures in rats. Physiol Behav (2009) 98:579–86.10.1016/j.physbeh.2009.09.005 - DOI - PubMed

LinkOut - more resources