. 2018 Jan 23:9:7.
doi: 10.3389/fimmu.2018.00007. eCollection 2018.

Salmonella Immunotherapy Improves the Outcome of CHOP Chemotherapy in Non-Hodgkin Lymphoma-Bearing Mice

Affiliations

Salmonella Immunotherapy Improves the Outcome of CHOP Chemotherapy in Non-Hodgkin Lymphoma-Bearing Mice

Thais Bascuas et al. Front Immunol. .

Abstract

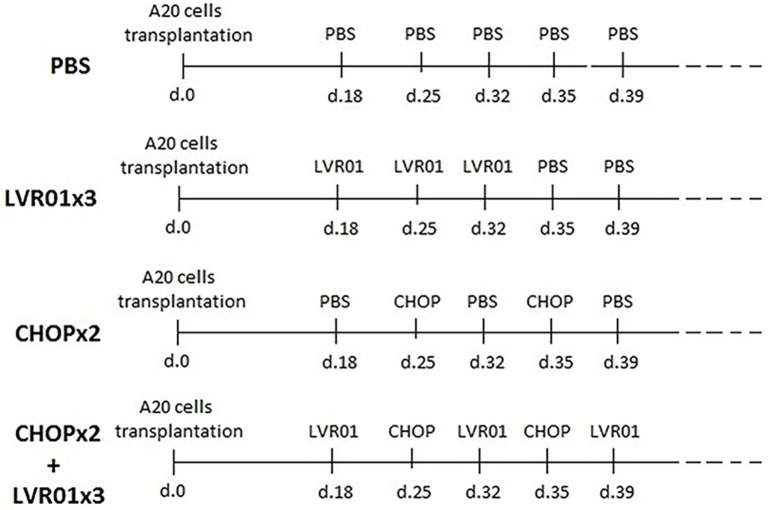
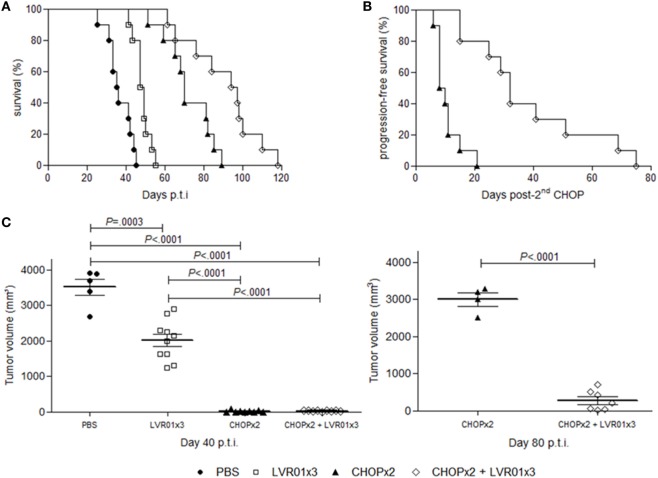
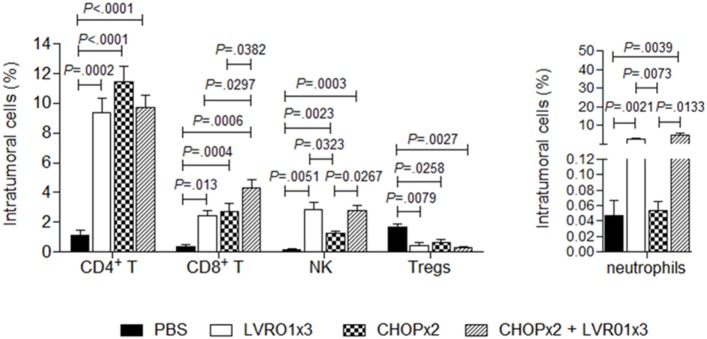
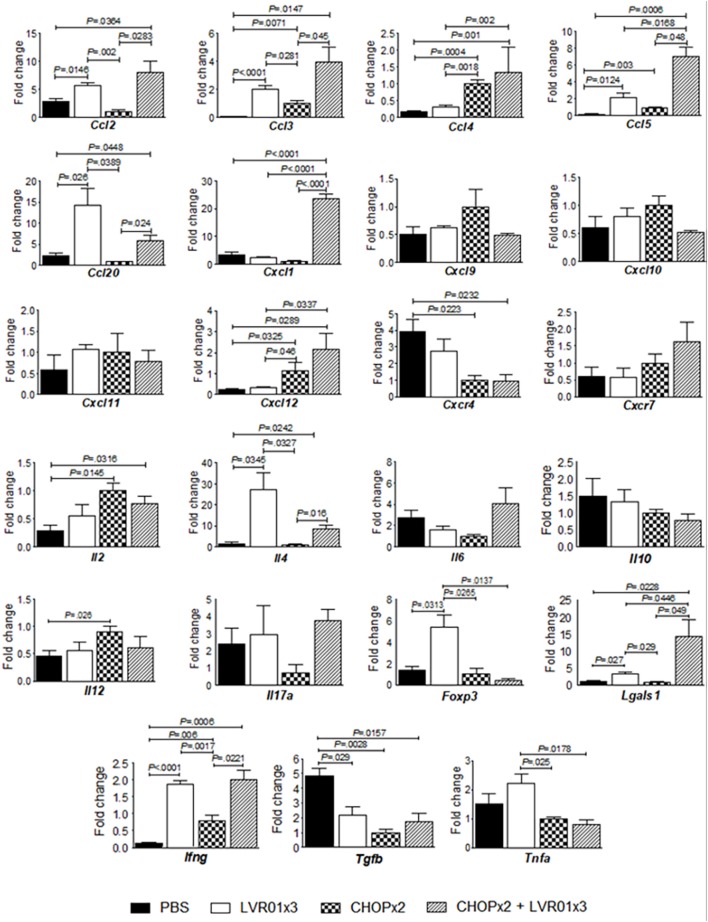
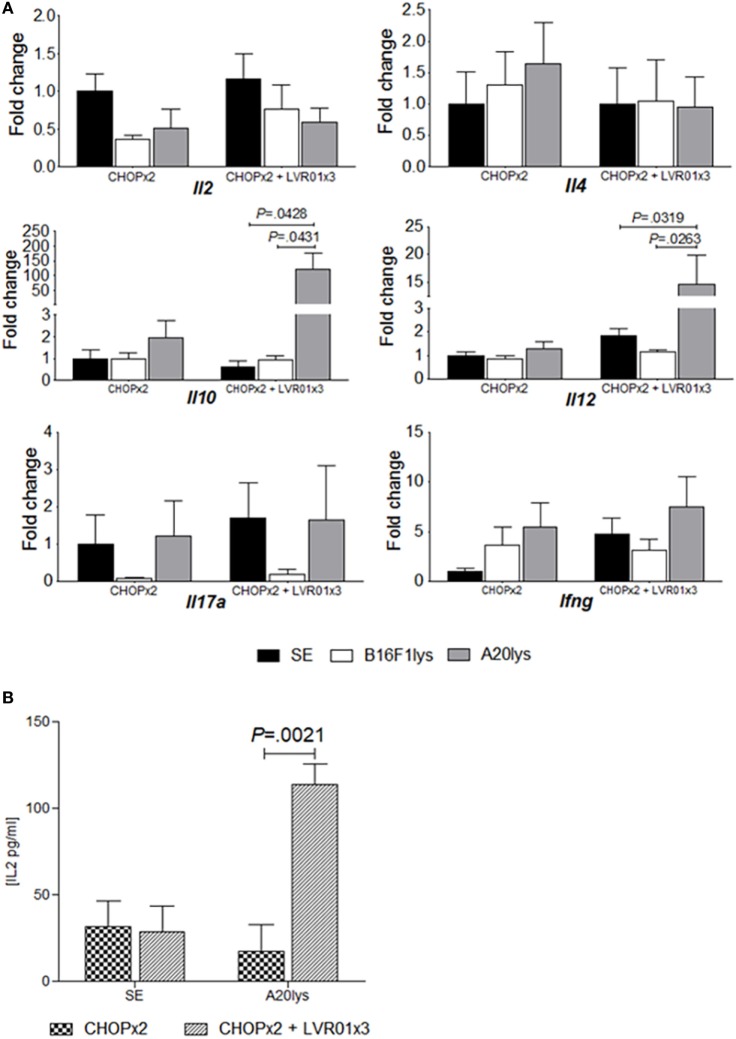
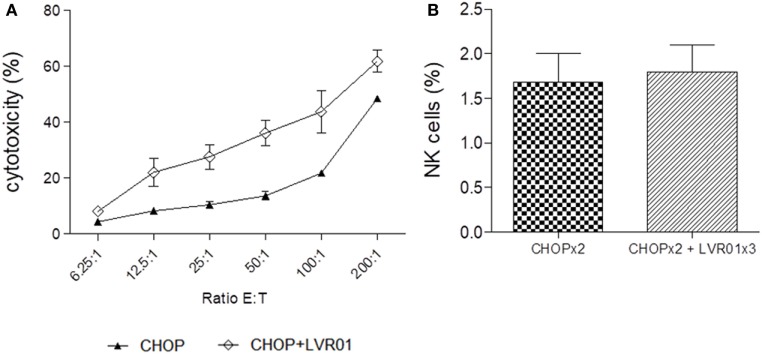
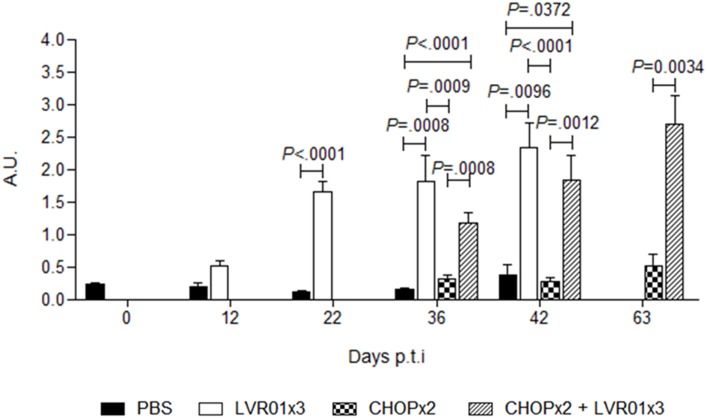
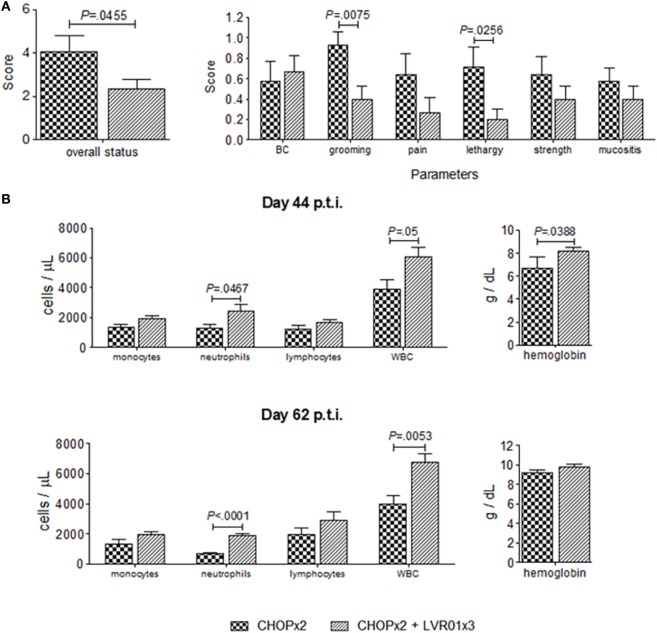
We have previously shown that Salmonella immunotherapy is effective to treat B-cell non-Hodgkin lymphoma (B-NHL) in mice. However, this model involves animals with high tumor burden, whereas in the clinics B-NHL patients are usually treated with chemotherapy (CHOP: cyclophosphamide, doxorubicin, vincristine, and prednisone) as first-line therapy prior to immunotherapy. Recently, we have described a NHL-B preclinical model using CHOP chemotherapy to achieve MRD in immunocompetent animals that closely resemble patients' conditions. In this work, we assessed the efficacy of Salmonella immunotherapy in B-NHL-bearing mice undergoing chemotherapy. Salmonella administration significantly delayed tumor growth and prolonged survival of chemotherapy-treated NHL-bearing animals. Mice receiving the CHOP-Salmonella combined therapy showed increased numbers of tumor-infiltrating leukocytes and a different profile of cytokines and chemokines expressed in the tumor microenvironment. Further, Salmonella immunotherapy in CHOP-treated animals also enhanced NK cells cytotoxic activity as well as induced systemic lymphoma-specific humoral and cellular responses. Chemotherapy treatment profoundly impacted on the general health status of recipient animals, but those receiving Salmonella showed significantly better overall body condition. Altogether, the results clearly demonstrated that Salmonella immunotherapy could be safely used in individuals under CHOP treatment, resulting in a better prognosis. These results give strong support to consider Salmonella as a neoadjuvant therapy in a clinical setting.

Keywords: CHOP; Immunotherapy; Salmonella; chemotherapy; non-Hodgkin lymphoma.


Figures

Figure 1
Figure 1
Inoculation scheme. For tumor implantation, 1 × 106 A20 cells were inoculated s.c. at day 0. In two cycles of CHOP (CHOPx2) and CHOPx2 + LVR01x3 groups, chemotherapy cycles were administrated i.p. at days 25 and 35 p.t.i. In LVR01x3 and CHOPx2 + LVR01x3 groups, 1 × 106 CFU of the strain was administrated by i.t. injection on days 18, 25, and 32, and 18, 32, and 39 p.t.i., respectively.
Figure 2
Figure 2
Survival curves and tumor growth. (A) Kaplan–Meier plot of mice survival post-tumor challenge. Overall survival was followed up for 120 days (n = 10). Significant differences were observed between all groups (log-rank, P < 0.0001). (B) Progression-free survival post-second CHOP. Significant differences were observed between groups (log-rank, P < 0.0001). (C) Tumor volume (mm3) at day 40 p.t.i. for all groups and 80 p.t.i. for two cycles of CHOP (CHOPx2) and CHOPx2 + LVR01x3 groups. Each dot represents one individual animal. Mean and SD are also depicted. At day 40 p.t.i., significant differences were observed between all groups (P < 0.0001, analysis of variance), except groups treated with chemotherapy, for which significant differences are observed at day 80 p.t.i. (P < 0.0001, Student’s t-test).
Figure 3
Figure 3
Tumor-infiltrating cells. Mice from PBS, LVR01x3, two cycles of CHOP (CHOPx2), and CHOPx2 + LVR01x3 groups were sacrificed at day 45 p.t.i., and tumors were removed to study tumor-infiltrating cell populations. Percentage of CD4+ T lymphocytes (CD3+ CD4+ cells), CD8+ T lymphocytes (CD3+ CD8+ cells), NK cells (CD3 CD49b+ cells), regulatory T cells (Tregs) (CD3+ CD4+ CD25+ FoxP3+ cells) and neutrophils (Gr1+ CD11b+ cells) were determined by flow cytometry. Results are shown as mean ± SD (n = 5). Significant differences are shown with P value (analysis of variance).
Figure 4
Figure 4
Cytokines/chemokines gene expression levels in the tumor microenvironment. Mice from PBS, LVR01x3, two cycles of CHOP (CHOPx2), and CHOPx2 + LVR01x3 groups were sacrificed at day 45 p.t.i., and tumors were removed to assess the expression of cytokine and chemokines genes by quantitative RT-PCR on total tumor RNA. Gene mRNA values were normalized to that of B2m mRNA, and the results were expressed relative to mRNA levels in the CHOPx2 group for each day (fold change). Results are shown as the mean ± SD (n = 5). Significant differences are shown with P value (analysis of variance).
Figure 5
Figure 5
Antigen-specific cytokine responses in stimulated splenocytes. (A) Cytokines gene expression levels in stimulated splenocytes. Mice from two cycles of CHOP (CHOPx2) and CHOPx2 + LVR01x3 groups were sacrificed at day 60 p.t.i., and spleens were removed to study the expression of cytokine genes by quantitative RT-PCR in stimulated splenocytes. Gene mRNA values were normalized to that of B2m mRNA, and the results were expressed relative to mRNA levels in non-stimulated condition from CHOPx2 group (fold change). Results are shown as the mean ± SD (n = 5). A significant increase in Il10 and Il12 gene expression for antigen-specific stimulated splenocytes (A20lys) was observed. Significant differences are shown with P value [analysis of variance (ANOVA)]. (B) Cytokines concentration in the supernatant of stimulated splenocytes at day 70 p.t.i. IL-2 concentration values (picograms per milliliter) are shown as the mean ± SD (n = 5) for non-stimulated and stimulated with A20lys. Significant differences are observed between groups when splenocytes were stimulated with tumor-specific antigen (A20lys) (P = 0.0021, ANOVA).
Figure 6
Figure 6
Cytotoxicity. (A) NK cell-mediated cytotoxicity percentage at different ratios E:T for two cycles of CHOP (CHOPx2) and CHOPx2 + LVR01x3 is shown. Splenocytes from mice sacrificed at day 63 p.t.i. were used as effector cells and YAC-1 as target cells. Significant differences in all ratios were observed between both groups (P < 0.0001, Student’s t-test). Results are shown as the mean ± SD (n = 5). (B) Spleen NK cells percentage of CHOPx2 and CHOPx2 + LVR01x3 groups are shown. No significant differences were observed between groups.
Figure 7
Figure 7
Humoral responses against A20 lymphoma cells. Anti-A20 lymphoma IgG levels were determined in serum by ELISA at days 12, 22, 36, and 42 p.t.i. for PBS and LVR01x3 groups, and at days 36, 42, and 63 for two cycles of CHOP (CHOPx2) and CHOPx2 + LVR01x3 groups. IgG basal levels were determined in naïve mice at day 0 p.t.i. Data are shown as mean of arbitrary units (A.U.) ± SD (n = 5). At days 36 and 42 p.t.i. LVR01x3 and CHOPx2 + LVR01x3 developed a significantly higher anti-A20 IgG antibody response compared with PBS and CHOPx2 groups; at day 63 p.t.i. significant differences between CHOPx2 and CHOPx2 + LVR01x3 groups still remained. Significant differences are shown with P value (analysis of variance, Student’s t-test).
Figure 8
Figure 8
Overall health status of animals undergoing chemotherapy with or without Salmonella treatment. (A) Overall status and clinical parameters used to determine it at day 44 p.t.i. for two cycles of CHOP (CHOPx2) and CHOPx2 + LVR01x3 groups. Data are shown as the mean ± SD (n = 10). (B) Blood cells count and hemoglobin concentration ± SD (n = 5), obtained from hemograms performed at days 44 and 62 p.t.i. Significant differences are shown with P value (Student’s t-test).

References

    1. Zelenetz AD, Gordon LI, Wierda WG, Abramson JS, Advani RH, Andreadis CB, et al. Non-Hodgkin’s lymphomas. NCCN Clinical Practice Guidelines in Oncology (NCCN Guidelines), Version 4. National Comprehensive Cancer Network; (2014). Available from: https://www.nccn.org/about/nhl.pdf - PubMed
    1. Briones J. Emerging therapies for B-cell non-Hodgkin lymphoma. Expert Rev Anticancer Ther (2009) 9:1305–16.10.1586/era.09.86 - DOI - PubMed
    1. Maxwell SA, Mousavi-Fard S. Non-Hodgkin’s B-cell lymphoma: advances in molecular strategies targeting drug resistance. Exp Biol Med (2013) 238:971–90.10.1177/1535370213498985 - DOI - PubMed
    1. Solimando AG, Ribatti D, Vacca A, Einsele H. Targeting B-cell non Hodgkin lymphoma: new and old tricks. Leuk Res (2016) 42:1–12.10.1016/j.leukres.2015.11.001 - DOI - PubMed
    1. Chabalgoity JA, Dougan G, Mastroeni P, Aspinall RJ. Live bacteria as the basis for immunotherapies against cancer. Expert Rev Vaccines (2002) 1:495–505.10.1586/14760584.1.4.495 - DOI - PubMed

Publication types

MeSH terms

Supplementary concepts