. 2018 Jan 31;5(1):171113.
doi: 10.1098/rsos.171113. eCollection 2018 Jan.

Silver nanoparticles as a medical device in healthcare settings: a five-step approach for candidate screening of coating agents

Affiliations

Silver nanoparticles as a medical device in healthcare settings: a five-step approach for candidate screening of coating agents

Valentina Marassi et al. R Soc Open Sci. .

Abstract

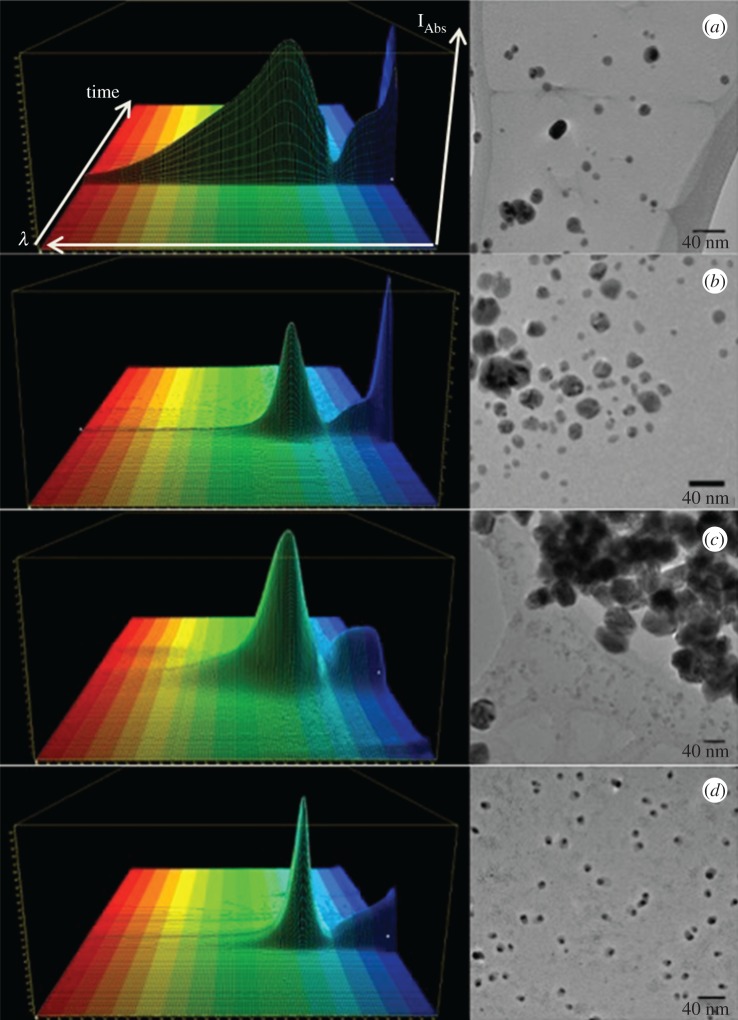
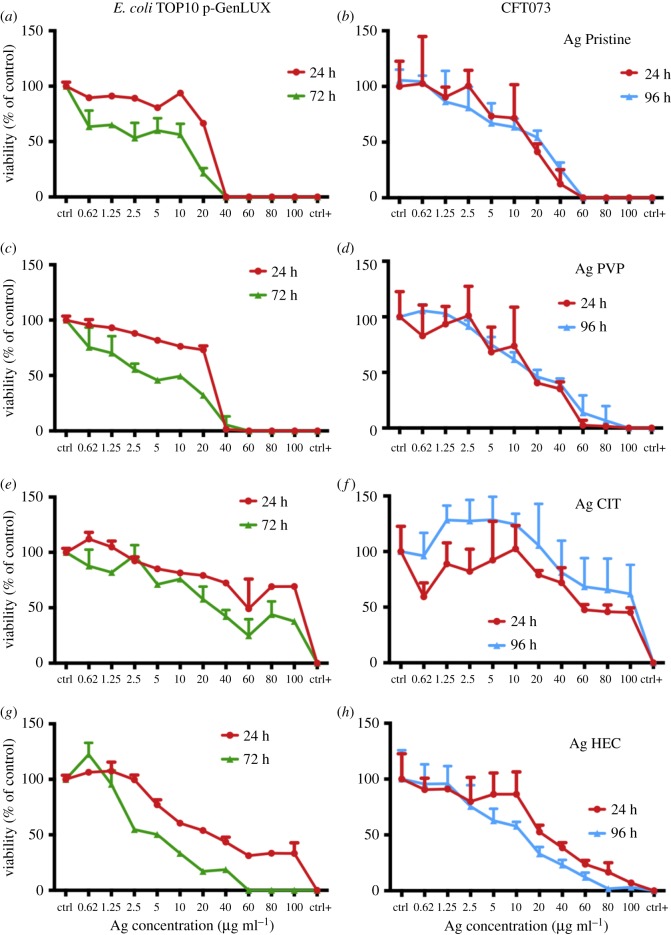
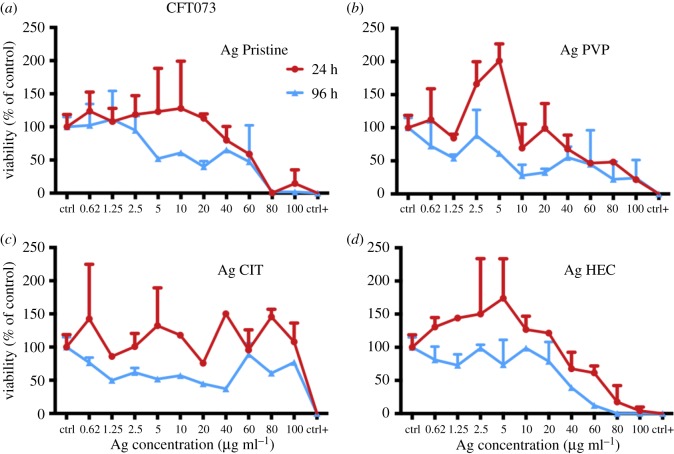
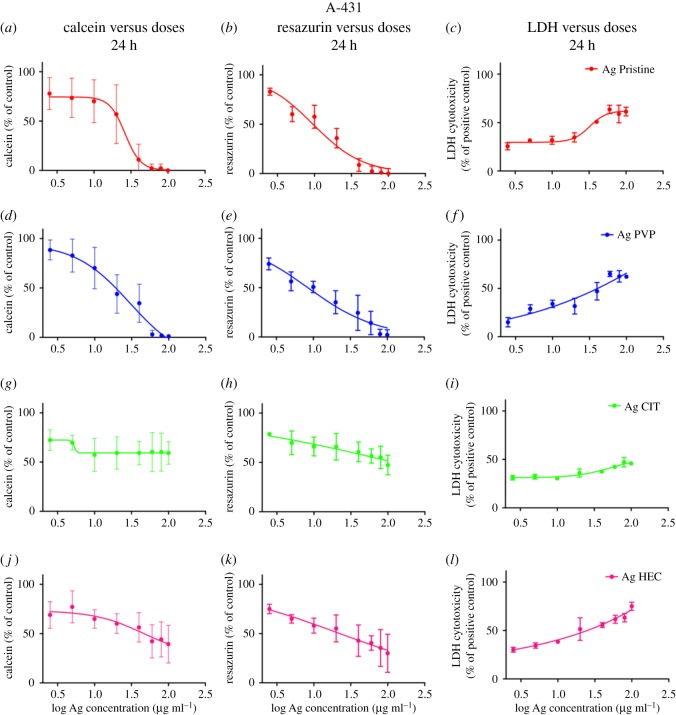
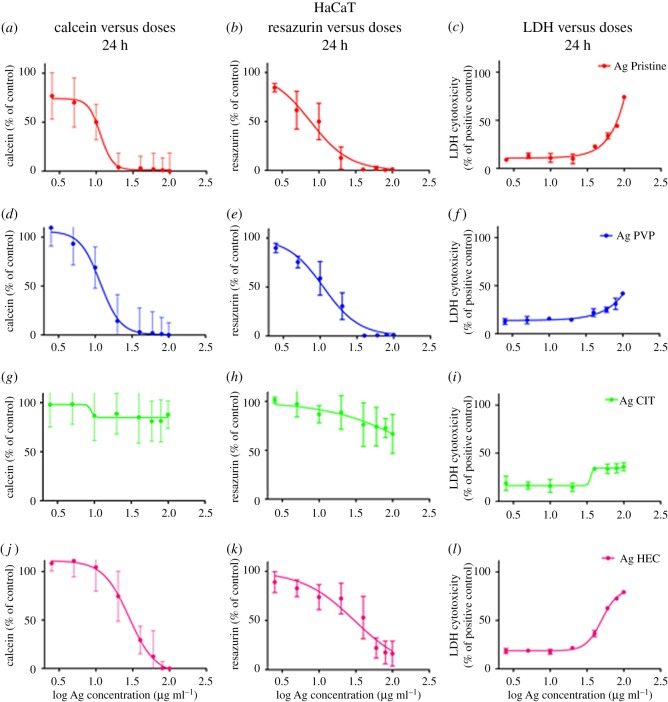
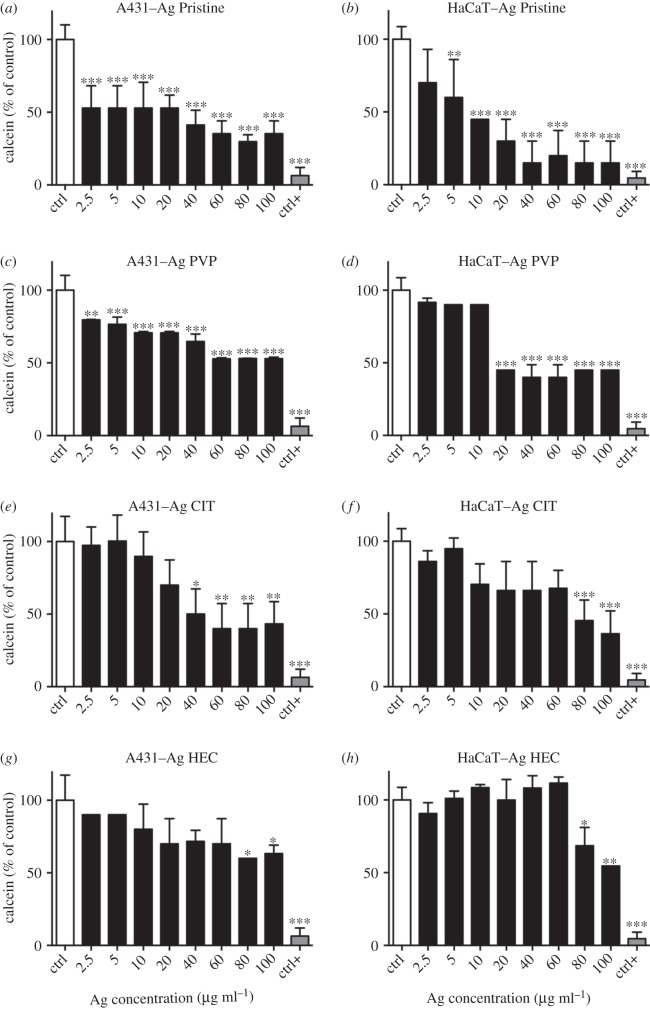
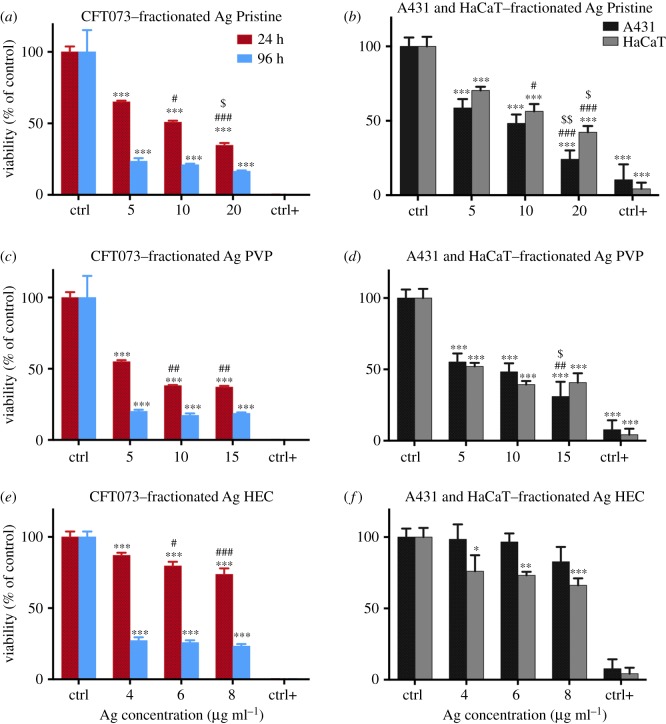
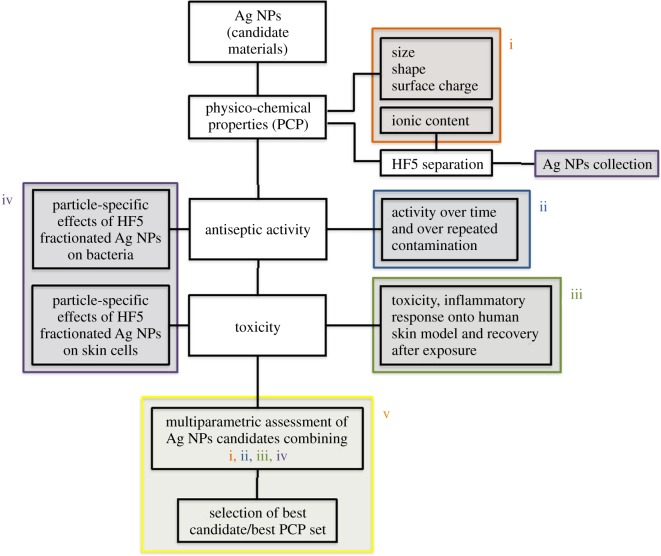
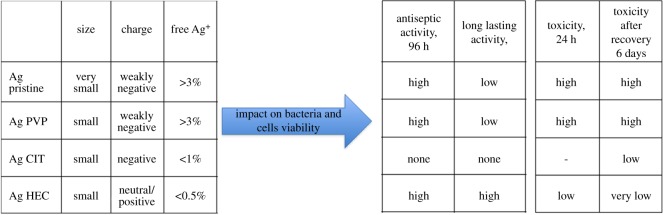
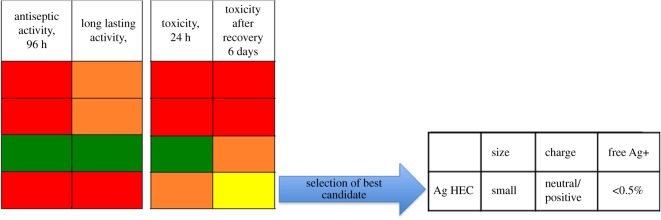
Silver nanoparticle-based antimicrobials can promote a long lasting bactericidal effect without detrimental toxic side effects. However, there is not a clear and complete protocol to define and relate the properties of the particles (size, shape, surface charge, ionic content) with their specific activity. In this paper, we propose an effective multi-step approach for the identification of a 'purpose-specific active applicability window' to maximize the antimicrobial activity of medical devices containing silver nanoparticles (Ag NPs) (such as surface coaters), minimizing any consequent risk for human health (safety by design strategy). The antimicrobial activity and the cellular toxicity of four types of Ag NPs, differing in their coating composition and concentration have been quantified. Through the implementation of flow-field flow fractionation, Ag NPs have been characterized in terms of metal release, size and shape. The particles are fractionated in the process while being left unmodified, allowing for the identification of biological particle-specific contribution. Toxicity and inflammatory response in vitro have been assessed on human skin models, while antimicrobial activity has been monitored with both non-pathogenic and pathogenic Escherichia coli. The main benefit associated with such approach is the comprehensive assessment of the maximal effectiveness of candidate nanomaterials, while simultaneously indexing their properties against their safety.

Keywords: antimicrobials; cellular toxicity; coating agents; healthcare; hollow-fibre flow-field flow fractionation; silver nanoparticles.


Conflict of interest statement

The authors declare that they have no competing interests.

Figures

Figure 1.
Figure 1.
3D absorption spectra acquired in flow during HF5 characterization and NPs collection and representative TEM images of Ag Pristine (a), Ag PVP (b), AG CIT (c) and Ag HEC (d). Scale bar of TEM images represents 40 nm. For 3D spectra, horizontal axis represents wavelength (nm), depth axis represents time (min), height axis represent absorption intensity (mAU). Ag Pristine: min: 330 nm, max 450 nm. Ag PVP: min 325 nm, max 425 nm. Ag CIT: min 327 nm, max 420 nm. Ag HEC: min 320, max 410 nm.
Figure 2.
Figure 2.
Viability of bacterial strains E. coli Top10 and CFT073 after 24 h (red line) and 72 or 96 h (green or blue line). Bacteria were cultured at 37°C with shaking at 200 r.p.m. in L broth to mid-logarithmic phase. Of note, 50 µl aliquots of mid-logarithmic cultures (equivalent to approx. 106 cells) were incubated with an equal volume of Ag NPs (from 0.62 to 100 µg ml−1 final concentration) in 96-well plates. Milli-Q water was used as a negative control and ethanol as a positive control. After 24, 72 and 96 h luminescence was read and the RLUs of untreated samples were normalized to 100% (see Methods). (a,c,e,g) Escherichia coli TOP10; (b,d,f,h) E. coli CFT073. Data are means of three independent determinations ± s.d. Ag Pristine (a,b) Ag PVP (c,d) Ag CIT (e,f) and Ag HEC (g,h).
Figure 3.
Figure 3.
Viability of bacterial strain CFT073 after 24 h (red line) and 96 h (blue line) against reused Ag NPs. Bacteria were cultured at 37°C with shaking at 200 r.p.m. in L broth to mid-logarithmic phase. Of note, 50 µl aliquots of mid-logarithmic cultures (equivalent to approx. 106 cells) were incubated with an equal volume of water in the 96-well plates containing the previously employed nanoparticles at different concentrations (from 0.62 to 100 µg ml−1 final concentration). The same well employed for the previous experiment was used as a negative control while ethanol was added instead of water as a positive control. After 24 and 96 h luminescence was read and the RLUs of untreated samples were normalized to 100% (see Material and methods). (ad): CFT073. Data are means of three independent determinations ± s.d. Ag Pristine (a), Ag PVP (b), Ag CIT (c) and Ag HEC (d).
Figure 4.
Figure 4.
Cytotoxicity of Ag NPs towards A431 cell line. Cells, grown for 24 h in complete growth medium, were treated with different concentrations of Ag NPs or with ethanol (80%), used as a positive control. After 24 h of exposure cell viability was assessed using calcein assay, resazurin assay or LDH assay (see Material and methods). (a,d,g,j) Calcein assay; (b,e,h,k) resazurin assay; (c,f,i,l) LDH assay. Data are means of three independent determinations ± s.d. Ag Pristine (ac), Ag PVP (df), Ag CIT (gi) and Ag HEC (jl).
Figure 5.
Figure 5.
Cytotoxicity of Ag NPs towards HaCaT cells. Cells, grown for 24 h in complete growth medium, were treated with different concentrations of Ag NPs or with ethanol (80%), used as a positive control. After 24 h of exposure cell viability was assessed using calcein assay, or resazurin assay, or LDH assay (see Material and methods). (a,d,g,j) Calcein assay; (b,e,h,k) resazurin assay; (c,f,i,l) LDH assay. Data are means of three independent determinations ± s.d. Ag Pristine (ac), Ag PVP (df), Ag CIT (gi) and Ag HEC (jl).
Figure 6.
Figure 6.
Recovery A431 and HaCaT cells after exposure to Ag NPs. Cells, grown for 24 h in complete growth medium, were treated with different concentrations of Ag NPs or with ethanol (80%), used as a positive control. After 24 h of exposure cell medium was replaced with full growth medium and cells were cultured for six additional days. On the seventh day viability was assessed using calcein assay. (a,c,e,g) A431; (b,d,f,h) HaCaT. Data are means of three independent determinations ± s.d. *p < 0.05, **p < 0.01 and ***p < 0.001 versus untreated, control cells. Ag Pristine (a,b), Ag PVP (c,d), Ag CIT (e,f) and Ag HEC (g,h).
Figure 7.
Figure 7.
Viability of bacterial strain CFT073 after 24 and 96 h (a,c,e) and skin cells (b,d,f) after 24 h when treated with fractionated Ag NPs. (ae) Bacteria were cultured at 37°C with shaking at 200 r.p.m. in L broth to mid-logarithmic phase. Of note, 50 µl aliquots of mid-logarithmic cultures (equivalent to approx. 106 cells) were incubated with an equal volume of Ag NPs (5, 10, 20 µg ml−1 for Ag Pristine, 5, 10, 15 µg ml−1 for Ag PVP and 4, 6, 8 µg ml−1 for Ag HEC) in 96-well plates. Milli-Q water was used as a negative control and ethanol as a positive control. After 24 and 96 h luminescence was read and the RLUs of untreated samples were normalized to 100% (see Material and methods). (a,c,e): CFT073. Data are means of three independent determinations ± s.d. *p < 0.05, **p < 0.01 and ***p < 0.001 versus untreated, control bacterial cells. # p < 0.05 and ## p < 0.01 versus 5 µg ml−1 Ag Pristine; ; $ p < 0.05 versus 10 µg ml−1 Ag Pristine;: ## p < 0.01 versus 5 µg ml−1 Ag PVP; : # p < 0.05 and ### p < 0.001 versus 4 µg ml−1 Ag HEC; versus 4 µg ml−1. (b,d,f) Cells, A431 and HaCaT, grown in complete growth medium for 24 h, were treated with different concentrations of Ag NPs (5, 10, 20 µg ml−1 for Ag Pristine, 5, 10, 15 µg ml−1 for Ag PVP and 4, 6, 8 µg ml−1 for Ag HEC) or with ethanol (80%) used as a positive control. After 24 h of exposure cell viability was assessed using calcein assay. Data are means of three independent determinations ± s.d. *p < 0.05, **p < 0.01 and ***p < 0.001 versus untreated, control bacterial cells. # p < 0.05 and ### p < 0.001 versus 5 µg ml−1 Ag Pristine; $ p < 0.05 and $$ p < 0.01 versus 10 µg ml−1 Ag Pristine; ## p < 0.01 versus 5 µg ml−1 Ag PVP; $ p < 0.05 versus 10 µg ml−1 Ag PVP. Ag Pristine (a,b), Ag PVP (c,d) and Ag HEC (e,f).
Figure 8.
Figure 8.
Schematic representation of the multi-step approach used. (i) Characterization of the particles in suspension to match in vitro tests, (ii) testing of the nanoparticles to quantify their antibacterial response (acute and in a life-cycle scenario), (iii) in vitro test to assess toxic response upon contact (skin model), (iv) testing of collected, purified nanoparticle to assess particle-specific activity, and (v) correlation of relevant properties and nanoparticles activity (antiseptic/toxic and particle-specific).
Figure 9.
Figure 9.
Summary of physico-chemical properties of the four Ag NPs preparations and their impact on skin toxicity and antiseptic activity.
Figure 10.
Figure 10.
Qualitative representation of positive outcomes and correlated physico-chemical properties of the four candidates. Colours refer to toxicity towards human skin cells/bacteria. Red, high toxicity; orange, low toxicity; yellow, very low toxicity and green, non-toxic.

References

    1. Marambio-Jones C, Hoek EMV. 2010. A review of the antibacterial effects of silver nanomaterials and potential implications for human health and the environment. J. Nanopart. Res. 12, 1531–1551. (doi:10.1007/s11051-010-9900-y) - DOI
    1. Haider A, Kang I-K. 2015. Preparation of silver nanoparticles and their industrial and biomedical applications: a comprehensive review. Adv. Mater. Sci. Eng. 2015, 1–16. (doi:10.1155/2015/165257) - DOI
    1. 2015 Grand View Research, Report, Silver Nanoparticles Market By Application (Electronics & electrical, healthcare, food & beverages, textiles) and segment forecasts to 2022, May 2015.
    1. Bos PMJ, et al. 2015. The MARINA risk assessment strategy: a flexible strategy for efficient information collection and risk assessment of nanomaterials. Int. J. Environ. Res. Public Health. 12, 15 007–15 021. (doi:10.3390/ijerph121214961) - DOI - PMC - PubMed
    1. ECHA. 2014 Regulatory challenges in the risk assessment of nanomaterials. Helsinki, Finland: ECHA.

LinkOut - more resources