

doi: 10.1039/c8cc00167g.
Real-time monitoring of the aggregation of Alzheimer's amyloid-β via1H magic angle spinning NMR spectroscopy
Affiliations
- PMID: 29411841
- PMCID: PMC5820189
- DOI: 10.1039/c8cc00167g
Item in Clipboard
Real-time monitoring of the aggregation of Alzheimer's amyloid-β via1H magic angle spinning NMR spectroscopy
Chem Commun (Camb).
.
Abstract
Proton magic-angle-spinning NMR used for real-time analysis of amyloid aggregation reveals that mechanical rotation of Aβ1-40 monomers increases the rate of formation of aggregates, and that the increasing lag-time with peptide concentration suggests the formation of growth-incompetent species. EGCG's ability to shift off-pathway aggregation is also demonstrated.
Conflict of interest statement
The authors declare no competing financial interests.
Figures
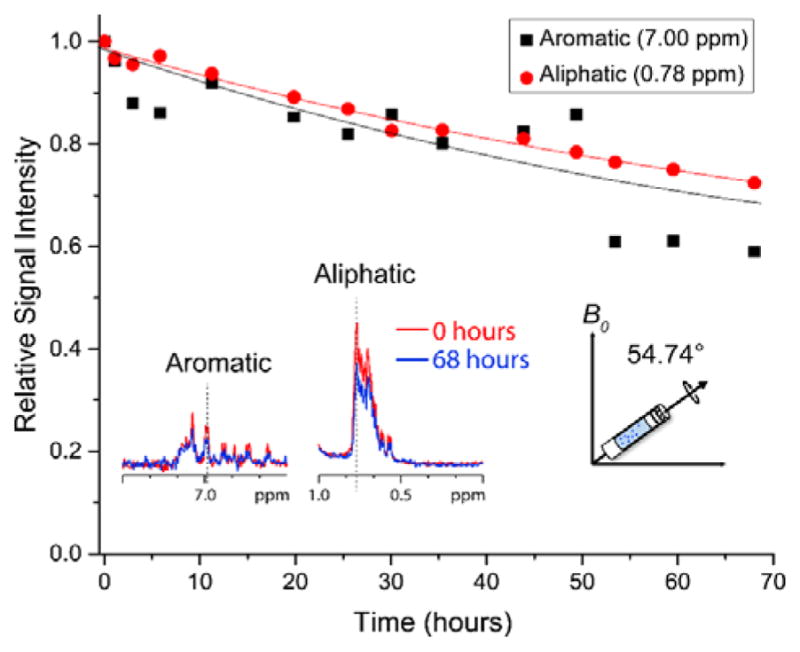
Real-time monitoring of Aβ1–40 monomer depletion under MAS. Experimentally measured 1H NMR signal intensities for selected aliphatic and aromatic resonances of freshly prepared 50 μM Aβ40 as a function of time under 5 kHz MAS and 298 K. Additional experimental results showing the decay of monomer peaks are shown in Figure S4. Time=0 was the starting time of NMR data acquisition, which is <10 minutes from the fresh sample preparation.
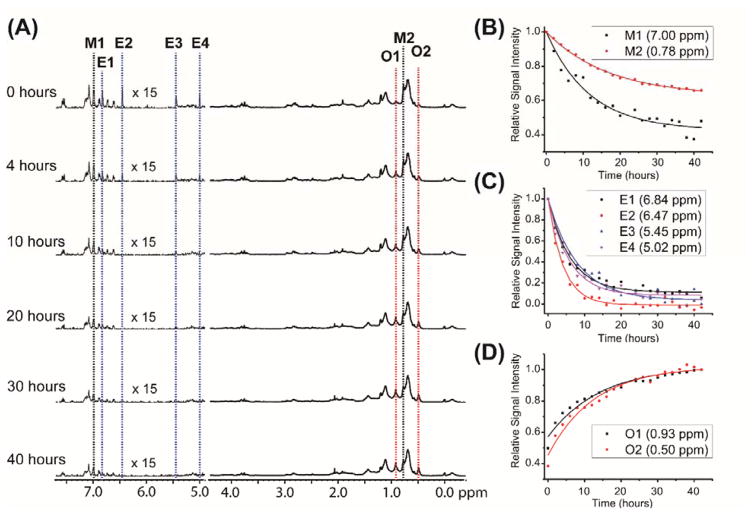
(A) 1D 1H NMR spectra of 50 μM Aβ1–40 in presence of 50 μM EGCG obtained at the indicated times under 5 kHz MAS and 298 K. (B, C, D) Change in 1H signal intensities for selected aliphatic and aromatic resonances of Aβ1–40 (B), EGCG (C), and the newly appeared peaks (indicated as O1 and O2) (D). Additional experimental results on the changes in peak intensities are shown in Figures S6 and S7.
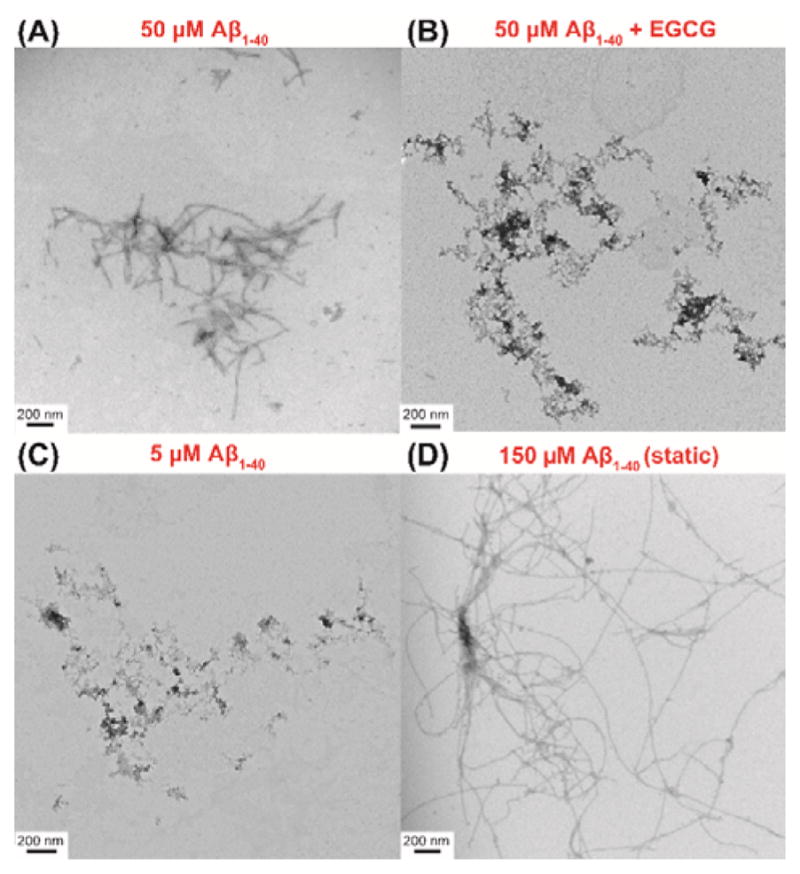
TEM images of Aβ1–40 aggregates. TEM images of 50 μM Aβ1–40 after spinning for 68 hours in the absence (A) and presence of 50 μM EGCG (1:1 Aβ1–40:EGCG molar ratio) after spinning for 42 hours (B). TEM images of 5 μM Aβ1–40 after spinning for 80 hours (C) and 150 μM Aβ1–40 under static condition after 48 hours (D).
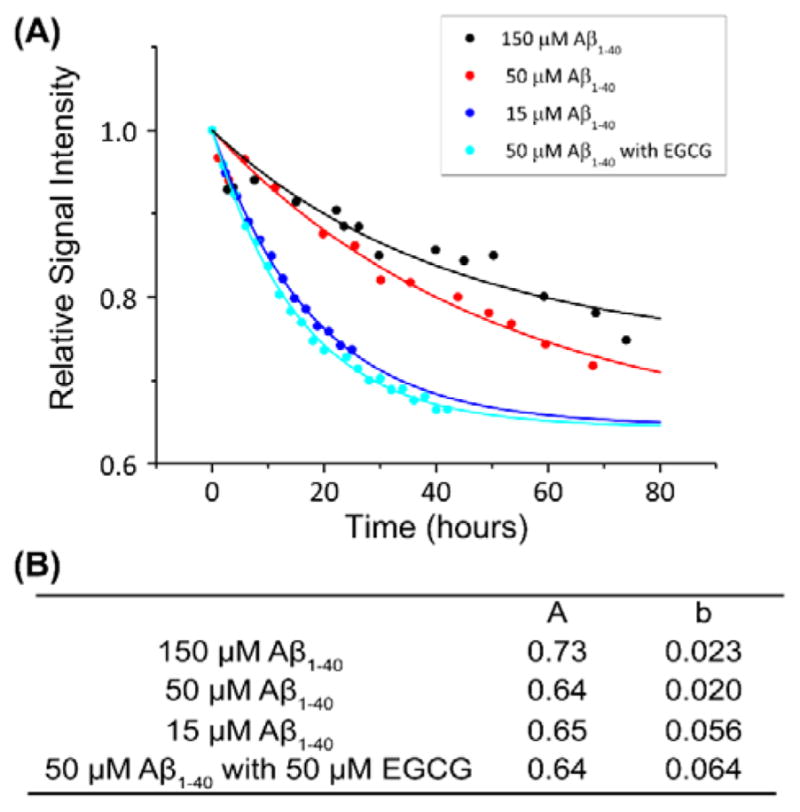
Concentration dependent monomer decay for Aβ40. (A) Aggregation kinetics of Aβ1–40 measured from 1H NMR signal intensity of methyl resonance (0.78 ppm) under 5 kHz MAS for various peptide concentrations. The monomer decay curve was fitted using the equation, y=(1−A)*exp(−b*x)+A. The parameters used for the monomer decay curves are given in (B). Additional experimental results on the changes in the peak intensities are shown in Figures S8 and S9 and Table S1.
References
-
- Jakob-Roetne R, Jacobsen H. Angew Chem Int Ed. 2009;48:3030. - PubMed
-
- Hardy J, Selkoe DJ. Science. 2002;297:353. - PubMed
-
- Stumvoll M, Goldstein BJ, van Haeften TW. The Lancet. 2005;365:1333. - PubMed
-
- Spillantini MG, Schmidt ML, Lee VM-Y, Trojanowski JQ, Jakes R, Goedert M. Nature. 1997;388:839. - PubMed
-
- Chiti F, Dobson CM. Annu Rev Biochem. 2006;75:333. - PubMed
Grants and funding
LinkOut - more resources
Full Text Sources
Other Literature Sources