. 2018 Feb 7:7:e31977.
doi: 10.7554/eLife.31977.

Integration of human pancreatic islet genomic data refines regulatory mechanisms at Type 2 Diabetes susceptibility loci

Affiliations

Integration of human pancreatic islet genomic data refines regulatory mechanisms at Type 2 Diabetes susceptibility loci

Matthias Thurner et al. Elife. .

Abstract

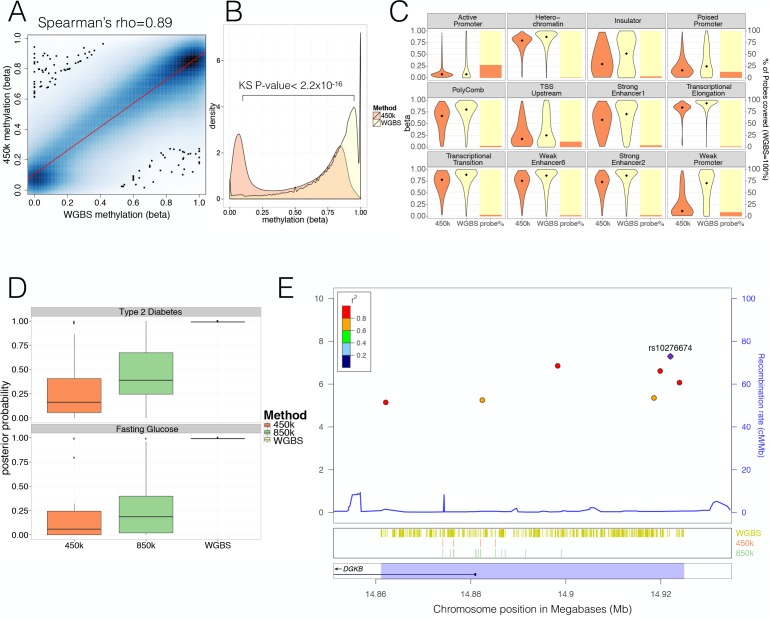
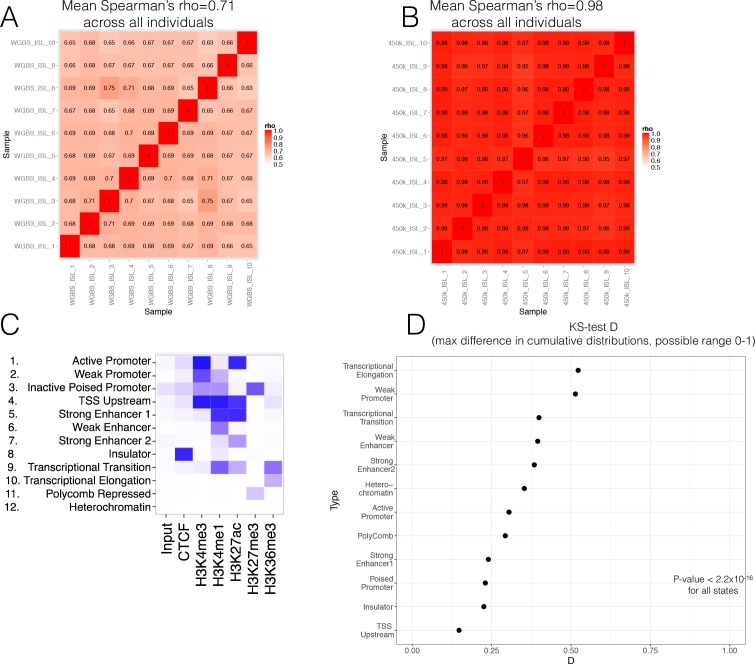
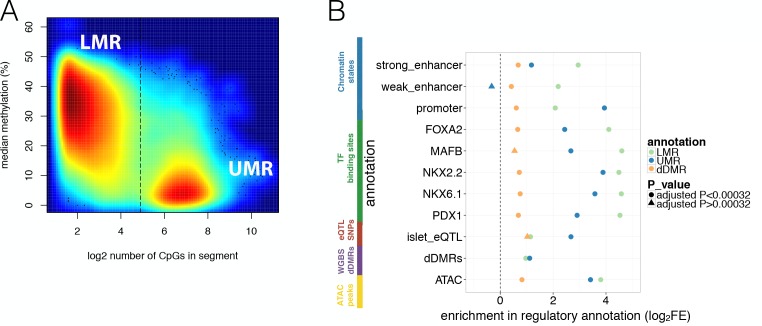
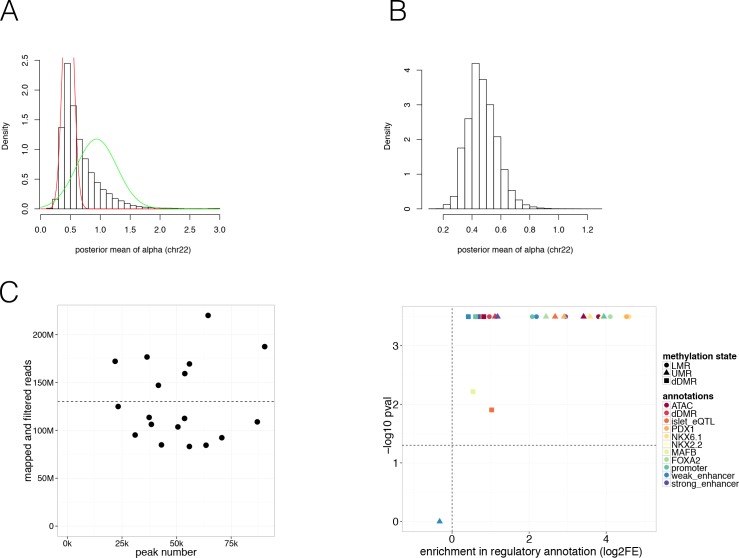
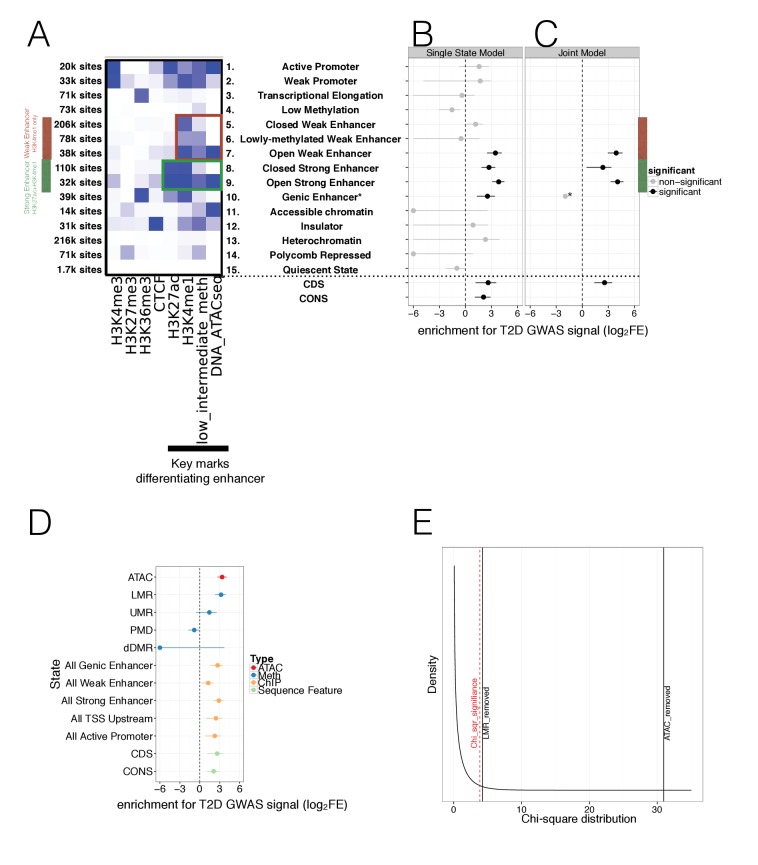
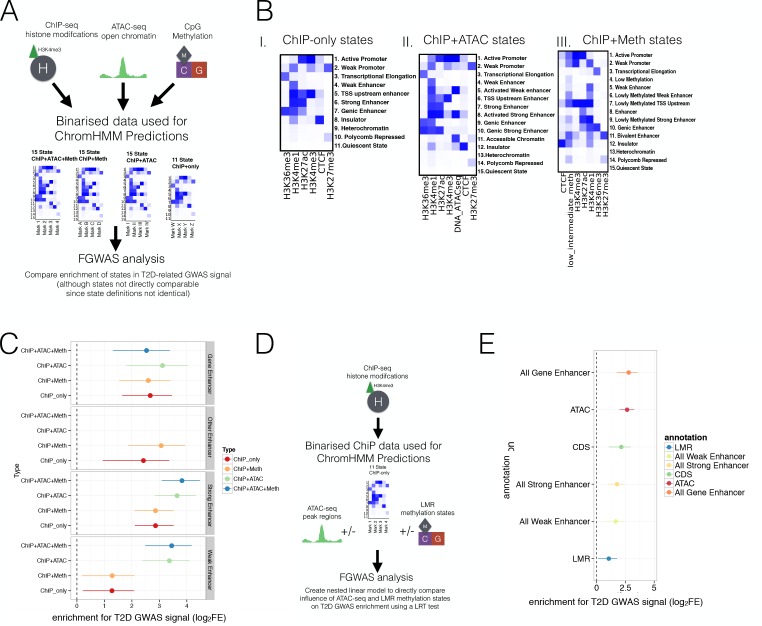
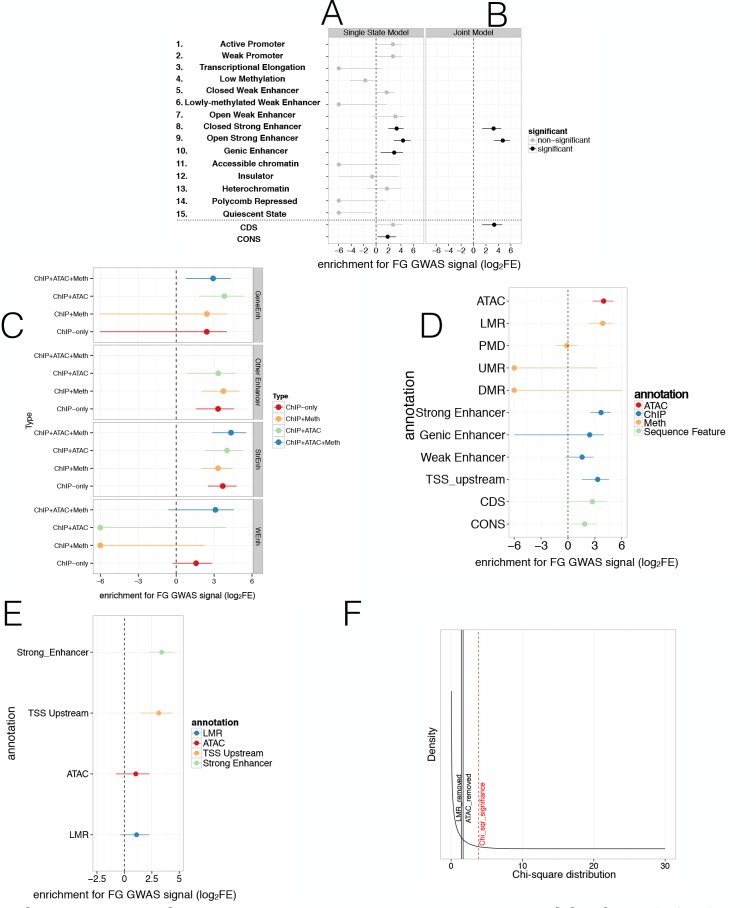
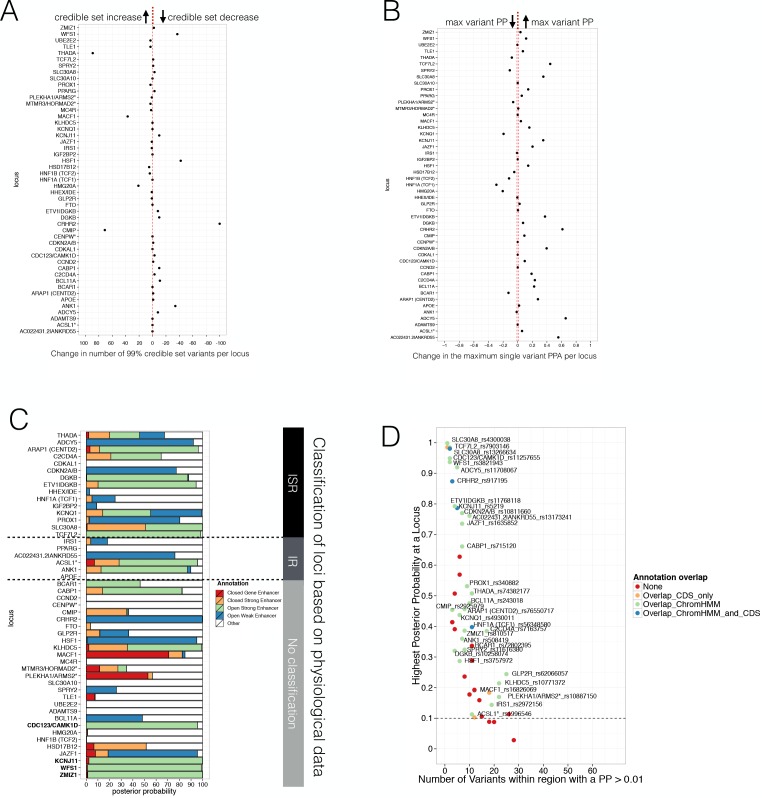
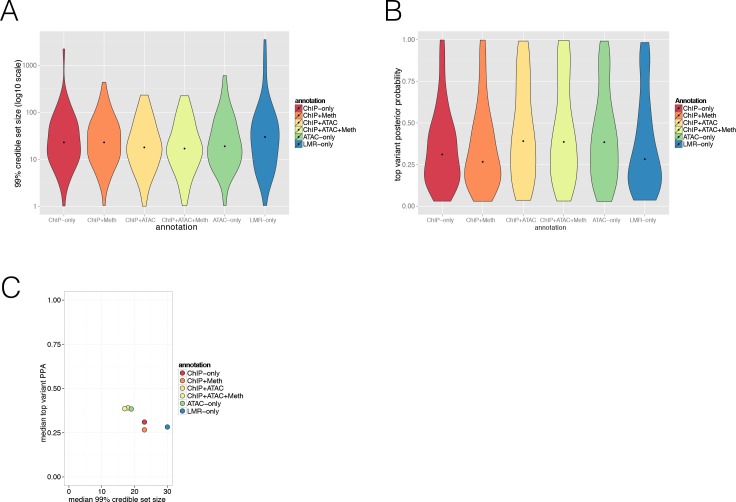
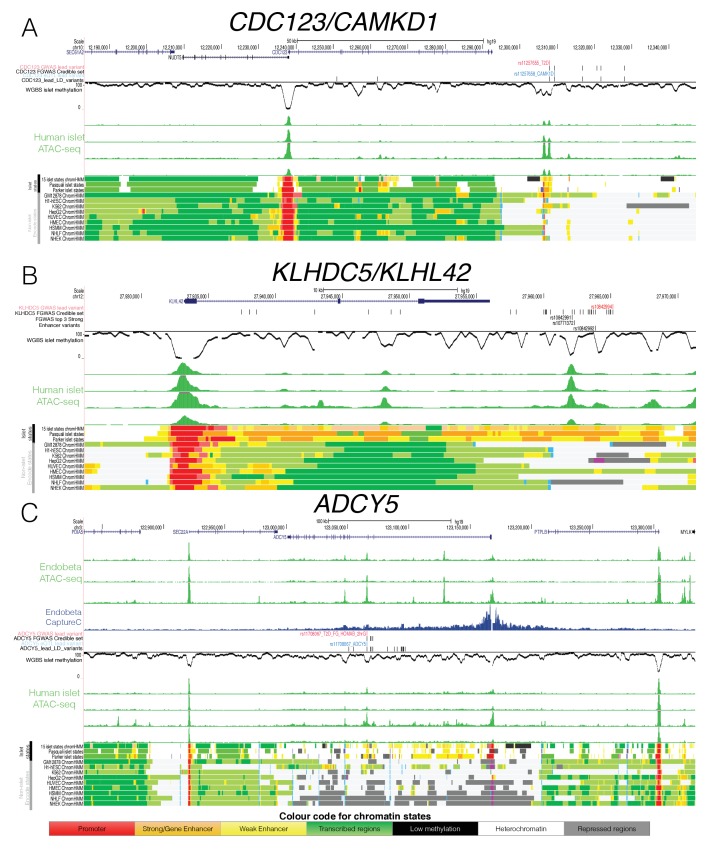
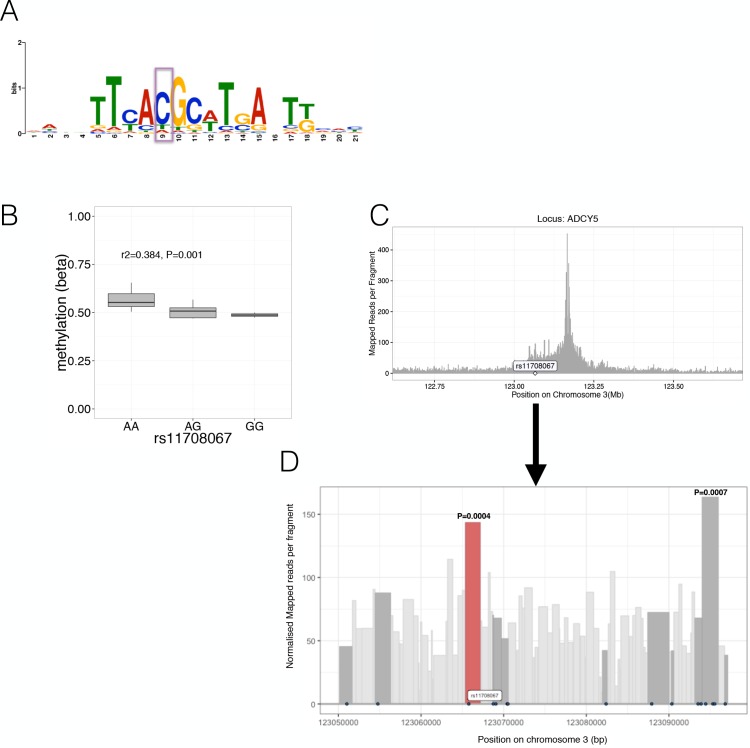
Human genetic studies have emphasised the dominant contribution of pancreatic islet dysfunction to development of Type 2 Diabetes (T2D). However, limited annotation of the islet epigenome has constrained efforts to define the molecular mechanisms mediating the, largely regulatory, signals revealed by Genome-Wide Association Studies (GWAS). We characterised patterns of chromatin accessibility (ATAC-seq, n = 17) and DNA methylation (whole-genome bisulphite sequencing, n = 10) in human islets, generating high-resolution chromatin state maps through integration with established ChIP-seq marks. We found enrichment of GWAS signals for T2D and fasting glucose was concentrated in subsets of islet enhancers characterised by open chromatin and hypomethylation, with the former annotation predominant. At several loci (including CDC123, ADCY5, KLHDC5) the combination of fine-mapping genetic data and chromatin state enrichment maps, supplemented by allelic imbalance in chromatin accessibility pinpointed likely causal variants. The combination of increasingly-precise genetic and islet epigenomic information accelerates definition of causal mechanisms implicated in T2D pathogenesis.

Keywords: GWAS; Type 2 Diabetes; epigenetics; evolutionary biology; genomics; human; human biology; human pancreatic islets; medicine.


Conflict of interest statement

MT, Mv, JT, AM, VN, AB, KG, AB, CB, CB, RL, SB, VR, AG No competing interests declared, MM Senior editor, <italic>eLife</italic>

Figures

Figure 1.
Figure 1.. Comparison of human pancreatic islet WGBS and 450 k methylation data across the genome.
(A) Smooth Scatter plot shows Spearman’s rho correlation between the 450 k array (y-axis) and WGBS (x-axis) at overlapping sites. Darker colour indicates higher density of sites. (B) Comparison of the 450 k array (orange) and WGBS (yellow) methylation levels (x-axis) of all CpGs genome-wide assayed by either method (y-axis shows density). The P-value shown is derived using a Kolmogorov-Smirnov (KS) test. (C) For each chromatin state from Parker et al. (2013) the methylation levels of all CpG sites independent of overlap (diamond indicates the median) are shown as violin plots (left y-axis) and the CpG probe percentage per state for the 450 k array (orange) and WGBS (yellow) are shown as bar-plot (right y-axis). The 450 k probes represent the percentage of the total number of CpG sites which is determined by the number of WGBS CpG sites detected (WGBS = 100%). (D) Distribution of GWAS Posterior Probabilities (Type 2 Diabetes and Fasting Glucose) captured by CpG sites on the 450 k array (orange), 850 k array (green) and WGBS (yellow/black line). (E) Locuszoom plot showing CpG density and credible set SNPs. SNPs are shown with P-values (dots, y-axis left), recombination rate (line, y-axis right) and chromosome positions (x-axis) while CpG and gene annotations are shown below. These annotations include CpGs identified from WGBS (yellow stripes), 450 k CpG probes (orange stripes), 850 k CpG probes (green stripes) and gene overlap (DGKB label). The highlighted region in blue captures the 99% credible set region plus additional 1000 bp on either side. At the very bottom the position on chromosome seven is shown in Megabases (Mb).
Figure 1—figure supplement 1.
Figure 1—figure supplement 1.. Correlation of DNA methylation across WGBS and 450 k sites and comparison of WGBS and 450 k methylation levels across chromatin states.
(A-B) Spearman’s rho correlation of DNA methylation across 10 individual (A) WGBS and (B) 10 selected (out of 32) 450 k samples on the x-axis and y-axis. (C) Islet chromatin state definitions based on ChIP-seq data reproduced from Parker et al. (2013). TSS: Transcription Start Site (D) The differences in the 450 k and WGBS methylation level distribution measured as D statistic, which represents the difference in the cumulative distributions and is derived from the Kolmogorov-Smirnov test, are shown for each chromatin state separately.
Figure 1—figure supplement 2.
Figure 1—figure supplement 2.. PC analysis of 450 k DNA methylation samples.
(A-B) PC analysis of 450 k DNA methylation data of 32 human islet samples coloured according to the location of origin and processing (A) before correction for Sample-location and (B) after correction for Sample-location using the ComBat function included in the sva package. The shape indicates sex. Sample location EDM_OX: samples obtained from the Alberta Diabetes Institute in Edmonton (Canada) and processed at the University of Oxford. OX_OX: samples obtained from Oxford DRWF Human Islet Isolation Facility and processed at the University of Oxford. OX_UCL: samples obtained from Oxford DRWF Human Islet Isolation Facility and processed at University College London.
Figure 2.
Figure 2.. Overlap of WGBS hypomethylation and ATAC-seq open chromatin peaks with regulatory annotation.
(A) Methylation levels in percent (y-axis) and log2 CpG density (x-axis) of UMR and LMR regulatory regions with the dashed line indicating the CpG-number (30 CpGs) that distinguishes LMRs and UMRs. (B) Log2 Fold Enrichment (log2FE) of LMRs (green shape), UMRs (blue shape) in various islet annotations is shown. These annotations include islet chromatin states, islet relevant TFBS (FOXA2, MAFB, NKX2.2, NKX6.1, PDX1), islet eQTLs, WGBS derived T2D-associated islet disease DMRs (dDMRs) and ATAC-seq open chromatin peaks. The dDMRs were derived from 6 T2D and eight non-diabetic individuals by Volkov et al. (2017) and dDMRs (orange shape) were also tested for enrichment in the aforementioned islet regulatory annotations. For all annotations, the empirically determined Bonferroni adjusted P-value is ≤0.00032 unless otherwise indicated by the shape: a dot corresponds to an Bonferroni adjusted p-value<0.00032 while the three triangles indicates Bonferroni adjusted p-values>0.00032: UMR enrichment adjusted P-value for weak enhancers = 1; dDMR enrichment adjusted P-value for MAFB = 0.006 and dDMR enrichment adjusted P-value for islet eQTLs = 0.01.
Figure 2—figure supplement 1.
Figure 2—figure supplement 1.. Identification and removal of Partially Methylated Domains (PMDs) and additional characterisation of regulatory regions.
(A-B) Density distribution of the alpha value (A) before and (B) after removing PMDs (green curve in (A)) on chromosome 22. Alpha values represent a summary statistic derived from DNA methylation of windows of 100 CpGs and represents an indication of the polarisation status of methylation values in the genome which is expected to contain either highly methylated or unmethylated regions. Distributions with alpha <1 indicate methylation levels that are bimodal with either 0 or one methylation. Alpha = 1 corresponds to a uniform distribution of methylation; and distributions with alpha >1 tend to have primarily intermediate methylation levels. The red and green curve in (A) represent the non-PMD (red) and PMD regions (green) in the genome. (C) Number of peaks (x-axis) and mapped and filtered reads (y-axis) per ATAC-seq islet preparation. The dashed line indicates the mean read number. (D) Log2 Fold Enrichment (log2FE, x-axis) and associated -log10 Bonferroni adjusted P-values (y-axis) of LMRs (circle), UMRs (triangle) in various islet annotations (colours) is shown. These annotations include islet chromatin states, islet relevant TFBS (FOXA2, MAFB, NKX2.2, NKX6.1, PDX1), islet eQTLs, WGBS derived T2D-associated islet disease DMRs (dDMRs) and ATAC-seq open chromatin peaks. dDMRs (square) were also tested for enrichment in the aforementioned islet regulatory annotations. The results cluster near -log10 P-value of 3.5 since most Bonferroni adjusted P-values were more extreme than 0.00032.
Figure 3.
Figure 3.. Integration of islet epigenetic data to refine chromatin regulatory states and enrichment of these states in T2D GWAS data.
(A) 15 chromatin states (y-axis) were derived from ChIP histone marks, DNA methylation and ATAC-seq open chromatin annotations (x-axis) using chromHMM. For each state the relevant marks characterising the state are shown. The colour is based on the chromHMM emission parameters and a darker colour indicates a higher frequency of a mark at a given state. Weak enhancers (marked by H3K4me1 alone, red) and strong enhancers (marked by H3K27ac and H3K4me1, green) were subdivided by the chromHMM analysis according to methylation and ATAC-seq status (highlighted in red and green box). The black bar at the x-axis highlights the most important marks for characterising enhancer subtypes. (B-C) FGWAS Log2 Fold Enrichment including 95% CI (log2FE, x-axis) of all chromatin states (y-axis) in T2D GWAS regions is shown which demonstrate differential enrichment amongst enhancer subclasses in single-feature enrichment analysis. In addition, log2FE of Coding Sequence (CDS) and Conserved Sequence (CONS) annotations are shown to include the effect of protein-coding and conserved regions. Significantly enriched annotations are shown in black while non-siginificant annotations are shown in grey. (C) T2D FGWAS maximum likelihood model determined through cross-validation. Log2FE and 95% CI (x-axis) of annotations included in the maximum likelihood model (y-axis) also demonstrate differential enrichment amongst enhancer subclasses. *Analysis for Genic Enhancers (state 10) did not converge and hence, only a point log2FE estimate is provided. (D) Single feature log2FE including 95% CI (x-axis) results are shown highlighting the differences in T2D GWAS enrichment of various annotations. These include ATAC-seq open chromatin peaks (red), WGBS methylation regions (including enhancer-like LMRs, promoter-like UMRs and Partially Methylated Domains, blue), ChIP-seq chromatin states (orange) and CDS and CONS (green) annotations. (E) Chi-square distribution (curved black line) with the indicated results of a maximum likelihood ratio test based on the maximum likelihood difference between a model including LMRs or ATAC-seq peaks compared to the ChIP-only model. The dashed red line indicates significance (p-value<0.05). For all FGWAS enrichment plots the axis has been truncated at −6 to facilitate visualisation and accurate values are provided in the supplementary tables.
Figure 3—figure supplement 1.
Figure 3—figure supplement 1.. Prediction of regulatory regions using WGBS and ATAC-seq data and testing these regions for enrichment in T2D GWAS regions.
(A) Different combinations of epigenomic data (top) were combined to generate different sets of refined chromatin states (middle, 11 ChIP-only and 15 ChIP + Meth, ChIP + ATAC and ChIP + ATAC+Meth states, see figure Figure 3—figure supplement 1B and Figure 3A-B for actual states) using chromHMM. These sets of chromatin states were then tested for enrichment in T2D-related GWAS traits using FGWAS to compare enrichment across states (bottom). (B) ChromHMM (I) 11 ChIP-only and 15 state (II) ChIP + ATAC state and (III) ChIP + Meth models. (C) Single feature log2FE (x-axis) for different enhancer states (grey panels) defined from different combinations of epigenetic marks (y-axis) including ChIP+ ATAC+ Meth, ChIP+ ATAC, ChIP + Meth and ChIP-only. Enhancers are defined as follows: Strong enhancers are marked by both H3K4me1 and H3K27ac, weak Enhancers are defined by H3K4me1 only, gene enhancers are marked by H3K4me1 and H3K36me3, other enhancers are marked by H3K4me1, H3K4me3 and H3K27ac and are often referred to as TSS upstream regions (only included in the FGWAS T2D model for ChIP-only and ChIP + Meth chromatin states). (D) Since chromatin states defined from a different set of epigenomic marks (ChIP-only, ChIP + Meth, ChIP + ATAC and ChIP + ATAC+ Meth), as described in Figure 3—figure supplement 1A-B, are not equivalent and the enrichment can not be easily compared across models, a nested model approach was applied. That is, ChIP-only chromatin states were generated and after evaluating the individual enrichment of each annotation (see Figure 3D), FGWAS maximum likelihood models were defined using ChIP-only, hypomethylated and/or ATAC-seq peak regulatory regions. The combination of all these annotations represented a nested linear model and the changes in maximum likelihood by adding/removing hypomethylated regulatory and ATAC-seq states could be statistically evaluated using a Loglikelihood Ratio Test (LRT) as shown in Figure 3E. (E) Maximum likelihood FGWAS nested model combining ChIP-only, ATAC-peaks and LMR states (y-axis) showing log2FE enrichment (x-axis) which was used for the LRT in Figure 3E. For all FGWAS enrichment plots the axis has been truncated at −6 to facilitate visualisation and accurate values are provided in the supplementary tables.
Figure 3—figure supplement 2.
Figure 3—figure supplement 2.. Enrichment of refined islet regulatory states in FG GWAS data.
(A) FGWAS Log2 Fold Enrichment including 95% CI (log2FE, x-axis) of all chromatin states (y-axis) in FG GWAS regions. In addition, log2FE of CDS and CONS annotations are shown to also include the effect of protein-coding and conserved regions. Significantly enriched annotations are shown in black. (B) FG FGWAS maximum likelihood model determined through cross-validation. log2FE and 95% CI (x-axis) of annotations included in the maximum likelihood model (y-axis) are shown. (C) Single feature log2FE (x-axis) for different enhancer states (grey panels) defined from different combinations of epigenetic marks (y-axis) including ChIP + ATAC + Meth, ChIP + ATAC, ChIP + Meth and ChIP-only. Enhancers are defined as follows: Strong enhancers are marked by both H3K4me1 and H3K27ac, weak Enhancers are defined by H3K4me1 only, gene enhancers are marked by H3K4me1 and H3K36me3, other enhancers are marked by H3K4me1, H3K4me3 and H3K27ac and are often referred to as TSS upstream regions (only included in the FGWAS T2D model for ChIP-only and ChIP + Meth chromatin states). (D) Single feature log2FE including 95% CI (x-axis) results of various annotations derived from ChiP-seq (ChIP-only), ATAC-seq, WGBS methylation status and CDS and CONS are shown. (E) Maximum likelihood FGWAS nested model combining ChIP-only, ATAC-peaks and LMR states (y-axis) showing log2FE enrichment (x-axis) which was used for the LRT in Figure 3—figure supplement 2F. (F) Chi-square distribution (black curved line) with the indicated results of a maximum likelihood ratio test based on the maximum likelihood difference between a model including LMRs or ATAC-seq peaks compared to the ChIP-only model. The dashed line indicates significance (p-value<0.05). For all FGWAS enrichment plots the axis has been truncated at −6 to facilitate visualisation and accurate values are provided in the supplementary tables.
Figure 4.
Figure 4.. Evaluating Posterior Probabilities (PPA) derived from the FGWAS maximum likelihood model at significant T2D GWAS loci.
(A) Per locus the difference in the number of 99% credible set variants between ChIP +ATAC + Meth and ChIP-only model is shown (positive values indicate a reduction in the number of 99% credible set variants in the ChIP+ATAC+Meth model). (B) Per locus the difference in the maximum single variant PPA between the ChIP +ATAC + Meth and ChIP-only model is shown (positive values indicate an increase in the maximum single variant PPA in the ChIP +ATAC + Meth model). (C) T2D GWAS loci were classified into insulin secretion (ISR), insulin resistance (IR) or unclassified loci based on genetic association with physiological traits derived from Dimas et al. (2014) and Wood et al. (2017). In addition, loci with known role in islet genomic regulation or function are highlighted in bold. These include loci with islet eQTLs (ZMIZ1, CDC123) and mQTLs (WFS1, KCNJ11). (D) Identification of T2D GWAS loci and variants enriched for enhancer chromatin states using FGWAS PPA. Per locus the highest PPA variant is shown (y-axis) and the number of variants with PPA >0.01 (x-axis). Loci with high PPA variants (min PPA >0.1, dashed horizontal line) that overlap one of the enhancer states (green) are highlighted and the high PPA variants (PPA >0.1) were tested for allelic imbalance in open chromatin.
Figure 4—figure supplement 1.
Figure 4—figure supplement 1.. Evaluating annotation effect on Posterior Probabilities (PPA) derived from the FGWAS maximum likelihood model at significant T2D GWAS loci.
(A) Violin plot showing the distribution of 99% credible set variant size (y-axis, log10 scale) of different annotation types used (x-axis, ChIP-only, ChIP + Meth, ChIP + ATAC, ChIP +ATAC + Meth, ATAC-only and LMR-only model). (B) Violin plot showing the distribution in the maximum single variant PPA (y-axis) of different annotation types used (x-axis, ChIP-only, ChIP + Meth, ChIP + ATAC, ChIP +ATAC + Meth, ATAC-only and LMR-only model). Dots indicate mean value. (C) Median 99% credible set variant size (x-axis) and median top variant PPA (y-axis) information for ChIP-only, ChIP + Meth, ChIP + ATAC, ChIP + ATAC + Meth, ATAC-only and LMR-only models.
Figure 5.
Figure 5.. Epigenome Landscape of selected loci with allelic imbalance.
For each locus (A) CDC123, (B) KLHDC5 and C) ADCY5 the following information is shown: Variant level information (depending on the region GWAS lead SNP red, credible set black, eQTL blue and high LD SNPs with r2 >0.8 black), WGBS methylation data (black, middle), four human islet ATAC-seq tracks (green, middle), islet chromatin states (from this study as well as Parker et al., 2013) and Pasquali et al., 2014) and Encode chromatin states from 9 cell types (bottom). For ADCY5 3 ATAC-seq Endoß tracks (top green) and the Capture C results in the Endoß cell line are shown as well (middle blue). Abbreviation for cell types: B-lymphoblastoid cells (GM12878), embryonic stem cells (H1 ES), erythrocytic leukaemia cells (K562), hepatocellular carcinoma cells (HepG2), umbilical vein endothelial cells (HUVEC), mammary epithelial cells (HMEC), skeletal muscle myoblasts (HSMM),normal epidermal keratinocytes (NHEK) and normal lung fibroblasts (NHLF).
Figure 5—figure supplement 1.
Figure 5—figure supplement 1.. Characterisation of likely causal mechanisms at selected loci with allelic imbalance.
(A) Predicted PAX6 Transcription factor binding motif likely affected by allelic imbalance of the variant rs10842991 (highlighted in purple). (B) The ADCY5 rs11708067 risk A allele was associated with increased methylation levels (y-axis, while genotypes are shown on the x-axis). (C) Chromatin Capture (Capture C) in the human beta-cell line EndoßH1 showed interactions between the ADCY5 promoter (peak) and the flanking regions of the promoter. The x-axis shows the position on the chromosome in Mb while the y-axis indicates mapped reads per fragment. (D) Chromatin Capture (Capture C) in the human beta-cell line EndoßH1 focussed at the genomic region (~47 kb) near the variant rs11708067 (highlighted) and variants in high LD (r2 >0.8) with it (variants are depicted as black dots). Fragments containing rs11708067 (red) or other high LD variants (dark grey) are highlighted. The x-axis shows the position on the chromosome in bp while the y-axis indicates normalised mapped reads per fragment. The two fragments with P-values have a significant (FDR < 0.05) number of normalised read counts over background: The fragment with the P-value on the left (in red) contains rs11708067 while the fragment with the P-value on the right harbours rs2877716, rs6798189, rs56371916.

References

    1. Aryee MJ, Jaffe AE, Corrada-Bravo H, Ladd-Acosta C, Feinberg AP, Hansen KD, Irizarry RA. Minfi: a flexible and comprehensive Bioconductor package for the analysis of Infinium DNA methylation microarrays. Bioinformatics. 2014;30:1363–1369. doi: 10.1093/bioinformatics/btu049. - DOI - PMC - PubMed
    1. Bell JT, Pai AA, Pickrell JK, Gaffney DJ, Pique-Regi R, Degner JF, Gilad Y, Pritchard JK. DNA methylation patterns associate with genetic and gene expression variation in HapMap cell lines. Genome Biology. 2011;12:R10. doi: 10.1186/gb-2011-12-1-r10. - DOI - PMC - PubMed
    1. Buenrostro JD, Giresi PG, Zaba LC, Chang HY, Greenleaf WJ. Transposition of native chromatin for fast and sensitive epigenomic profiling of open chromatin, DNA-binding proteins and nucleosome position. Nature Methods. 2013;10:1213–1218. doi: 10.1038/nmeth.2688. - DOI - PMC - PubMed
    1. Burger L, Gaidatzis D, Schübeler D, Stadler MB. Identification of active regulatory regions from DNA methylation data. Nucleic Acids Research. 2013;41:e155. doi: 10.1093/nar/gkt599. - DOI - PMC - PubMed
    1. Carlson M, Maintainer B. TxDb.Hsapiens.UCSC.hg19.knownGene: Annotation Package for TxDb Object(s) R package version 3.2.22015

Publication types