. 2018 Feb 6;27(2):419-427.e4.
doi: 10.1016/j.cmet.2018.01.001.

Palmitic Acid Hydroxystearic Acids Activate GPR40, Which Is Involved in Their Beneficial Effects on Glucose Homeostasis

Affiliations

Palmitic Acid Hydroxystearic Acids Activate GPR40, Which Is Involved in Their Beneficial Effects on Glucose Homeostasis

Ismail Syed et al. Cell Metab. .

Abstract

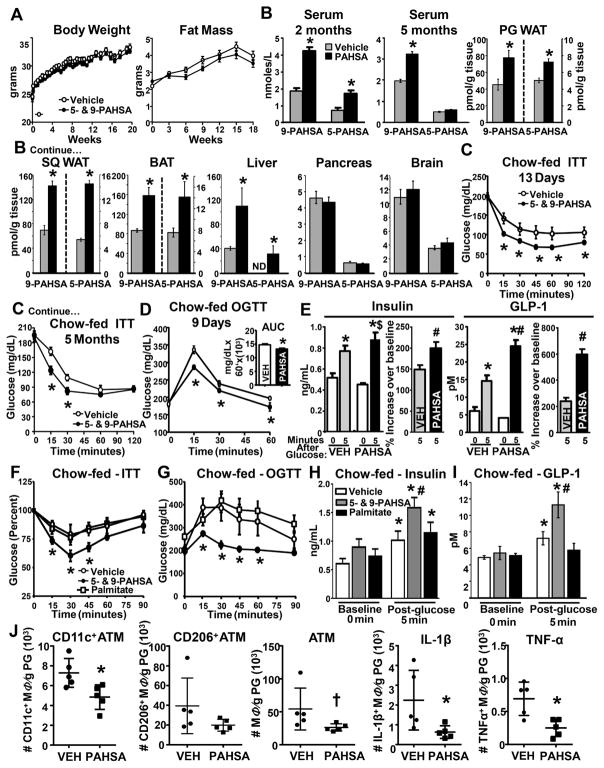
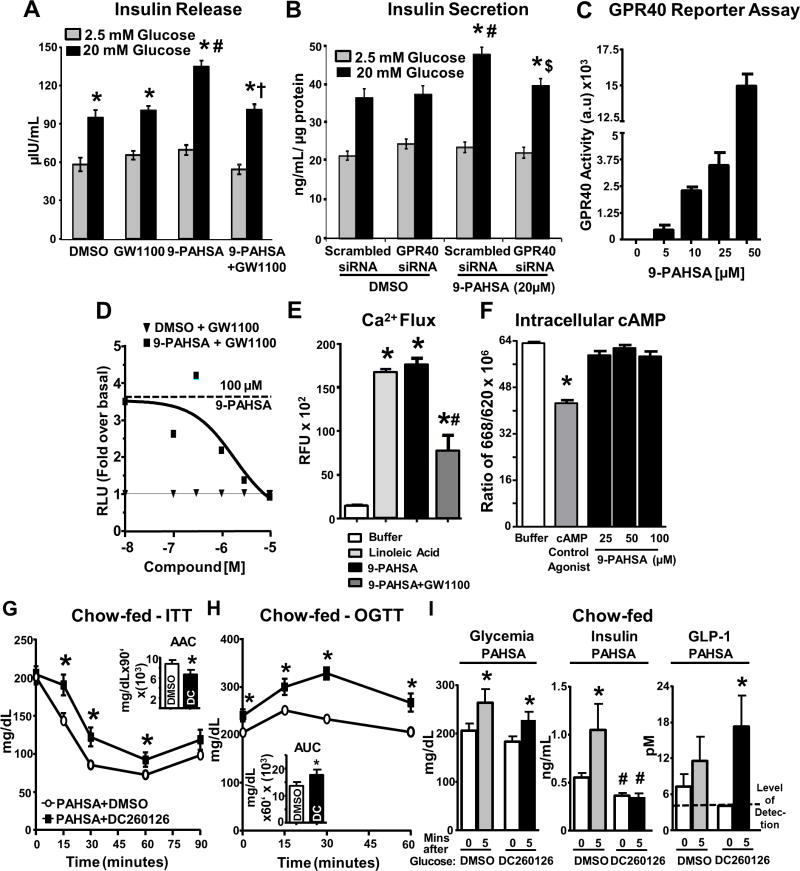
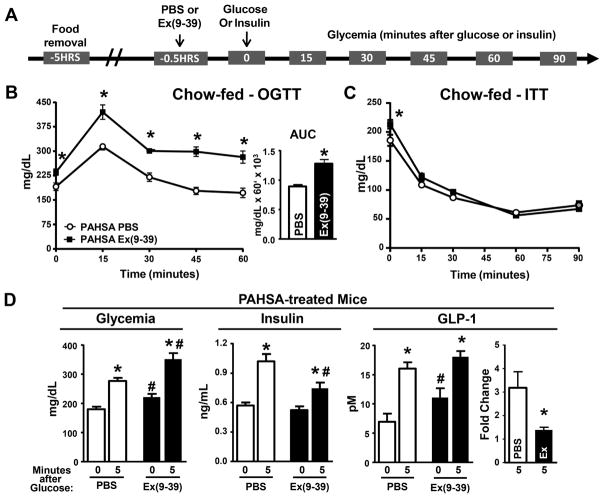
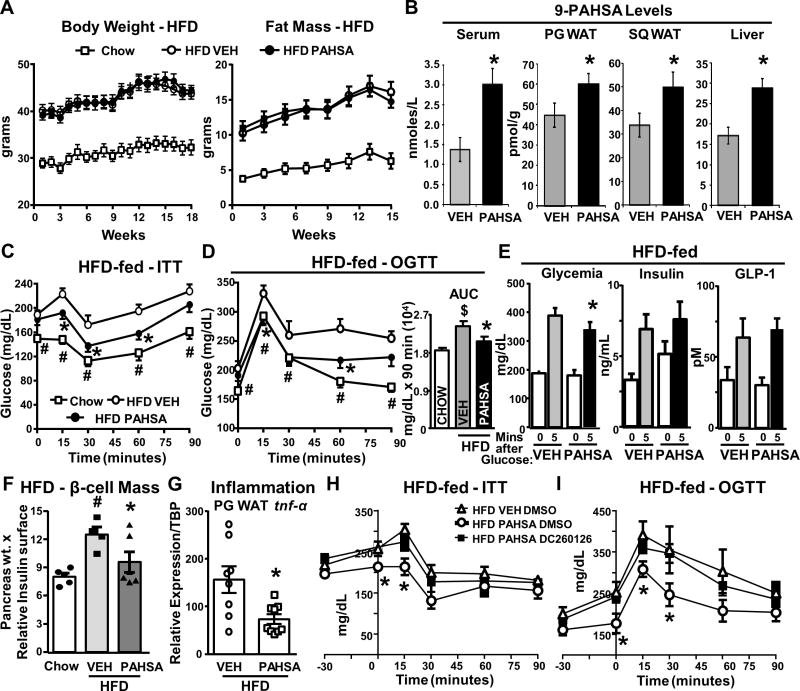
Palmitic acid hydroxystearic acids (PAHSAs) are endogenous lipids with anti-diabetic and anti-inflammatory effects. PAHSA levels are reduced in serum and adipose tissue of insulin-resistant people and high-fat diet (HFD)-fed mice. Here, we investigated whether chronic PAHSA treatment enhances insulin sensitivity and which receptors mediate PAHSA effects. Chronic PAHSA administration in chow- and HFD-fed mice raises serum and tissue PAHSA levels ∼1.4- to 3-fold. This improves insulin sensitivity and glucose tolerance without altering body weight. PAHSA administration in chow-fed, but not HFD-fed, mice augments insulin and glucagon-like peptide (GLP-1) secretion. PAHSAs are selective agonists for GPR40, increasing Ca+2 flux, but not intracellular cyclic AMP. Blocking GPR40 reverses improvements in glucose tolerance and insulin sensitivity in PAHSA-treated chow- and HFD-fed mice and directly inhibits PAHSA augmentation of glucose-stimulated insulin secretion in human islets. In contrast, GLP-1 receptor blockade in PAHSA-treated chow-fed mice reduces PAHSA effects on glucose tolerance, but not on insulin sensitivity. Thus, PAHSAs activate GPR40, which is involved in their beneficial metabolic effects.

Keywords: FAHFA; GLP-1 receptor; GPR40; glucose-insulin homeostasis; human islets; insulin secretion; palmitic acid hydroxystearic acid; type 2 diabetes.


Conflict of interest statement

Declaration

“The authors declare no competing interests.”

Figures

Figure 1
Figure 1. Chronic PAHSA treatment improves insulin sensitivity and glucose tolerance, and reduces adipose tissue inflammation without altering food intake or adiposity
(A) Body weight and fat mass of C57bl6 male chow mice treated with vehicle or 5- and 9- PAHSAs (2mg/kg body weight/day of each) via minipumps. n=16/group. (B) 5- and 9-PAHSA levels in sera at 2 and 5 months, and tissues at 5 months of 5-and 9-PAHSA treatment. n=5– 6/group. (C) Insulin tolerance tests (ITT) and (D) oral glucose tolerance tests (OGTT) in vehicle-and PAHSA-treated mice. n=8–11/group. For A–D, *p<0.05 vs. vehicle. (E) Serum insulin and GLP-1 levels 5 min post-glucose challenge in vehicle- and PAHSA-treated mice. n=14–16/group. *p<0.05 vs. baseline within same treatment, #p<0.05 vs. vehicle at same time point, $p=0.08 vs. vehicle at same time point. (F) ITT, (G) OGTT, and (H–I) serum insulin and GLP-1 levels 5 min post-glucose challenge in vehicle-, palmitate- and PAHSA-treated outbred mice. n=7–9/group. *p<0.05 vs. baseline within same treatment, #p<0.05 vs. vehicle at same time point. (J) Number of AT CD11c+, CD206+, total number of AT macrophages, and macrophages expressing IL-1β and TNFα from PG WAT. n=4–5/group. *p<0.05 vs. vehicle; †p<0.08 vs. vehicle. Statistical significance was evaluated by unpaired two-tailed Student’s t-test or two-way ANOVA with Tukey post-hoc tests. Data are means±SEM.
Figure 2
Figure 2. PAHSAs directly activate GPR40, and GPR40 antagonism reverses PAHSA-mediated improvements in glucose tolerance, insulin sensitivity and insulin secretion
(A) Human islets treated with DMSO, 9-PAHSA (20μM), GW1100 (10μM), or 9-PAHSA+GW1100 for 45 min during glucose stimulation. 75 islets/condition. *p<0.05 vs. respective 2.5mM glucose, #p<0.05 vs. DMSO 20mM glucose, †p<0.05 vs. 9-PAHSA 20mM glucose. (B) MIN6 cells transfected with scrambled or GPR40 siRNA, treated with DMSO or 9-PAHSA (20μM) for 45 min during glucose stimulation. n=10 wells/condition. *p<0.05 vs. respective 2.5mM glucose, #p<0.05 vs. DMSO 20mM glucose scrambled siRNA, $ p<0.05 vs. 9-PAHSA 20mM glucose scrambled siRNA. (C) Reporter assay in HEK293 cells transfected with mouse GPR40 and SRE-luc treated with 9-PAHSA. n=3 wells/condition. (D) GPR40 reporter assay in HEK293 cells treated with either DMSO or 9-PAHSA with GW1100. n=3/condition. (E) Calcium flux assay in mGPR40 stably transfected cells treated with DMSO, linoleic acid, 9-PAHSA, or GW1100. n = 3/condition. *p < 0.05 versus buffer and #p < 0.05 versus linoleic acid and 9-PAHSA alone. (F) cAMP assay in mGPR40 stably transfected cells in presence of DMSO, cAMP agonist control, or 9-PAHSA. n = 3/condition. *p < 0.05 versus all other conditions. (G and H) Five hours after food removal, PAHSA-treated mice were intraperitoneally injected with DMSO or DC260126 followed by insulin intraperitoneal injection or oral glucose after 30 min for an ITT (G) or OGTT (H). For (G) and (H), *p < 0.05 versus PAHSA+DMSO group. (I) Glycemia, insulin and GLP-1 levels were measured in PAHSA-treated mice before and 5 min post-glucose gavage. n=8–10/group. *p<0.05 vs. baseline within same treatment, #p<0.05 vs. Vehicle DMSO at same time point. Statistical significance was evaluated by unpaired one-tailed Student’s t-test or two-way ANOVA with Tukey post-hoc tests. Data are means±SEM.
Figure 3
Figure 3. GLP-1R blockade reverses the effect of 5- and 9-PAHSAs on improved glucose tolerance
(A) 5-hrs after food removal, PAHSA-treated mice were injected with either PBS or 5μg Ex(9-39) i.p. followed 30 min later by OGTT (B) or ITT (C). n=14–16/group. *p<0.05 vs. PAHSA PBS. (D) Glycemia, insulin and GLP-1 levels were measured in PAHSA-treated mice before and 5 min post-glucose gavage. n=8–10/group. Ex indicates Ex(9-39). *p<0.05 vs. baseline within same treatment, #p<0.05 vs. Vehicle PBS at same time point. Statistical significance was evaluated by unpaired two-tailed Student’s t-test or two-way ANOVA with Tukey post-hoc tests. Data are means±SEM.
Figure 4
Figure 4. Chronic PAHSA treatment improves insulin sensitivity and glucose tolerance, and reduces adipose tissue inflammation in HFD mice without altering food intake or adiposity
(A) Body weight and fat mass in chow-fed and HFD mice treated with 9-PAHSA via minipumps. n = 16/group. (B) 9-PAHSA levels in sera and tissues after 4.5 months of 9-PAHSA treatment. n = 5–6/group. (C and D) ITT (98 days of treatment; C) and OGTT (57 days of treatment; D) in vehicle and PAHSA HFD mice. Area under the curve for OGTT. n = 8–14/group. For (B),*p < 0.05 versus vehicle (VEH). For (C), *p < 0.05 versus HFD vehicle and chow, #p < 0.05 versus HFD vehicle and HFD PAHSA. For (D), *p < 0.05 HFD PAHSA versus HFD vehicle, #p < 0.05 chow versus HFD vehicle, $p < 0.05 versus chow and HFD PAHSA. (E) Serum glucose, insulin, and GLP-1 levels 5 min post-glucose challenge in vehicle and PAHSA HFD mice after 70 days of treatment. n = 7–8/group. ∗p < 0.05 versus vehicle at same time point. (F) β cell mass quantification (n = 2–3 sections/mouse, 4–6 mice/group). ∗p < 0.05 versus HFD vehicle; #p < 0.05 versus chow. (G–I) PG WAT tnf-α expression (G) in vehicle and PAHSA HFD mice. n = 8–9/group. ∗p < 0.05 versus HFD vehicle. Five hours after food removal, PAHSA-treated mice were injected intraperitoneally with DMSO or DC260126 followed 30 min later by ITT (H) or OGTT (I). n = 5–6/group. For (H) and (I),*p < 0.05 versus HFD vehicle DMSO and HFD PAHSA DC260126. Statistical significance was evaluated by unpaired one-tailed Student’s t test or two-way ANOVA with Tukey post hoc tests. Data are means ± SEM.

References

    1. Aroda VR, Henry R, Han J, Huang W, DeYoung MB, Darsow T, Hoogwerf BJ. Efficacy of GLP-1R agonists and DPP-4 inhibitors: meta-analysis and systematic review. Clin Ther. 2012;34:1247– 1258. - PubMed
    1. Ayala JE, Bracy DP, James FD, Julien BM, Wasserman DH, Drucker DJ. The glucagon-like peptide-1 receptor regulates endogenous glucose production and muscle glucose uptake independent of its incretin action. Endocrinology. 2009;150(3):1155–1164. - PMC - PubMed
    1. Burant CF, Viswanathan P, Marcinak J, Cao C, Vakilynejad M, Xie B, Leifke E. TAK-875 versus placebo or glimepiride in T2D mellitus: a phase 2, randomised, double-blind, placebo-controlled trial. Lancet. 2012;379:1403–1411. - PubMed
    1. Campbell JE, Drucker DJ. Pharmacology physiology and mechanisms of incretin hormone action. Cell Metab. 2013;17:819–837. - PubMed
    1. Christensen LW, Kuhre RE, Janus C, Svendsen B, Holst JJ. Vascular, but not luminal, activation of FFAR1 (GPR40) stimulates GLP-1 secretion from isolated perfused rat small intestine. Physiol Rep. 2015;3(9):e12551. - PMC - PubMed

Publication types