. 2018 Feb 6;114(3):562-569.
doi: 10.1016/j.bpj.2017.11.3781.

Soft Vibrational Modes Predict Breaking Events during Force-Induced Protein Unfolding

Affiliations

Soft Vibrational Modes Predict Breaking Events during Force-Induced Protein Unfolding

Mona Habibi et al. Biophys J. .

Abstract

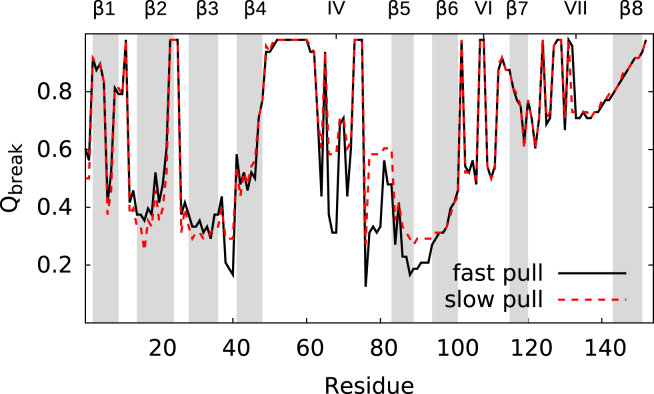
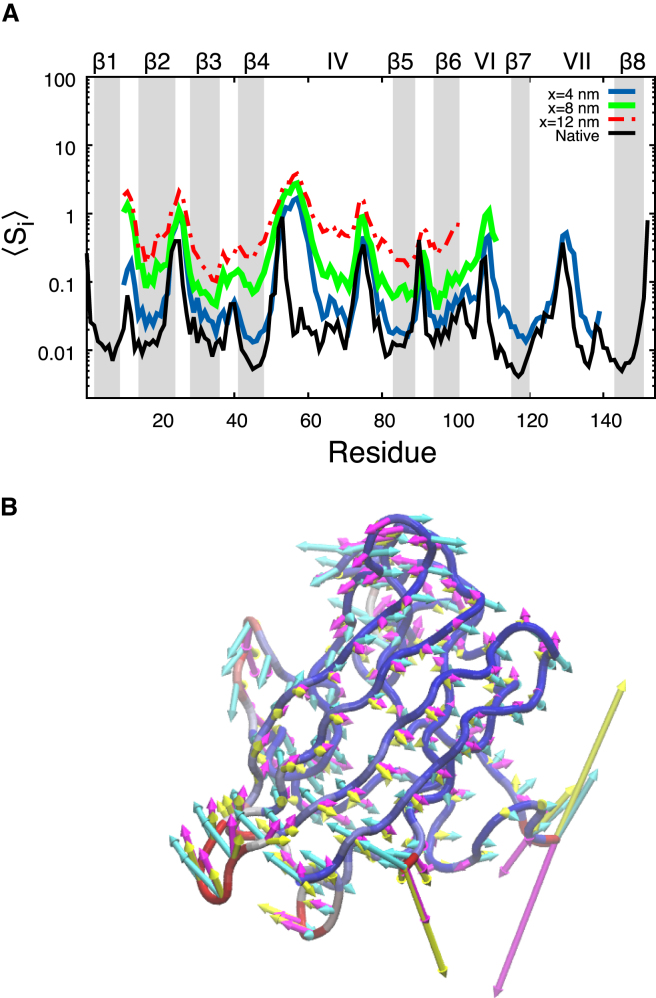
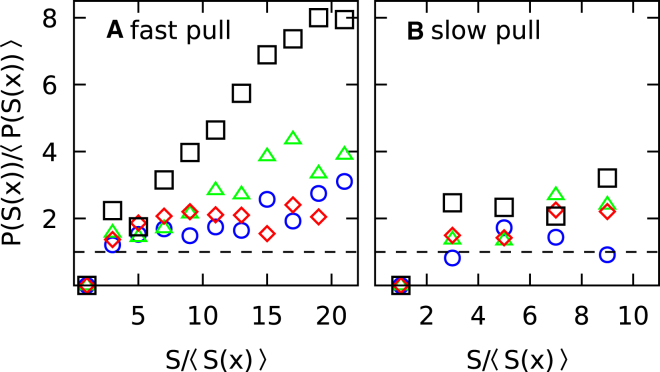
We investigate the correlation between soft vibrational modes and unfolding events in simulated force spectroscopy of proteins. Unfolding trajectories are obtained from molecular dynamics simulations of a Gō model of a monomer of a mutant of superoxide dismutase 1 protein containing all heavy atoms in the protein, and a normal mode analysis is performed based on the anisotropic network model. We show that a softness map constructed from the superposition of the amplitudes of localized soft modes correlates with unfolding events at different stages of the unfolding process. Soft residues are up to eight times more likely to undergo disruption of native structure than the average amino acid. The memory of the softness map is retained for extensions of up to several nanometers, but decorrelates more rapidly during force drops.


Figures

Figure 1
Figure 1
(A) Snapshots of the protein in the native state (Q=1) and during pulling at Q=0.7. (B) Force extension curves and Q (see Eq. 1) versus distance x (dashed double-headed arrows in A) for three different runs with fast pulling speed of 1 m/s. To see this figure in color, go online.
Figure 2
Figure 2
Loss of native structure during mechanical unfolding. The contacts involving residue i are defined as broken when Qi drops below 0.6. Data is averaged over all 1000 (fast) or 40 (slow) pulling simulations. To see this figure in color, go online.
Figure 3
Figure 3
(A) Mean softness of residues in the folded segment of the protein versus residue index at different extensions for the fast pulling simulations. The contiguous region where Si is calculated decreases as the extension increases. (B) Three slowest modes shown as arrows on the Cα-backbone of the native structure in cyan, magenta, and yellow, respectively. In the backbone structure, residues with softness more than median are shown in red. To see this figure in color, go online.
Figure 4
Figure 4
Structure of the folded segment of the protein of one run at different extensions for fast pulling. Residues with Si in the top 20% percentile are shown in red, white represents the median softness, and blue shows residues with softness less than the median. To see this figure in color, go online.
Figure 5
Figure 5
Breaking probability as a function of softness for extensions x=0,4,8,12nm (black(), blue(), green(), and red()). The color code is the same as in Fig. 3. The breaking probability is rescaled by the average breaking probability of the residues at that extension. Likewise, softness is rescaled by the average softness at that extension: (A) fast pulling (1.0 m/s) and (B) slow pulling (0.1 m/s). Statistical error bars are of order the symbol size. To see this figure in color, go online.
Figure 6
Figure 6
Predictive success rate of breaking events as a function of the fraction of the softest residues of the protein for fast (A) and slow (B) pulling at extensions x=0,4,8,12nm (black(), blue(), green(), and red()). The gray line indicates the success rate expected for randomly chosen residues. Error bars are of order the symbol size. To see this figure in color, go online.
Figure 7
Figure 7
Evolution of predictive success rate Θ(0.5) at constant softness fraction of 50% for fast (A) and slow (B) pulling. Si(x) is calculated at x, and Qi is monitored at subsequent extensions (see text). Vertical dashed lines (blue and red) show the points where the softness is calculated, and the horizontal dashed line indicates the decorrelated value. To see this figure in color, go online.
Figure 8
Figure 8
Force extension curves and Q versus distance for fast and slow pulling averaged over all runs are shown in navy and pink, respectively. Vertical lines show the points where softness is calculated. Dotted lines indicate the approximate slopes of the Q versus distance curve in the three regimes as a guide to the eye. To see this figure in color, go online.

References

    1. Zhuravlev P.I., Reddy G., Thirumalai D. Propensity to form amyloid fibrils is encoded as excitations in the free energy landscape of monomeric proteins. J. Mol. Biol. 2014;426:2653–2666. - PMC - PubMed
    1. Mojumdar S.S., Dee D.R., Woodside M.T. Multiple intermediates in the folding of superoxide dismutase 1 revealed by single molecule force spectroscopy. Biophys. J. 2016;110:497a.
    1. Moffitt J.R., Chemla Y.R., Bustamante C. Recent advances in optical tweezers. Annu. Rev. Biochem. 2008;77:205–228. - PubMed
    1. Lu H., Isralewitz B., Schulten K. Unfolding of titin immunoglobulin domains by steered molecular dynamics simulation. Biophys. J. 1998;75:662–671. - PMC - PubMed
    1. West D.K., Brockwell D.J., Paci E. Mechanical resistance of proteins explained using simple molecular models. Biophys. J. 2006;90:287–297. - PMC - PubMed

Publication types

Substances

Grants and funding

LinkOut - more resources