. 2018 May;17(5):974-992.
doi: 10.1074/mcp.RA118.000583. Epub 2018 Feb 2.

Peptide Level Turnover Measurements Enable the Study of Proteoform Dynamics

Affiliations

Peptide Level Turnover Measurements Enable the Study of Proteoform Dynamics

Jana Zecha et al. Mol Cell Proteomics. 2018 May.

Abstract

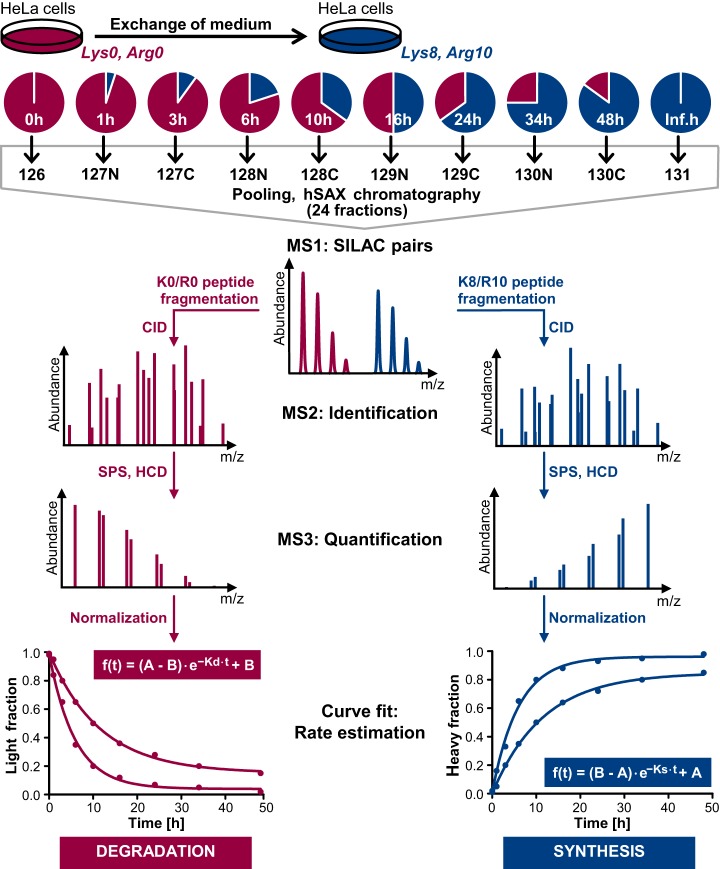
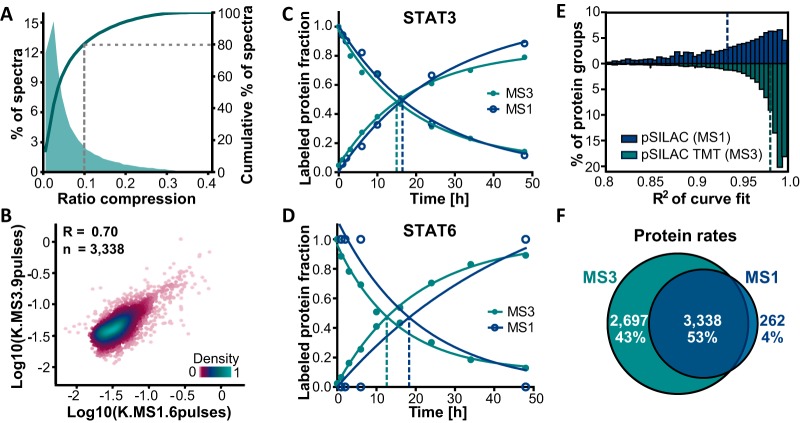
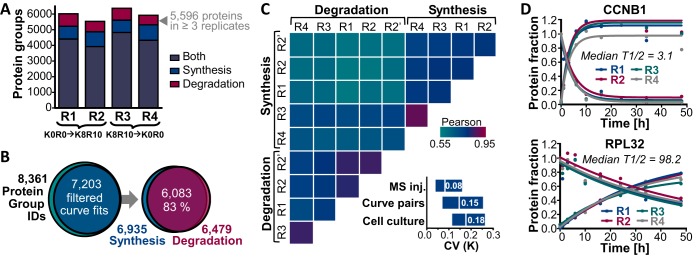
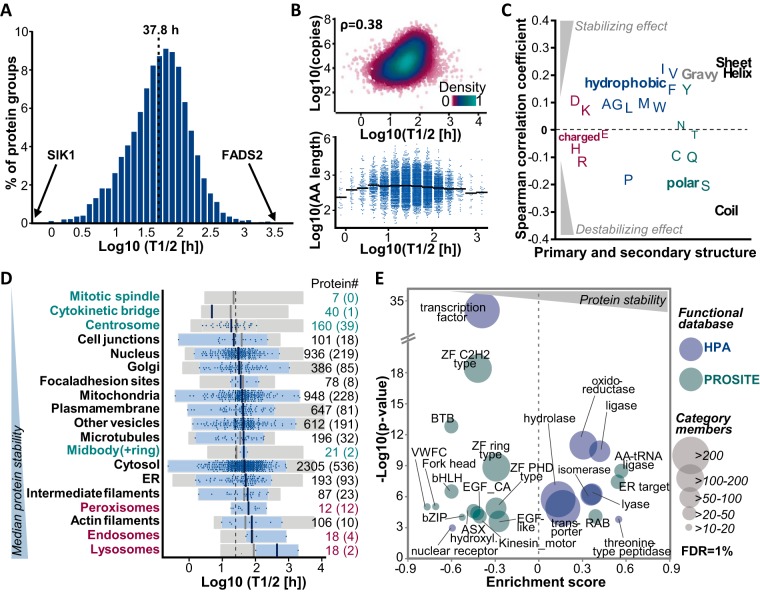
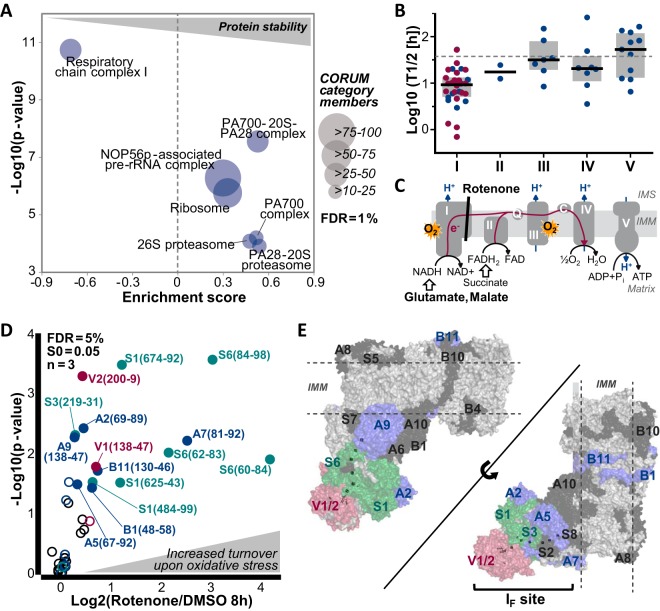
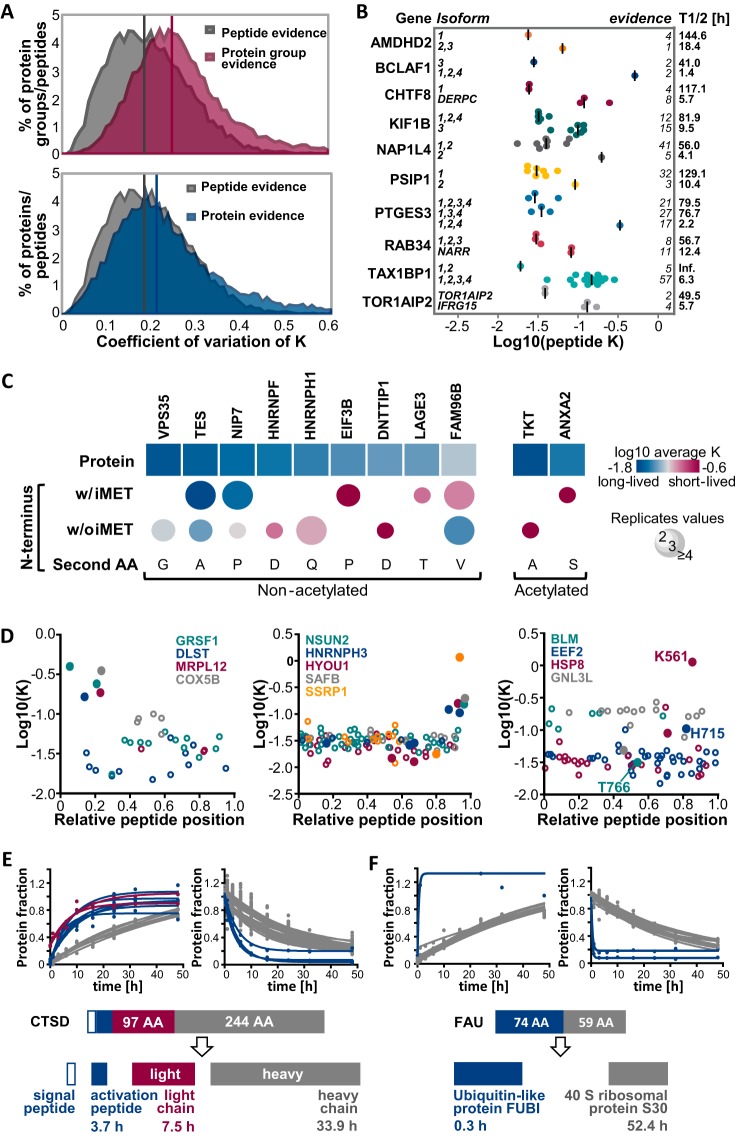
The coordination of protein synthesis and degradation regulating protein abundance is a fundamental process in cellular homeostasis. Today, mass spectrometry-based technologies allow determination of endogenous protein turnover on a proteome-wide scale. However, standard dynamic SILAC (Stable Isotope Labeling in Cell Culture) approaches can suffer from missing data across pulse time-points limiting the accuracy of such analysis. This issue is of particular relevance when studying protein stability at the level of proteoforms because often only single peptides distinguish between different protein products of the same gene. To address this shortcoming, we evaluated the merits of combining dynamic SILAC and tandem mass tag (TMT)-labeling of ten pulse time-points in a single experiment. Although the comparison to the standard dynamic SILAC method showed a high concordance of protein turnover rates, the pulsed SILAC-TMT approach yielded more comprehensive data (6000 proteins on average) without missing values. Replicate analysis further established that the same reproducibility of turnover rate determination can be obtained for peptides and proteins facilitating proteoform resolved investigation of protein stability. We provide several examples of differentially turned over splice variants and show that post-translational modifications can affect cellular protein half-lives. For example, N-terminally processed peptides exhibited both faster and slower turnover behavior compared with other peptides of the same protein. In addition, the suspected proteolytic processing of the fusion protein FAU was substantiated by measuring vastly different stabilities of the cleavage products. Furthermore, differential peptide turnover suggested a previously unknown mechanism of activity regulation by post-translational destabilization of cathepsin D as well as the DNA helicase BLM. Finally, our comprehensive data set facilitated a detailed evaluation of the impact of protein properties and functions on protein stability in steady-state cells and uncovered that the high turnover of respiratory chain complex I proteins might be explained by oxidative stress.


Figures

Fig. 1.
Fig. 1.
Schematic representation of the multiplexed pulsed SILAC-TMT strategy for estimation of protein synthesis and degradation employed in this study. Cells grown in K0/R0 containing medium were pulsed labeled with medium supplemented with K8/R10 and lysed after 10 different time-points (inf. h corresponds to ≥ 10 cell doublings). After digestion, peptides derived from different time-points were labeled with TMT, pooled, and fractionated using hydrophilic strong anion exchange (hSAX) chromatography. Peptides were identified by MS2 spectra and quantified using MS3 scans. Decreasing and increasing labels represent protein degradation and synthesis. Assuming exponential protein degradation, one-phase decay and association functions were applied for estimation of the rates of K0/R0 label decrease and K8/R10 label increase (A: curve maximum; B: curve offset; K: turnover rate; see supplementary methods for a detailed explanation of the curve fitting).
Fig. 2.
Fig. 2.
Comparison of MS1 (pulsed SILAC) and MS3 (pulsed SILAC-TMT) based quantification. A, The fraction of MS3 spectra as a function of the detected ratio compression (from measuring the residual intensities in outermost TMT channels) illustrates that ratio distortion was still present, but that >80% of all fitted and filtered spectra showed less than 10% residual intensities. B, Correlation analysis of log transformed labeling rates showed good agreement between the MS1 and MS3 based quantification approaches (R: Pearson's correlation coefficient). C, Labeling characteristics measured for the protein STAT3 either using the MS1 or MS3 strategy yielded consistent data. D, Fractional labeling determined for the protein STAT6 in which MS1 data points were missing (one SILAC isotope pair signal missing for 1, 3, 6, and 48 h time points and no data for the 10 and 24 h time points) led to substantial differences in curve fits between MS1 and MS3 data. E, Distributions of coefficients of determination (R2) of curve fits display consistently higher values for the MS3 compared with the MS1 approach (dotted lines: medians). F, Comparison of the number of proteins with determined turnover parameters shows a higher number for the MS3 strategy.
Fig. 3.
Fig. 3.
Reproducibility of protein turnover rate determination by pulsed SILAC-TMT labeling. A, Turnover rates were determined for between 5528 and 6367 protein groups per cell culture replicate (R1-R4). B, In total, rates were obtained for 7203 proteins, and for 83% of these turnover information was available from both label increase and decrease. C, Correlation matrix depicts color-coded Pearson's correlation coefficients for log transformed protein turnover rates determined from synthesis and degradation curves for cell culture (R1-R4) and MS injection (R2 and R2′) replicates. The boxplots (10th–90th percentile) show the coefficients of variation of turnover rates across replicate MS injections, synthesis and degradation curve pairs within a sample and cell culture replicates. D, Examples of the reproducibility of turnover determination across cell culture replicates are displayed for the high turnover protein G2/mitotic-specific cyclin-B1 (CCNB1) and the stable 60S ribosomal protein L32 (RPL32).
Fig. 4.
Fig. 4.
Analysis of protein half-lives relating to intrinsic protein properties and functions. A, The distribution of protein half-lives in HeLa cells is displayed. The median protein half-life of all proteins is 37.8 h. B, Correlations of protein half-lives and copy numbers per cell (upper panel, ρ: Spearman rank correlation coefficient) and protein length (bottom panel) are shown. Solid black lines indicate the median length of all proteins in the half-life bin. C, Spearman rank correlation coefficients are depicted for the correlation of protein half-lives and amino acid composition, amino acid properties, and protein secondary structure elements. D, Floating bar charts illustrate the range of protein half-lives as a function of cellular localization (according to the Human Protein Atlas (HPA) and MitoCharta project). Proteins which are part of cell structures involved in cell division are shown in green, endo-, lyso- and peroxisome associated proteins are shown in red. Gray boxes display all proteins associated with the respective subcellular location, blue boxes refer to proteins (blue dots) which were reported to be exclusively found in this cell compartment or structure. Numbers on the right indicate how many proteins are in each category and numbers in brackets refer to proteins with exclusive localization. E, The scatter plot shows significantly enriched categories after a one-dimensional functional enrichment analysis (1% FDR) using protein domain and family information provided by the PROSITE and HPA databases. The size of each circular shape indicates the number of proteins in each category.
Fig. 5.
Fig. 5.
Analysis of turnover of respiratory chain complex I proteins in response to rotenone induced, oxidative stress. A, One-dimensional enrichment analysis (1% FDR) using CORUM database annotations revealed that respiratory chain complex I (NADH dehydrogenase) was significantly enriched in high turnover proteins. The size of each circular shape indicates the number of proteins in each complex. B, Scatter dot plots show protein half-lives of members of the different respiratory chain complexes. Black lines indicate the median half-life of proteins within each complex and proteins marked in red were followed up by rotenone and/or glutamate and malate treatment in the subsequent PRM assays. C, The schematic representation of the different complexes of the respiratory chain (I-V) illustrates sites of metabolic reactions and superoxide production (IMM: Inner mitochondrial membrane; IMS: Intermembrane space; Q: Ubiquinone; C: Cytochrome C). D, The Volcano plot shows the results of triplicate PRM assays monitoring the turnover of 22 members of the respiratory chain complex I in response to rotenone (1 μm), glutamate and malate (5 mm) treatment. Peptides exhibiting a significantly higher turnover on treatment (5% FDR, S0 = 0.05) are illustrated by filled circles and labeled with the subunit, peptide start and end positions. Colors refer to proteins shown in panel E. E, Crystal structures of respiratory chain complex I proteins are displayed. NADH dehydrogenase proteins with significantly increased turnover on rotenone treatment are colored in red, blue and green. Iron sulfur clusters are shown as sticks. Subunits colored in black were detected in the PRM assay but did not show a significant change in turnover on treatment after an 8 h pulse. Subunits in light gray could not be robustly monitored in the PRM assay.
Fig. 6.
Fig. 6.
Analysis of proteoform resolved protein turnover. A, Distributions of coefficients of variation of turnover rates across spectra are displayed for peptides and proteins. The upper panel shows the distribution of CVs of all spectra for the same protein group (irrespective of the number of proteins or protein isoforms in each group). The bottom panel shows the CV distribution of all spectra for protein groups that only contain a single protein. Medians are indicated by vertical lines in the corresponding color. B, Scatter dot plots depict the distributions of turnover rate constants for peptides of different protein isoforms. Peptides corresponding to a gene share the same color. Median peptide rates across replicates are shown as vertical lines. C, Turnover rates are shown for different modified N-terminal peptides and corresponding proteins. Only N termini and proteins with statistically significantly different rates are displayed (see also supplemental Fig. S6C). D, Scatter plots illustrate peptide turnover rates as a function of the relative position within the protein sequence. Zero denotes the N terminus and 1 denotes the C terminus of a protein. Peptides from each protein are denoted by the same color whereas closed circles denote peptides that exhibit significantly different turnover compared with the rate of the whole protein (see also supplemental Fig. S6B). The left panel shows examples for mitochondrial proteins in which the N-terminal transit peptides shows a higher turnover than other peptides of the same protein. The middle panel shows a similar analysis but for proteins with higher turnover C-terminal peptides. The right panel shows examples for proteins in which one peptide displayed a strong difference in turnover compared with other peptides of the same protein which often but not always encompass known modification sites. E, Fractional peptide labeling is depicted for cathepsin D (CTSD), a protein that is proteolytically processed into a signal peptide, an activation peptide (blue circles), a light chain (red circles) and a heavy chain (gray circles). F, Fractional peptide labeling is depicted for the fusion protein FAU. Peptides representing the Ubiquitin-like protein FUBI are shown in blue, peptides from the 40S ribosomal protein S30 are shown in gray.

References

    1. Wilhelm M., Schlegl J., Hahne H., Gholami A. M., Lieberenz M., Savitski M. M., Ziegler E., Butzmann L., Gessulat S., Marx H., Mathieson T., Lemeer S., Schnatbaum K., Reimer U., Wenschuh H., Mollenhauer M., Slotta-Huspenina J., Boese J.-H., Bantscheff M., Gerstmair A., Faerber F., and Kuster B. (2014) Mass-spectrometry-based draft of the human proteome. Nature 509, 582. - PubMed
    1. White A. (1942) The Dynamic State of Body Constituents. Yale J. Biol. Med. 14, 677–677
    1. Hinkson I. V., and Elias J. E. (2011) The dynamic state of protein turnover: It's about time. Trends Cell Biol. 21, 293–303 - PubMed
    1. Wheatley D. N., Giddings M. R., and Inglis M. S. (1980) Kinetics of degradation of ‘short-’ and ‘long-lived’ proteins in cultured mammalian cells. Cell Biol. Int. Reports 4, 1081–1090 - PubMed
    1. Dittrich A., Siewert E., and Schaper F. (2013) Determination of Protein Turnover Rates in the JAK/STAT Pathway Using a Radioactive Pulse-Chase Approach. In: Nicholson S. E., and Nicola N. A., eds. JAK-STAT Signalling: Methods and Protocols, pp. 69–80, Humana Press, Totowa, NJ - PubMed

Publication types

Associated data