. 2018 Apr 13;293(15):5492-5508.
doi: 10.1074/jbc.RA117.000820. Epub 2018 Feb 2.

Structure and biophysical characterization of the human full-length neurturin-GFRa2 complex: A role for heparan sulfate in signaling

Affiliations

Structure and biophysical characterization of the human full-length neurturin-GFRa2 complex: A role for heparan sulfate in signaling

Jenny Sandmark et al. J Biol Chem. .

Abstract

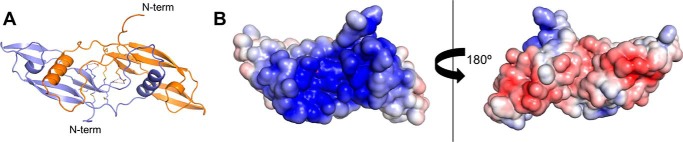
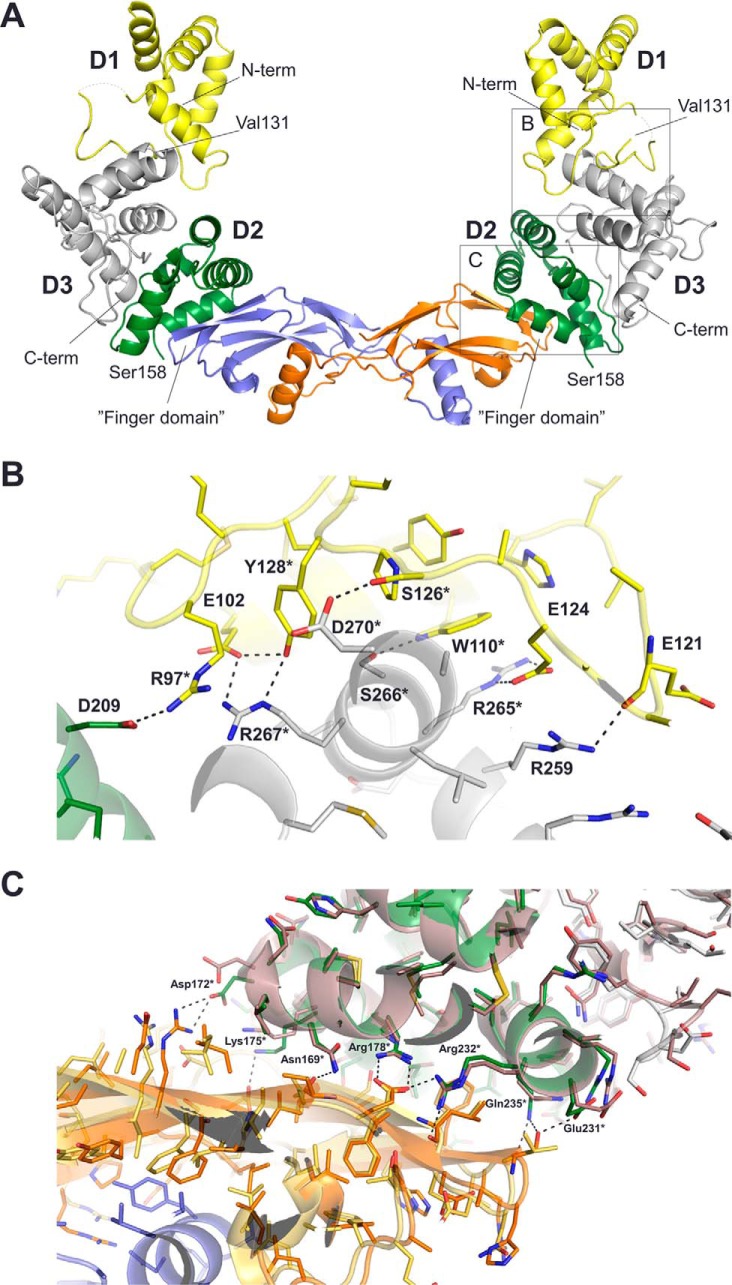
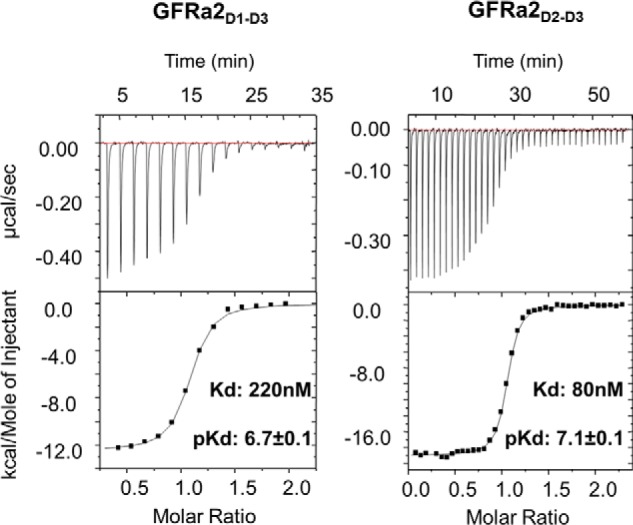
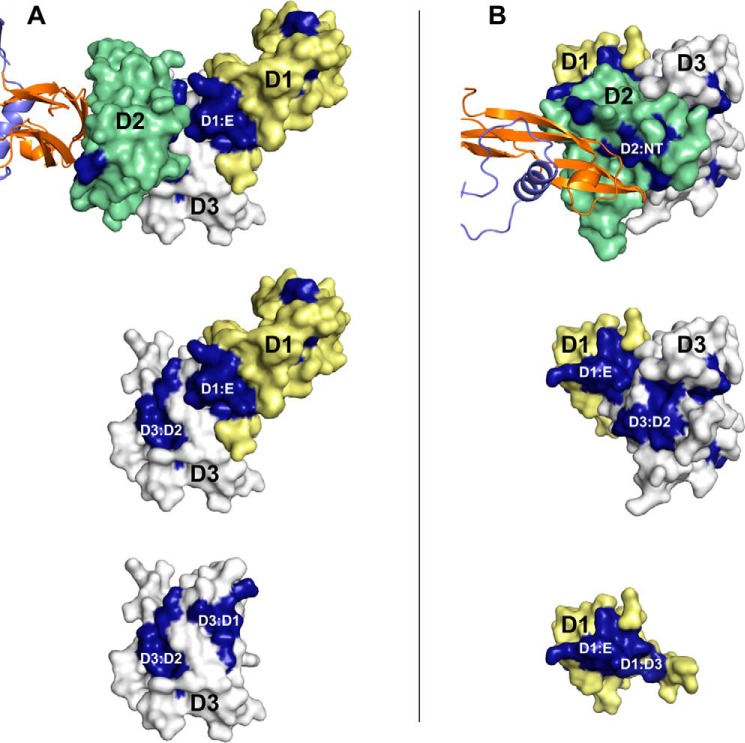
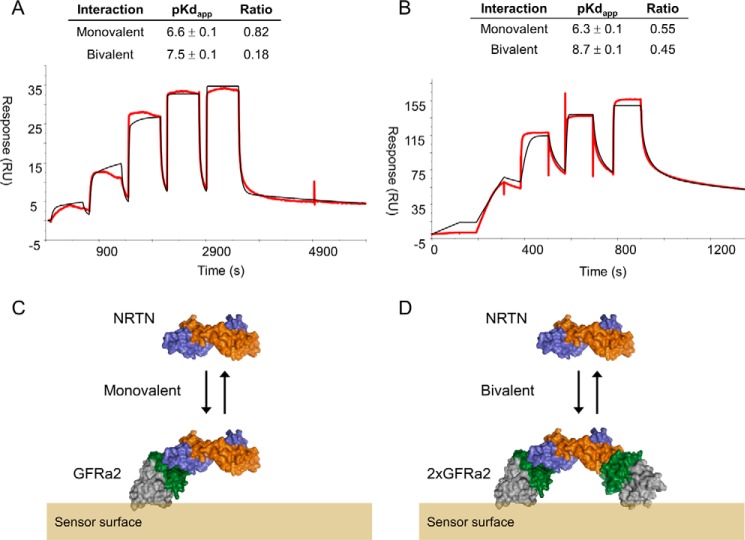
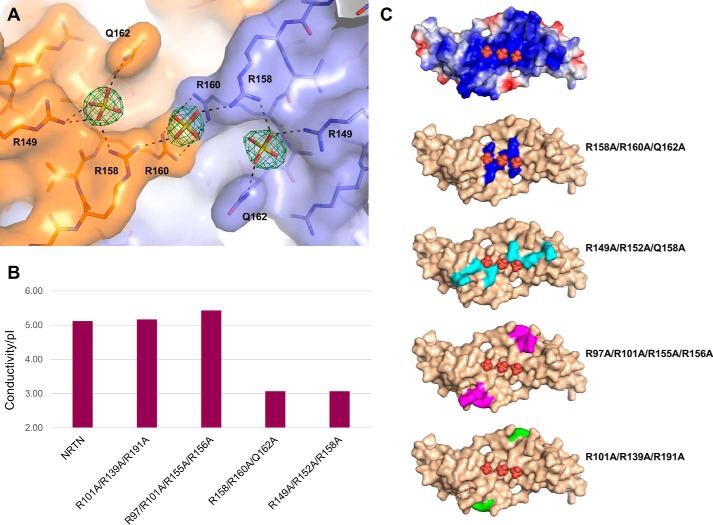
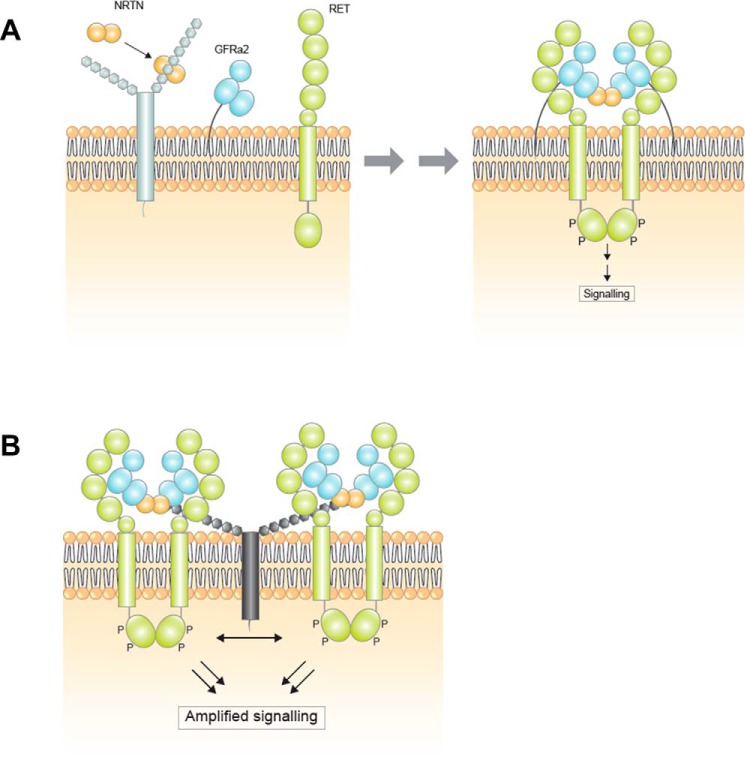
Neurturin (NRTN) provides trophic support to neurons and is considered a therapeutic agent for neurodegenerative diseases, such as Parkinson's disease. It binds to its co-receptor GFRa2, and the resulting NRTN-GFRa2 complex activates the transmembrane receptors rearranged during transfection (RET) or the neural cell adhesion molecule (NCAM). We report the crystal structure of NRTN, alone and in complex with GFRa2. This is the first crystal structure of a GFRa with all three domains and shows that domain 1 does not interact directly with NRTN, but it may support an interaction with RET and/or NCAM, via a highly conserved surface. In addition, biophysical results show that the relative concentration of GFRa2 on cell surfaces can affect the functional affinity of NRTN through avidity effects. We have identified a heparan sulfate-binding site on NRTN and a putative binding site in GFRa2, suggesting that heparan sulfate has a role in the assembly of the signaling complex. We further show that mutant NRTN with reduced affinity for heparan sulfate may provide a route forward for delivery of NRTN with increased exposure in preclinical in vivo models and ultimately to Parkinson's patients.

Keywords: GDNF; GFRa; RET; avidity; cell signaling; crystallography; glial cell-derived neurotrophic factor; heparan sulfate; heparin; surface plasmon resonance (SPR).


Conflict of interest statement

All authors were employed by AstraZeneca/MedImmune when producing the data presented in this manuscript

Figures

Figure 1.
Figure 1.
Crystal structures of NRTN. A, crystal structure of the NRTN homodimer in cartoon colored by subunit (left). Side chains of cysteines and Arg-166 as well as the main chain of the C terminus are shown as sticks. The hydrogen bonds (2.8–3.2 Å) between the C termini and Arg-166 are shown as dashed lines. B, surface representation of the crystal structure with display of electrostatic surface charge (+5 to −5 mV) shows that the NRTN homodimer bears a positively charged cleft on the concave side (left), whereas the other side is slightly acidic (right). The left panel is in the same orientation as in A, and the right panel is rotated 180°.
Figure 2.
Figure 2.
Crystal structure of the NRTN–GFRa2D1-D3 complex. A, crystal structure of the NRTN–GFRa2D1-D3 complex. The NRTN homodimer is colored by subunit (orange, purple), and the two copies of GFRa2D1-D3 are colored by domain: D1 (yellow), D2 (green), and D3 (gray). The N and C termini are labeled. The linker between Val-131 and Ser-158, connecting D1 and D2, is missing in the structure. B, detailed view of the boxed region in A highlighting some of the interactions in the GFRa2 D1/D3 interface. GFRa2 is colored by domain, D1 (yellow), D2 (green), and D3 (gray). Residues that are strictly conserved between GFRa1–3 are marked with an asterisk; these include Arg-265–Ser-266–Arg-267 that make up a conserved RSR motif. Glu-102 and Glu-124 are conserved between GFRa2 and GFRa1. Arg-97, Trp-110, Tyr-128, Arg-265, and Arg-267 are also strictly conserved in GFRa4 sequences in species that has retained D1. Arg-267 forms hydrogen bonds to Glu-102 and Tyr-128 from D1 and has a stacking interaction with Arg-97. Arg-265 forms a hydrogen bond to Glu-124 and stacks against the side chain of Trp-110 from D1. In addition, Trp-110 forms a hydrogen bond to Ser-266. Arg-259 is within hydrogen bonding distance to the main chain of Glu-121. The only direct interaction observed between D1 and D2 is a hydrogen bond between Arg-97 and Asp-209. Distances equivalent to hydrogen bonds (2.8–3.2 Å) are shown as dashed lines. C, comparison between the GFRa2 and GFRa1 GFL-binding surfaces. The crystal structure of the NRTN–GFRa2D2-D3 complex (NRTN is colored orange and purple; GFRa2 D2 is colored green, and D3 is colored gray) overlaid with the GDNF–GFRa1 crystal structure (PDB code 2v5e, GDNF is colored yellow and GFRa1 is colored dark gray). The figure shows a section of the boxed region from A with 2v5e superimposed. The displayed section is representative of the entire interface. 17 of the 19 residues that interact directly with GDNF or NRTN are conserved between GFRa1 and GFRa2 (GFRa2 Ser-183 corresponds to GFRa1 Thr-176 and Asn-186 corresponds to Thr-179, not shown in the figure). Only residues from D2 are involved in NRTN/GDNF binding. Distances equivalent to hydrogen bonds (2.8–3.2 Å) are shown as dashed lines.
Figure 3.
Figure 3.
Affinity between GFRa2 and NRTN determined by ITC. Shown are ITC titrations of GFRa2D1-D3 or GFRa2D2-D3 to NRTN. Example data were from triplicate measurements. Molar ratios are close to 1, showing that one NRTN homodimer binds two GFRa2 molecules. The equilibrium dissociation constants for GFRa2D1-D3 and GFRa2D2-D3 binding to NRTN are significantly different but of similar magnitude. GFRa2D1-D3 has a worse affinity to NRTN indicating that presence of D1 of GFRa2 does not improve its affinity to NRTN.
Figure 4.
Figure 4.
Conserved residues between GFRa1–3 are mapped on the NRTN–GFRa2D1-D3 crystal structure. Mapping of the conserved regions on the crystal structure of NRTN–GFRa2D1-D3 shows that all domain interfaces are conserved as well as the NRTN-binding site on D2. In addition, there is an excess conserved area on D1 (D1:E) that is not involved in interdomain interactions. GFRa2 is shown as surface with D1 (yellow), D2 (green), and D3 (gray). NRTN is shown in cartoon (orange, purple). The conserved patches (dark blue) correspond to the NRTN/D2 (D2:NT), D2/D3, and D1/D3 interfaces. The excess unpaired conserved region on D1 (D1:E) is available for interactions with RET and/or NCAM. A, same orientation is used in the three panels, whole receptor (top), D1 and D3 (middle), and D3 only (bottom). B, rotated view compared A to view the receptor from the GFL (∼90° rotation around x and y axes). The same orientation is used in the three panels, the whole receptor (top), D1 and D3 (middle), and D1 only (bottom).
Figure 5.
Figure 5.
Affinity between NRTN and GFRa2D1-D3 at high- and low-surface density of GFRa2. SPR experimental traces (red) of NRTN injected over GFRa2D2-D3 immobilized at low-surface density (A, 90 response units (RU) immobilized protein) or high-surface density (B, 420 RU immobilized protein). Black lines represent the fit of a model composed of two separate equilibria resulting in two apparent Kd values and two apparent maximum responses (Rmax). This model is a simplification of which binding events actually occur on the sensor chip (see under “Discussion”), but this roughly corresponds to a weaker affinity of NRTN binding monovalency (C) and a stronger affinity for NRTN binding bivalency (D) to immobilized GFRa2. The model also provides an estimation of the contribution of the two interactions to the overall binding signal by calculating a ratio (ratio = Rmax, 1 or Rmax, 2/(Rmax, 1 + Rmax, 2)) for each surface density. The ratio suggests that the contribution of the high-affinity interaction to the overall binding signal is larger at higher surface densities. This is in line with bivalent binding avidity as the ability to form bivalent complexes increases when the GFRa2 density is higher. Average and standard deviations were obtained from duplicate measurements.
Figure 6.
Figure 6.
NRTN mutants and heparin binding. A, three sulfate ions (sticks) are bound in the NRTN charged cleft and are coordinated by side chains from both subunits (orange and purple, respectively). The initial FoFc difference density map is contoured at 3.0 σ (green). Hydrogen bonds to the protein are marked with dashed lines. B, binding of wildtype and mutant NRTN to heparin. Ionic strength in relation to the isoelectric point (conductivity/pI) is required for different variants of NRTN to be eluted from a heparin column. Removal of positively charged amino acid residues, even in the strongly basic area in the vicinity of the sulfate ions, only changed the affinity to a heparin-Sepharose matrix proportionally to the lost surface charge. For the mutations affecting the sulfate-coordinating residues, the heparin affinity is unproportionally lower, indicating that these residues are important for a specific heparin interaction. C, surface representation of NRTN from the crystal structure of the NRTN–GFRa2D2-D3–SO4 complex. The three sulfate ions in the charged cleft are shown as spheres. The electrostatic surface charge (top) is calculated in PyMOL with default settings. Residues that are replaced by alanines in the mutant NRTN variants are highlighted: R158A/R160A/Q162A (blue), R149A/R152A/R158A (cyan), R97A/R101A/R155A/R156A (magenta), and R101A/R139A/R191A (green), respectively.
Figure 7.
Figure 7.
Models for NRTN-mediated signaling complexes and role of HS. A, NRTN (orange) binds to proteoglycans bearing unbranched HS chains (gray) on the cell surface, enriching the local concentration. The complete signaling complex is then formed between NRTN, membrane-anchored GFRa2 (blue), and the transmembrane receptor RET (green), leading to dimerization and phosphorylation of the intracellular kinase domain of RET and downstream signaling. B, clustering of complexes is required for cell signaling. NRTN (orange), GFRa2 (blue), and RET (green). NRTN binds to GFRa2 molecules that are anchored in lipid rafts in the membrane, with the aid of proteoglycans bearing unbranched HS chains. RET is recruited into the lipid rafts when binding to the NRTN–GFRa2 complex.

References

    1. Airaksinen M. S., and Saarma M. (2002) The GDNF family: signaling, biological functions and therapeutic value. Nat. Rev. Neurosci. 3, 383–394 10.1038/nrn812 - DOI - PubMed
    1. Kotzbauer P. T., Lampe P. A., Heuckeroth R. O., Golden J. P., Creedon D. J., Johnson E. M. Jr, and Milbrandt J. (1996) Neurturin, a relative of glial-cell-line-derived neurotrophic factor. Nature 384, 467–470 10.1038/384467a0 - DOI - PubMed
    1. Marks W. J. Jr., Bartus R. T., Siffert J., Davis C. S., Lozano A., Boulis N., Vitek J., Stacy M., Turner D., Verhagen L., Bakay R., Watts R., Guthrie B., Jankovic J., Simpson R., et al. (2010) Gene delivery of AAV2-neurturin for Parkinson's disease: a double-blind, randomised, controlled trial. Lancet Neurol. 9, 1164–1172 10.1016/S1474-4422(10)70254-4 - DOI - PubMed
    1. Fjord-Larsen L., Johansen J. L., Kusk P., Tornøe J., Grønborg M., Rosenblad C., and Wahlberg L. U. (2005) Efficient in vivo protection of nigral dopaminergic neurons by lentiviral gene transfer of a modified neurturin construct. Exp. Neurol. 195, 49–60 10.1016/j.expneurol.2005.03.006 - DOI - PubMed
    1. Horger B. A., Nishimura M. C., Armanini M. P., Wang L. C., Poulsen K. T., Rosenblad C., Kirik D., Moffat B., Simmons L., Johnson E. Jr., Milbrandt J., Rosenthal A., Bjorklund A., Vandlen R. A., Hynes M. A., and Phillips H. S. (1998) Neurturin exerts potent actions on survival and function of midbrain dopaminergic neurons. J. Neurosci. 18, 4929–4937 - PMC - PubMed

MeSH terms

LinkOut - more resources